Bantlar ve Kanallar

MechArt Moving Average and % Above V1.1MechArt Moving Average and % Above V1.1
Unlock the power of custom analysis with this Adjustable Moving Average Indicator! Whether you're a day trader, swing trader, or long-term investor, this tool helps you track price action with precision and flexibility. Tailor your trading strategy to your needs by adjusting the type of moving average, price triggers, and percentage levels.
🔑 Key Features:
Choose Your Moving Average Type 🌀
Select from four popular moving averages:
SMA (Simple Moving Average)
EMA (Exponential Moving Average)
WMA (Weighted Moving Average)
VWMA (Volume Weighted Moving Average)
Find the one that best fits your trading style!
Adjustable Trigger Price
Choose between four price types to trigger signals:
Open
High
Low
Close
Pick the price type that makes the most sense for your strategy!
Percentage Above the Moving Average 📈🔽
Set a custom percentage above the moving average to generate alerts when the price reaches key levels.
Customizable Alerts 🔔
Get notified when the price is above the target price or below the moving average. Perfect for timely trades!
📉 Visual Alerts:
🔴 Red Background: When the selected price is above the target price (percentage above the moving average).
🟩 Green Background: When the selected price is below the moving average.
🚀 How This Indicator Helps You:
Precision 🎯: Visual signals with clear red and green backgrounds help you make quick decisions based on the price's relationship to your moving average.
Flexibility 🔄: Customize the type of moving average and the price used for triggers to fit your trading style.
📊 Perfect For:
Swing Traders 📈: Use the indicator to identify price trends and reversals based on moving averages.
Day Traders ⏳: Set short-term percentage levels to catch immediate price movements.
Long-Term Investors 💼: Track longer-term trends and set alerts when prices deviate significantly from your moving average.
Take control of your trading strategy with this Adjustable Moving Average Indicator and start making more informed decisions today! 🏅
Change from V1.0: Fixed Timeframe setting to match chart.

MechArt Moving Average and % Above V1.0MechArt Moving Average and % Above V1.0
Unlock the power of custom analysis with this Adjustable Moving Average Indicator! Whether you're a day trader, swing trader, or long-term investor, this tool helps you track price action with precision and flexibility. Tailor your trading strategy to your needs by adjusting the type of moving average, price triggers, and percentage levels.
🔑 Key Features:
Choose Your Moving Average Type 🌀
Select from four popular moving averages:
SMA (Simple Moving Average)
EMA (Exponential Moving Average)
WMA (Weighted Moving Average)
VWMA (Volume Weighted Moving Average)
Find the one that best fits your trading style!
Adjustable Trigger Price
Choose between four price types to trigger signals:
Open
High
Low
Close
Pick the price type that makes the most sense for your strategy!
Percentage Above the Moving Average 📈🔽
Set a custom percentage above the moving average to generate alerts when the price reaches key levels.
Customizable Alerts 🔔
Get notified when the price is above the target price or below the moving average. Perfect for timely trades!
📉 Visual Alerts:
🔴 Red Background: When the selected price is above the target price (percentage above the moving average).
🟩 Green Background: When the selected price is below the moving average.
📅 Adjustable Timeframe:
Choose the timeframe that suits you! Whether you're trading on a 1-minute chart, 1-hour, 1-day, or 1-week, this indicator works for all timeframes.
🚀 How This Indicator Helps You:
Precision 🎯: Visual signals with clear red and green backgrounds help you make quick decisions based on the price's relationship to your moving average.
Flexibility 🔄: Customize the type of moving average and the price used for triggers to fit your trading style.
📊 Perfect For:
Swing Traders 📈: Use the indicator to identify price trends and reversals based on moving averages.
Day Traders ⏳: Set short-term percentage levels to catch immediate price movements.
Long-Term Investors 💼: Track longer-term trends and set alerts when prices deviate significantly from your moving average.
Take control of your trading strategy with this Adjustable Moving Average Indicator and start making more informed decisions today! 🏅

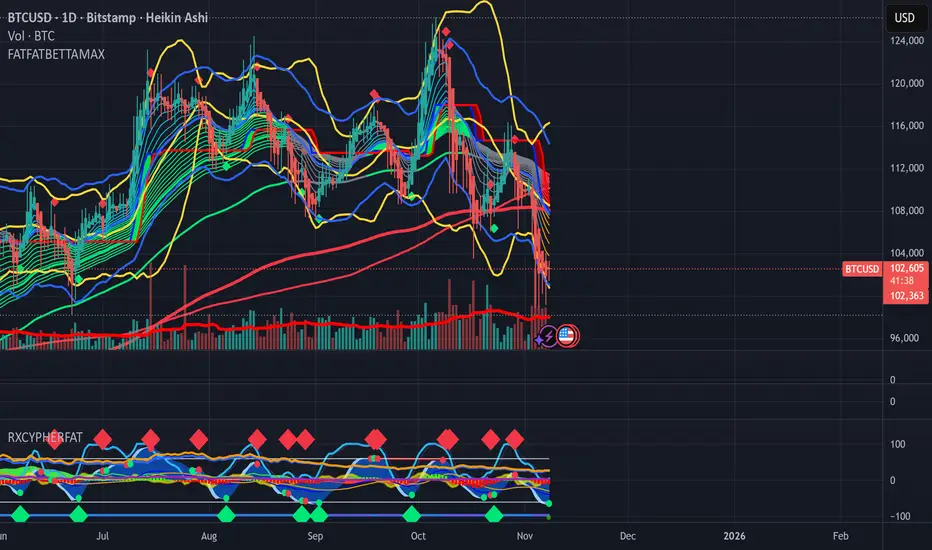
FATFATBETTATRENDMAXCustom All-In-One indicator with Super Guppy, BB, KC, AlphaTrend
Custom Trend Signal Diamonds based on Momentum waves, MACD, RSI, STOCH, VWAP, OBV A/D, CVD, BBP, OI
BullTrader - ParabolicSARFlipSignals(NonRepainting)TP/SL🧠 Purpose & Concept
This indicator refines Wilder’s Parabolic SAR into a simple, non‑repainting alert and visualization system that marks each confirmed trend flip with a clear buy or sell signal.
It also auto‑generates dynamic, ATR‑based Take‑Profit (TP) and Stop‑Loss (SL) levels, keeps them updating with price in real time, and displays the current market bias in an on‑chart table.
The goal: clarity and automation without complexity — see exactly when a new bullish or bearish phase begins, what your current TP/SL targets are, and receive a single clean alert for every new flip.
⚙️ How It Works
1. The built‑in ta.sar() function tracks the Parabolic SAR dots.
2. When a candle closes across the SAR line, a trend‑change is confirmed:
• Price crossing above a SAR dot → Buy Flip (green triangle).
• Price crossing below a SAR dot → Sell Flip (red triangle).
3. On each flip, the indicator calculates dynamic ATR‑based TP / SL targets:
TP = entry ± (ATR × tpMult) and SL = entry ∓ (ATR × slMult)
These values move automatically as the trend develops.
4. A small floating label beside the latest bar shows live‑updated TP / SL numbers.
5. A color‑coded table in the upper‑right corner displays the current trend: Lime = Bullish, Red = Bearish, Yellow = Neutral.
6. Each new flip triggers an easy‑to‑use Buy / Sell alert after the bar closes—no repainting.
🔔 Alerts
Alert Name Triggers When Message
SAR Buy Flip Alert Green triangle (bullish reversal) “BUY Flip — Parabolic SAR on {{ticker}} ({{interval}})”
SAR Sell Flip Alert Red triangle (bearish reversal) “SELL Flip — Parabolic SAR on {{ticker}} ({{interval}})”
📈 Chart Elements
Element Meaning
🟠 Orange cross Standard Parabolic SAR trail.
🟢 / 🔴 Triangles Confirmed buy / sell flips (non‑repainting).
Bright lime/red TP‑SL box Live ATR targets that move with price.
Trend table (top‑right) Instant status of bullish/bearish bias.
✅ Features & Highlights
Non‑repainting — all signals confirm on closed bars.
Visual clarity — single pair of bright triangles for flips.
Dynamic ATR‑based TP / SL values that auto‑trail with trend.
Always‑visible trend summary table.
Two ready‑made alert types (Buy / Sell).
Lightweight and optimized for any timeframe or symbol.
💡 Best Use
Ideal for traders who prefer clean trend‑based entries and volatility‑adaptive exits without signal clutter:
Pair it with your existing strategy or use it standalone for reversal‑based swing and intraday trading.

ADX Trend Strength Filter + TRAMA [DotGain]Summary
Are you tired of trading trend signals, only to get stopped out in volatile, sideways chop?
The ADX Trend Strength Filter (ADX TSF) is designed to solve this exact problem. It is a comprehensive trend-following system that only generates signals when a trend not only has the right direction and momentum, but also sufficient strength.
This indicator filters out weak or indecisive market phases (the "chop") and will only color the bars Green or Red when all conditions for a strong, confirmed trend are met.
⚙️ Core Components and Logic
The ADX TSF relies on a triple-filter logic to generate a clear trade signal:
Trend Filter (TRAMA): A TRAMA (Trending Adaptive Moving Average) is used as the main trendline. This adaptive average automatically adjusts to market volatility, acting as a dynamic support/resistance level.
Price > TRAMA = Bullish
Price < TRAMA = Bearish
Momentum Filter (RSI Crossover): Momentum is measured by a crossover of two moving averages of the RSI (a fast EMA and a slow SMA). This confirms whether the momentum is pointing in the same direction as the trend.
Strength Filter (ADX): This is the most important filter. A signal is only considered valid if the ADX (Average Directional Index) is above a defined threshold (Default: 30). This ensures the trend has sufficient strength.
🚦 How to Read the Indicator
The indicator has three states, displayed directly as bar colors on your chart:
🟩 GREEN BARS (Strong Uptrend) All three conditions are met:
Price is above the TRAMA.
RSI momentum is bullish (Fast MA > Slow MA).
ADX is above 30 (Strong trend is present).
🟥 RED BARS (Strong Downtrend) All three conditions are met:
Price is below the TRAMA.
RSI momentum is bearish (Fast MA < Slow MA).
ADX is above 30 (Strong trend is present).
🟧 ORANGE BARS (Neutral / Caution) This state appears if any of the following conditions are true:
Weak Trend: The ADX is below 30. The market is in consolidation or a sideways phase. (This is the primary filter!)
Indecision: The price is caught in the "Neutral Zone" between the TRAMA and the 200 SMA.
Visual Elements
Bar Colors: (Green/Red/Orange) Show the current trend status.
TRAMA (Orange Line): Your primary adaptive trendline.
200 SMA (White Line): Serves as a reference for the long-term trend.
Orange Background (Fill): Fills the area between the TRAMA and SMA to visually highlight the "Neutral Zone."
Key Benefit
The goal of the ADX TSF is to keep traders out of weak, unpredictable markets and help them participate only in strong, momentum-confirmed trends.
Have fun :)
Disclaimer
This "Buy The F*cking Dip" (BTFD) indicator is provided for informational and educational purposes only. It does not, and should not be construed as, financial, investment, or trading advice.
The signals generated by this tool (both "Buy" and "Sell") are the result of a specific set of algorithmic conditions. They are not a direct recommendation to buy or sell any asset. All trading and investing in financial markets involves substantial risk of loss. You can lose all of your invested capital.
Past performance is not indicative of future results. The signals generated may produce false or losing trades. The creator (© DotGain) assumes no liability for any financial losses or damages you may incur as a result of using this indicator.
You are solely responsible for your own trading and investment decisions. Always conduct your own research (DYOR) and consider your personal risk tolerance before making any trades.

BullTrader - ParabolicSARFlipSignals(NonRepainting)🧠 Concept & Purpose
This indicator isolates the confirmed trend‑change events produced by the Parabolic SAR and turns them into direct, non‑repainting trade signals.
Instead of plotting every SAR dot as a potential entry, it marks only the bars where price has closed across the SAR line, confirming a genuine flip from bullish → bearish or vice versa.
Each confirmed flip is displayed with a single triangle on the chart and can be connected to alerts.
The design is intentionally minimal: one simple but reliable algorithmic definition of “the trend just turned.”
⚙️ How It Works
1. The script calculates the standard Parabolic SAR value using the built‑in ta.sar() function.
2. When a candle closes above a SAR dot that was previously above price → uptrend starts (Buy Signal).
3. When a candle closes below a SAR dot that was previously below price → downtrend starts (Sell Signal).
4. Signals are confirmed only after the bar closes (barstate.isconfirmed), guaranteeing no repainting.
5. Each event can trigger an alert or simply serve as a visual reversal marker.
📈 Chart Elements
Element Description
🟠 Orange cross dots Standard Parabolic SAR trail.
🟢 Triangle below bar Confirmed SAR flip up → new bullish phase.
🔴 Triangle above bar Confirmed SAR flip down → new bearish phase.
Optional green/red background Highlights bars where a confirmed flip occurred.
🔔 Alerts
Use buySignalFinal for Buy alerts and sellSignalFinal for Sell alerts.
Set alerts to “Once per bar close” to match the non‑repainting confirmation logic.
📊 Best Use
* Identifying clear trend reversals.
* As an entry / exit overlay for manual trading.
* As a base signal for automated or alert‑driven systems.
This version keeps the indicator fast, reproducible, and completely non‑repainting — ideal for traders who prefer transparent and verifiable signals derived directly from Per J. Wilder’s original Parabolic SAR formula.


BUY/SELL/R/BBuy/Sell/R/B by SeanKidd
Purpose: A clean, anchored signal system combining StochRSI crossovers, CVI top/bottom detection, and a MACD direction line that moves with price.
⚙️ How It Works
BUY / SELL – Generated from a higher-timeframe StochRSI crossover.
BUY (Green) → %K crosses above %D
SELL (Red) → %K crosses below %D
R (Reverse) – Yellow “R” appears above the candle when the CVI model detects a local top or exhaustion point.
B (Bottom) – Blue “B” appears below the candle when CVI detects a local bottom.
MACD Direction Line –
Green = MACD above Signal → bullish momentum
Red = MACD below Signal → bearish momentum
The line rides just above the candles, offset by ATR so it always tracks price.
🧭 How to Use It
Add the indicator:
Search for Buy/Sell/R/B by SeanKidd under Community Scripts.
Click ★ to favorite it.
Apply it to your chart.
Open ⚙️ Settings → Inputs
Calculation Timeframe (StochRSI) → pick how fast or slow you want signals (default Weekly).
MACD Line Offset (ATR ×) → raise or lower the MACD line if it overlaps candles.
Adjust Top/Bottom thresholds to control how often R/B appear.
Toggle Highlight bars or Color candles for visual clarity.
Go to Settings → Scales and ensure it’s set to
✅ “Scale with Price Chart” or
✅ same scale side as the candles.
This keeps everything perfectly attached to the chart.
Optional: Add alerts
Create → Alert → Condition → Buy/Sell/R/B by SeanKidd
Choose: SRSI BUY, SRSI SELL, Top (R), or Bottom (B).
📈 Reading the Chart
Marker Meaning Color Position
BUY StochRSI %K cross above %D Lime Below bar
SELL StochRSI %K cross below %D Red Above bar
R CVI-detected top / reversal Yellow Above bar
B CVI-detected bottom Blue Below bar
Line MACD momentum direction Green/Red Above highs
💡 Tips
Works on any symbol or timeframe.
Slower charts (Daily–Weekly) give cleaner swing signals.
Faster charts (15m–1h) show short-term reversals.
Combine the MACD line direction with BUY/SELL for stronger confirmation.

Fractional + Heikin-Ashi Candlestick – CF / ABNew model of Candlestick, Tis model constructed on Fractional Calculus mathematical, use two kernel - Caputo-Fabrizio and Atangana-Baleanu.

Aroon with RSI Confirmation (92.86%)This script is an analytical tool designed to identify moments in market behavior when price momentum is shifting. It does this by combining two concepts: **Aroon Levels** (to measure trend maturity) and **RSI Slope Behavior** (to measure short-term momentum pressure).
**Functional Concept (Professional Description)**
The indicator examines when either the *Aroon Up* or *Aroon Down* value reaches approximately **92.86%**, which statistically represents a phase where price has recently made an extreme high or low relative to the selected period. This level suggests the trend is nearing a point of *decision*—either continuation or exhaustion.
At the same time, the script analyzes the **relationship between the RSI and its smoothed average**. The difference between the two reflects whether momentum is accelerating in the current direction or slowing. A small difference indicates **market stability**, while whether RSI is positioned above or below the smoothed line indicates **who has control**—buyers or sellers.
By requiring both conditions to align, the script filters out random noise and highlights moments where **trend structure and momentum sentiment converge**.
* **Buy Signal:** Occurs when the market has recently formed a significant low (Aroon Down ≈ 92.86) and buyers begin to regain control (RSI crosses above its smoothed value with low volatility).
* **Sell Signal:** Occurs when the market has recently reached a significant high (Aroon Up ≈ 92.86) and sellers begin to dominate (RSI slips below its smoothed value with low volatility).
---
**Psychological Interpretation**
Markets are driven by cycles of **attention**, **emotion**, and **participation**.
This script targets moments when:
1. **Price has made a meaningful extreme** (a recent new high or low).
This is where crowd sentiment is often strongest—either euphoria near highs or pessimism near lows.
2. **Traders are reassessing direction**, shown by momentum flattening (small RSI difference).
This reveals that participants are hesitating, watching, and waiting.
The market is effectively *thinking*.
3. **Control shifts subtly**, when RSI moves relative to its smoothed trend.
This indicates that early, informed participation is beginning to form—before the broader crowd reacts.
In psychological terms, the script highlights the **transitional turning points** where:
* Fear begins to weaken and confidence returns (buy setup), or
* Confidence begins to crumble and caution emerges (sell setup).
These are the earliest moments when market sentiment **changes hands**, often preceding visible trend reversals. The indicator is not reacting to outcomes—it is observing the underlying shift in **decision-making pressure** among market participants.
---
In essence, this tool identifies **behavioral inflection points**—where the market transitions from one emotional state to the next—providing traders with signals grounded in both structural trend positioning and real-time crowd momentum behavior.

CME Close PriceThis script adds the closing price of another asset on your chart, such as the BTC1! Futures Price on your BTC Spot Chart for example.

RSI BandsPlots adaptive ATR bands around the 27-EMA to approximate RSI overbought and oversold zones directly on price. Provides a clean visual reference for RSI-like extremes without displaying the RSI itself.

9:30 AM MarkerThe 9:30 AM Market Open Marker (NYC) indicator automatically plots a vertical line at 9:30 AM New York time, marking the official U.S. stock market open for each trading day.
This visual reference helps traders quickly identify the start of the regular trading session, align intraday strategies, and analyze pre-market and post-market behavior relative to the official open.
Perfect for:
Day traders and scalpers tracking session openings.
Futures traders (e.g., ES, NQ) analyzing volatility around 9:30 AM.
Anyone studying liquidity shifts and structure transitions between pre-market and RTH (Regular Trading Hours).
Features:
Draws a clean vertical line at 9:30 AM NY time for every day.
Optional customizable color and style for clear visual separation.
Works on any timeframe and automatically adjusts for daylight-saving time.

Day of Week (NYC)The Day of Week (NYC) indicator displays the weekday name (Monday, Tuesday, Wednesday, etc.) at the bottom of a separate panel, synchronized with midnight New York time (00:00) for each trading day.
It’s designed to help traders visually distinguish between sessions while keeping the main price chart clean and uncluttered.
The labels remain fixed in their own panel, so they never move in front of candles or interfere with price action.
Perfect for:
Intraday and futures traders who use New York session timing as reference.
Journalers and analysts who review daily session performance.
Anyone who wants clear visual day separators without overlapping chart elements.
Features:
Automatically adapts to NY time (EST/EDT).
Displays weekday names for every new trading day.
Minimalist gray text for a clean, non-distracting look.

Daily Midnight Marker (NYC)This indicator automatically plots a vertical line at midnight (00:00) New York time on every trading day.
Each line is drawn in light gray to mark the start of a new day, helping traders visually separate daily sessions.
A weekday label (e.g., Monday, Tuesday, Wednesday...) is displayed to the right of each line, making it easy to identify daily transitions when analyzing intraday price action or reviewing trading sessions.
Perfect for traders who:
Trade based on daily session structure or pre-market setups
Use NY time as a market reference
Prefer a clean and minimal visual day separator

Daily Midnight Marker (NYC)Daily Midnight Marker (NYC) automatically plots a vertical light-gray line on your chart at midnight New York time (00:00) to visually mark the start of each trading day.
A small label is displayed at the bottom of the line that reads “Day Start”, helping traders quickly identify daily session boundaries.
This indicator is especially useful for:
Futures or forex traders referencing New York session time
Intraday analysts who want to distinguish daily ranges
Backtesting or reviewing overnight/pre-market activity
Features:
Plots at 00:00 NYC time daily
Light gray, clean design to avoid clutter
Optional label under each day start

6 AM Marker6 AM Marker – Daily Premarket Reference Line
This indicator automatically plots a vertical dotted line at 6:00 AM (local chart time) on every trading day.
It’s designed for traders who track premarket activity and want a clear visual reference of when the early market hours begin.
Features:
Marks 6:00 AM on all trading days automatically
Works on any timeframe
Adjustable timezone (e.g., America/New_York, America/Los_Angeles)
Clean, minimal visual style — perfect for day traders using NQ, ES, or other futures
This simple visual tool helps identify premarket ranges, overnight sessions, and morning setups with precision.

Confirmed Momentum QQQ (RSI/MACD Filter)Gemini and Myself,
How This Targets a Higher Win Rate
The key to the win rate increase is the RSI 20/80 filter.
Long Signal: A long entry is now only taken if the trend is up (SMA cross), the MACD is bullish, and the RSI is not overbought (below 80). By only entering when momentum is not yet exhausted, you increase the chance that the price can travel far enough to hit your 4.0 point Take Profit.
Wider SL: The wider Stop Loss of 2.5 points reduces the chance of being stopped out prematurely by routine market movements (whipsaws), which is the number one killer of win rates in high-frequency trading.
After applying these changes, you will need to run the Strategy Tester again to see the new win rate and the new total number of trades.
Would you like me to help you interpret the new Strategy Tester results once you apply these settings?

Level LinesThis indicator displays levels in close proximity to the current price, enabling users to identify psychological levels on charts that serve as support/resistance zones or key reference points for price action.
In the settings, you can customize the number of lines shown above and below the current price, along with the interval size for rendering them.
As the price moves higher or lower, the lines dynamically adjust to reflect the most relevant levels.
In settings you can fully customize the style of lines (color, width, style) with separate settings available for lines above & below the current price.

LogReg Channel-Trend – Nadaraya (Kernels + CF/ABModification of BigBeluga script named "LogReg Channel- Trend"

BaH4iK_StaategyThis indicator is a flexible strategy builder for TradingView, allowing traders to combine and customize popular entry/exit signals, filters, and overlays into a single tool. The indicator supports a wide range of technical methods and provides modular configuration for advanced strategy design.
How it works:
The user can select from dozens of entry types (trend, breakout, oscillator signals), confirmation filters (EMA, SMA, MA crosses, volatility, custom range filters), overlays, dashboards, and risk settings.
Key logic includes conditional sampling for EMAs and SMAs, multiple range and trend-detection systems (Range Filter, Supertrend, Half Trend, Rational Quadratic Kernel), and integration of classic confirmation indicators (TSI, VWAP, RSI, MACD, CCI, Ichimoku, Donchian, Bollinger Bands, etc.).
Signal expiry features, alternate signals, and dashboard visualization are built-in. Filters can be stacked/combined or toggled via the settings panel.
Features:
Entry/exit signals: LONG/SHORT labels, arrows, dashboard summary
Signal confirmation: EMA/SMA/MA crosses, trend, range, oscillator filters
Custom overlays: supply/demand zones, pivot levels, ranges, fractals, volume bands
Modular configuration: choose methods, combine signals, tune sensitivity and cooldown
Advanced filters: trend alignment, volatility breakout, multiple timeframe signals
Risk management: automate signal expiry, stop-loss, TP projections, risk/reward display
Dashboard panel: flexible position, size, session overlays, instant summary of conditions
UI: All interactive controls and outputs (labels, tooltips, dashboard text) default to English; if other language is used in UI, translation is provided in this description.
How to use:
Add the indicator to your chart, then use the settings panel to select entry type, confirmation logic, overlays, and dash display. Combine filters to custom-build rules. Use labels/arrows and dashboard to monitor entries and manage risk. Designed for manual, semi-automatic and automated strategy development.
Originality:
This tool is not just a mashup of popular methods but provides a true framework for custom strategy creation directly on TradingView, with unique stacking, dynamic dashboard, and advanced filter/expiry management.
