21D EMA STRUCTUREAs an intermediate-term swing trader, the 21-day moving average is the backbone of my system. Over time, I’ve simplified my approach to the point where this is really the only indicator I keep on my charts — aside from a few key lines to help define structure and pivots.
Bantlar ve Kanallar

EMA/SMA Crossover Signals📊 EMA/SMA Crossover Signals
A professional trading indicator that identifies golden and death crosses between a customizable EMA and SMA with clear BUY/SELL labels displayed directly on your chart.
🎯 Key Features:
✅ Customizable Moving Averages - Adjust both EMA and SMA periods to match your trading strategy
✅ Clear Signal Labels - Large, color-coded "BUY" and "SELL" labels that are impossible to miss
✅ Adjustable Label Positioning - Control the vertical distance of signal labels from price action
✅ Professional Color Customization - Change colors for both moving averages and signals to match your theme
✅ Label Size Options - Choose from 4 different sizes (Tiny, Small, Normal, Large)
✅ Audio Alerts - Get notified instantly when crossovers occur
✅ Overlay Display - Signals appear directly on your price chart for better context
📈 How It Works:
🟢 BUY Signal: Triggered when the EMA crosses above the SMA (bullish crossover)
🔴 SELL Signal: Triggered when the EMA crosses below the SMA (bearish crossover)
⚙️ Customizable Settings:
Moving Averages:
- EMA Period (Default: 8)
- SMA Period (Default: 200)
Colors:
- EMA Color
- SMA Color
- Buy Signal Color
- Sell Signal Color
Signal Settings:
- Signal Vertical Offset
- Label Vertical Offset
- Label Size
💡 Best For:
- Day Trading (1-5 min timeframes)
- Swing Trading (4H-Daily)
- Trend Following Strategies
- Identifying momentum shifts
- Confirming market structure changes
🔔 Perfect for traders using ICT, Wyckoff, and institutional trading methodologies
Use this indicator as part of your complete trading system. Always combine with proper risk management and additional confluence factors.

Yesterday High LineYesterdays High Line Green Dotted Line. Just a line at the high point reached in yesterdays trading cycle

Opening Range + Prev/Pre/Post Market Hi/Lo
Tracks each day’s regular-session high/low and their bar_index.
On a new day, stores those as “prev day” values.
Draws the prev-day lines anchored at the actual high/low bars from yesterday, then extends them across today (and beyond).

The Composite Predictive Index-(CPI-IG v5)**The Composite Predictive Index (CPI-IG v5) is a comprehensive Market Institutional Indicator created by Alcides Davila and is an overlay indicator designed for institutional-grade market analysis and trading signals. Nevertheless, Daily-Short-Term Traders may also take advantage of this robust and efficient indicator. Still, they must make the necessary adjustments for scalping and for short-, medium-, and long-term trading. It synthesizes multiple technical factors (e.g., RSI, MACD, Bollinger Bands, VWAP, EMAs/SMAs, volume pressure, delta volume, manual sentiment/news inputs) into a weighted Z-score-based probability model (probUp) for forecasting price direction—generating buy/sell gates, strong/ultra signals, and short-term projections. It supports multi-timeframe alignment (HTF/LTF), breakout/breakdown detection with retests, internal backtesting, and alerts, while displaying dashboards for probabilities, stats, oscillators (bull/bear/neutral), major indexes (S&P, DJIA, Nasdaq), and ETFs (SPY, QQQ, etc.).
In terms of structure, it's highly reliable and productive: modular code with error-handling (safe divisions, approximations for tanh/erf), customizable modes (scalp to long-term), efficient resource use (max_bars_back=500), and cooldowns to prevent alert spam. Quality is strong, with transparent math, visual flexibility, and no apparent logic bugs—though real-world performance depends on market conditions and user tuning.
Investors can benefit significantly by using it for data-driven decisions, reducing bias through probability scores (e.g., >68% for buys), timing entries/exits with cross-confirmations, and monitoring broader market context via indexes/ETFs. It's especially useful for trend-following or reversal strategies, potentially improving win rates in volatile markets, but, like all indicators, it's not foolproof—use it in combination with risk management.
Strongest feature: The probability engine, which normalizes diverse signals into a robust, Z-scaled probUp metric (via the normal CDF or a logistic), enabling a quantifiable edge over traditional oscillators. Cheers...!!!

CRT Inside Hunter + FVG (Final Fusion)CRT Inside Hunter + FVG (Final Fusion)
This indicator automatically detects Inside Bar → CRT (Consolidation – Range – Trap) structures and generates LONG / SHORT BAM breakout signals whenever the mother bar is violated.
It also includes optional Fair Value Gap (FVG) confirmation.
🔍 1. Inside Bar → Mother Bar Detection
Automatically identifies inside bar sequences.
Creates the Mother Bar with High / Low boundaries.
Draws Q1 – Mid – Q3 levels as visual guidance.
Auto-removes CRT structure after a user-defined number of bars.
🚨 2. BAM Breakout Signals
Breakout events trigger automatic trade signals:
Upper violation → SHORT signal
Lower violation → LONG signal
Signals are displayed as labels and fully support alerts.
🟦 3. FVG (Fair Value Gap) Confirmation
Optional FVG detection mode:
Automatically marks Demand and Supply FVG zones.
If the price touches an FVG at the breakout moment, the signal becomes FVG-Confirmed.
🎨 4. Additional Features
Inside bars highlighted for clarity.
Clean, minimal drawing system.
All drawings reset daily for maximum chart hygiene.
This tool combines liquidity, imbalance, breakout logic and provides a powerful structure for scalping and intraday trading.

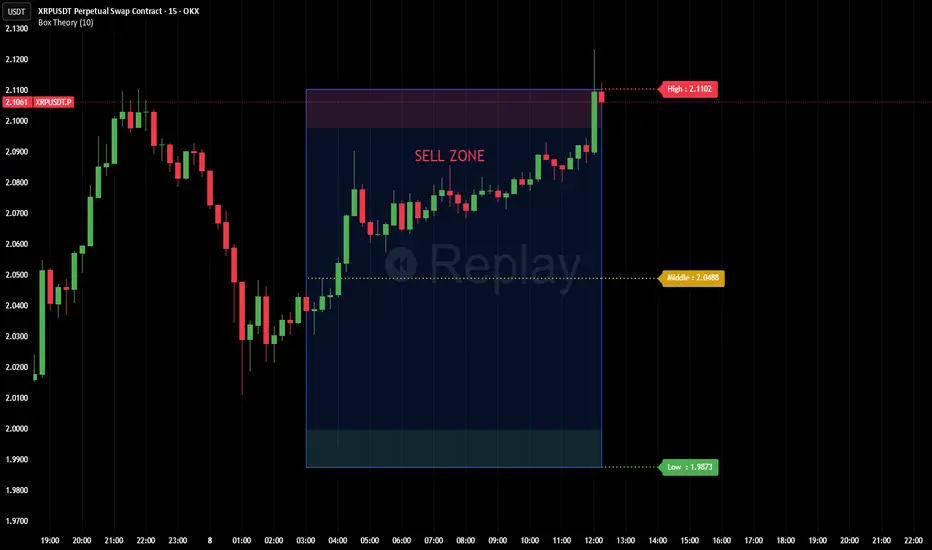
Box TheoryBox Theory – Description
This indicator is based on the popular “Box Theory” concept, where the previous session’s High–Low range acts as the most important structure for the next session.
Traders use this because the market often reacts to the same areas where liquidity, orders, and imbalances were created in the prior session.
At every new session open, the indicator automatically records:
Previous High
Previous Low
Middle (50% level)
These three levels form a box, which becomes your roadmap for the new session.
This method is widely used because it highlights where most reversals, sweeps, and reactions occur—without needing any extra indicators.
How the Zones Are Calculated
Previous High
The highest price of the last session.
This forms the top edge, which acts as resistance and the basis for the Sell Zone.
Previous Low
The lowest price of the last session.
This forms the bottom edge, acting as support and the basis for the Buy Zone.
Middle Line (50% Level)
The exact midpoint between High and Low.
This is the fair-value zone, where price often consolidates and becomes directionless.
No signals are triggered near the middle, because trades taken here historically have low accuracy.
Buy Zone (Green Area)
The lower part of the box.
Price often reacts here because this area held buyers in the previous session.
When price enters this green zone inside the box, the indicator can show a Buy Zone label.
Sell Zone (Red Area)
The upper part of the box.
Price commonly rejects here because this area acted as resistance previously.
When price enters this red zone inside the box, the indicator can show a Sell Zone label.
How Zone Size Is Set (Sensitivity %)
You can adjust how big the Buy/Sell zones are using the Sensitivity (%) input.
Lower % → Smaller zones → More precise signals
Higher % → Larger zones → Signals appear earlier and from farther away
Formula:
Zone Size = (Previous High − Previous Low) × (Sensitivity % ÷ 100)
This lets you customize how tight or how early your signals appear.
Inside-Box Only Logic
The indicator only works inside the previous session’s range.
If price breaks above the previous High → No sell signal
If price breaks below the previous Low → No buy signal
This avoids false signals during breakouts or trending markets.
Alerts
The indicator includes two alerts:
Buy Zone Alert → Triggers when price enters the Buy Zone
Sell Zone Alert → Triggers when price enters the Sell Zone
Just enable them in TradingView’s alert panel.
Bollinger Bands SMThis script plots four custom Bollinger Band envelopes on price to map volatility, trend and extremes on a single chart.
What it shows
BB Set 1 – 50-length, 1.25σ (cyan/red)
Short–to–medium-term volatility channel. Good for spotting squeezes, early breakouts and pullbacks in the active trend.
BB Set 2 – 200-length, 1.25σ (lime/yellow)
Higher-timeframe “trend envelope”. When price rides the upper band the trend is strong; closes below the lower band often signal deeper corrections.
BB Set 3 – 14-length, 3.2σ (white/blue, green fill)
Fast, very wide band for short-term volatility spikes. Tags of these outer bands highlight overextended moves that often mean-revert.
BB Set 4 – 200-length, 5σ (white/red, purple fill)
Extreme long-term volatility boundary. Price reaching this zone is rare and can mark exhaustion, blow-off moves or panic washes.
How I use it
Look for squeezes where bands contract tightly before large moves.
Watch for confluence when multiple bands line up as support/resistance.
Treat outer band touches as risk zones, not automatic reversal signals – wait for confirmation from structure or your own system.
This is a visual tool to understand volatility and trend context, not a standalone buy/sell system and not financial advice.

The Composite Predictive Index-(CPI-IG v5)*The Composite Predictive Index (CPI-IG v5) is the creation of Alcides Davila (Alcides0265), Daily Trader. This indicator, which I call "The Predictor Index" and is also known as "The Composite Predictive Index (CPI-IG v5)", is an overlay indicator designed for institutional-grade market analysis and trading signals. Daily traders could also take advantage of this indicator by making the necessary adjustments for each trading session, whether for short-term (scalping), medium-term, or long-term investments. It synthesizes multiple technical factors (e.g., RSI, MACD, Bollinger Bands, VWAP, EMAs/SMAs, volume pressure, delta volume, manual sentiment/news inputs) into a weighted Z-score-based probability model (probUp) for forecasting price direction—generating buy/sell gates, strong/ultra signals, and short-term projections. It supports multi-timeframe alignment (HTF/LTF), breakout/breakdown detection with retests, internal backtesting, and alerts, while displaying dashboards for probabilities, stats, oscillators (bull/bear/neutral), major indexes (S&P, DJIA, Nasdaq), and ETFs (SPY, QQQ, etc.).
In terms of structure, it's highly reliable and productive: modular code with error-handling (safe divisions, approximations for tanh/erf), customizable modes (scalp to long-term), efficient resource use (max_bars_back=500), and cooldowns to prevent alert spam. Quality is strong, with transparent math, visual flexibility, and no apparent logic bugs—though real-world performance depends on market conditions and user tuning.
Investors can benefit significantly by using it for data-driven decisions, reducing bias through probability scores (e.g., >68% for buys), timing entries/exits with cross-confirmations, and monitoring broader market context via indexes/ETFs. It's especially useful for trend-following or reversal strategies, potentially improving win rates in volatile markets, but, like all indicators, it's not foolproof—use it in combination with risk management.
Strongest feature: The probability engine, which normalizes diverse signals into a robust, Z-scaled probUp metric (via the normal CDF or a logistic), enabling a quantifiable edge over traditional oscillators.

The Composite Predictive Index (CPI-IG v5)The Composite Predictive Index (CPI-IG v5) is the creation of Alcides Davila (Alcides0265), Daily Trader. This indicator, which I call "The Predictor Index" and is also known as "The Composite Predictive Index (CPI-IG v5)", is an overlay indicator designed for institutional-grade market analysis and trading signals. Daily traders could also take advantage of this indicator by making the necessary adjustments for the trading sessions, whether for short (scalping), medium, or long-term investments. It synthesizes multiple technical factors (e.g., RSI, MACD, Bollinger Bands, VWAP, EMAs/SMAs, volume pressure, delta volume, manual sentiment/news inputs) into a weighted Z-score-based probability model (probUp) for forecasting price direction—generating buy/sell gates, strong/ultra signals, and short-term projections. It supports multi-timeframe alignment (HTF/LTF), breakout/breakdown detection with retests, internal backtesting, and alerts, while displaying dashboards for probabilities, stats, oscillators (bull/bear/neutral), major indexes (S&P, DJIA, Nasdaq), and ETFs (SPY, QQQ, etc.).
In terms of structure, it's highly reliable and productive: modular code with error-handling (safe divisions, approximations for tanh/erf), customizable modes (scalp to long-term), efficient resource use (max_bars_back=500), and cooldowns to prevent alert spam. Quality is strong, with transparent math, visual flexibility, and no apparent logic bugs—though real-world performance depends on market conditions and user tuning.
Investors can benefit significantly by using it for data-driven decisions, reducing bias through probability scores (e.g., >68% for buys), timing entries/exits with cross-confirmations, and monitoring broader market context via indexes/ETFs. It's especially useful for trend-following or reversal strategies, potentially improving win rates in volatile markets, but, like all indicators, it's not foolproof—use it in combination with risk management.
Strongest feature: The probability engine, which normalizes diverse signals into a robust, Z-scaled probUp metric (via the normal CDF or a logistic), enabling a quantifiable edge over traditional oscillators.

Daily Range Box (RIC) V0.2This update enhances the "Daily Range Box" indicator by adding user-configurable inputs for colors and line styles. Users can now customize the box border color and the midline color independently through dedicated color picker inputs. Additionally, separate dropdown menus allow selection of line styles (Solid, Dashed, or Dotted) for both the box border and the midline, enabling personalized visualization while maintaining the core functionality of drawing daily range boxes with midlines across all timeframes.

Indicator ***TuYa*** V8.2 – HH/HL MTF + Peak Mid ZoneIndicator TuYa V8.0 – HH/HL MTF + Peak Mid Zone
TuYa V8.0 combines multi-timeframe market structure with a Peak Reaction midline to create clean, rule-based reversal and trend entries – designed primarily for 1-minute execution with 1-hour bias.
🧠 Core Concept
This indicator fuses three ideas:
HTF Peak Reaction Midline (1H)
Uses a Peak Reaction style logic on the higher timeframe (HTF, default: 1H).
Identifies a reaction high and reaction low, then calculates their midpoint → the Peak Mid Zone.
This midline acts as a dynamic sentiment divider (above = premium / below = discount).
Multi-Timeframe HH/HL/LH/LL Structure
HTF structure (1H): detects HH, HL, LH, LL using pivot highs/lows.
LTF structure (1m): detects HH, HL, LH, LL on the execution timeframe (chart TF, intended for 1m).
HTF → LTF Confirmation Window
After a 1H structure event (HH, HL, LL, LH), the indicator opens a confirmation window of up to N LTF candles (default: 10 x 1m bars).
Within that window, the required 1m structure event must occur to confirm an entry.
🎯 Signal Logic
All entries are generated on the LTF (e.g. 1m chart), using HTF (e.g. 1H) bias + Peak Mid Zone:
1️⃣ Price ABOVE Peak Mid (Bullish premium zone)
Reversal SELL
HTF: HH (Higher High)
Within N 1m bars: LTF HH
→ SELL signal (fading HTF strength near premium)
Trend/Bullish BUY
HTF: HL (Higher Low)
Within N 1m bars: LTF LL
→ BUY signal (buying dips in an uptrend above midline)
2️⃣ Price BELOW Peak Mid (Bearish discount zone)
Reversal BUY
HTF: LL (Lower Low)
Within N 1m bars: LTF LL
→ BUY signal (catching potential reversal from discount)
Trend/Bearish SELL
HTF: LH (Lower High)
Within N 1m bars: LTF HH
→ SELL signal (shorting strength in a downtrend below midline)
Signals are plotted as small BUY/SELL triangles on the chart and exposed via alert conditions.
🧾 Filters & Options
⏳ HTF → LTF Delay Window
Input: “Max 1m bars after HTF trigger” (default: 10)
After a 1H HH/HL/LL/LH event, the indicator waits up to N LTF candles for the matching 1m structure pattern.
If no match occurs within the window, no signal is generated.
📉 RSI No-Trade Zone (HTF)
Toggle: Use RSI no-trade zone
Inputs:
RSI Length (HTF)
No-trade lower bound (default 45)
No-trade upper bound (default 65)
If HTF RSI is inside the defined band (e.g. 45–65), signals are blocked (no-trade regime), helping to avoid noisy mid-range conditions.
You can turn this filter ON/OFF and adjust the band dynamically.
🧱 5m OB / Direction Filter (Optional)
Toggle: Use 5m OB direction filter
Timeframe: Configurable (default: 5m).
Uses a simple directional proxy on the OB timeframe:
For BUY signals → require a bullish candle on OB timeframe.
For SELL signals → require a bearish candle on OB timeframe.
When enabled, this adds an extra layer of confluence by aligning entries with the short-term directional context.
⚙️ Key Inputs (Summary)
Timeframes
HTF (Peak Reaction & Structure): default 60 (1H)
Peak Reaction
Lookback bars (HTF)
ATR multiplier for zones
Show/Hide Peak Mid line
Structure
Pivot left/right bars (for HH/HL/LH/LL swings)
Toggle structure labels (HTF & LTF)
Confirmation
Max LTF bars after HTF trigger (default 10, fully configurable)
RSI Filter
Use filter (on/off)
RSI length
No-trade range (low/high)
5m OB Filter
Use filter (on/off)
OB timeframe (default 5m)
📡 Alerts & Automation
The script includes alertconditions for both BUY and SELL signals, with JSON-formatted alert messages suitable for routing to external bridges (e.g. bots, MT5/MT4, n8n, etc.).
Each alert includes:
Symbol
Side (BUY / SELL)
Price / Entry
SL & TP placeholders (from hidden plots, ready to be wired to your own logic)
Time
Performance tag
CommentCode (for strategy/type tagging on the receiver side)
You can attach these alerts to a webhook and let your execution engine handle SL/TP and order management.
📌 How to Use
Attach the indicator to a 1-minute chart.
Set HTF timeframe to 60 (or your preferred higher timeframe).
Optionally enable:
RSI regime filter
5m OB direction filter
Watch for:
Price relative to the Peak Mid line
BUY/SELL triangles that respect HTF structure + LTF confirmation + filters.
For automation, create alerts using the built-in conditions and your preferred JSON alert template.
⚠️ Disclaimer
This tool is for educational and informational purposes only.
It is not financial advice and does not guarantee profits. Always test thoroughly in replay / paper trading before using with live funds, and trade at your own risk.

VIX + Weekly ATR Hybrid RangeVIX + Weekly ATR Hybrid Range VIX + Weekly ATR Hybrid Range VIX + Weekly ATR Hybrid Range

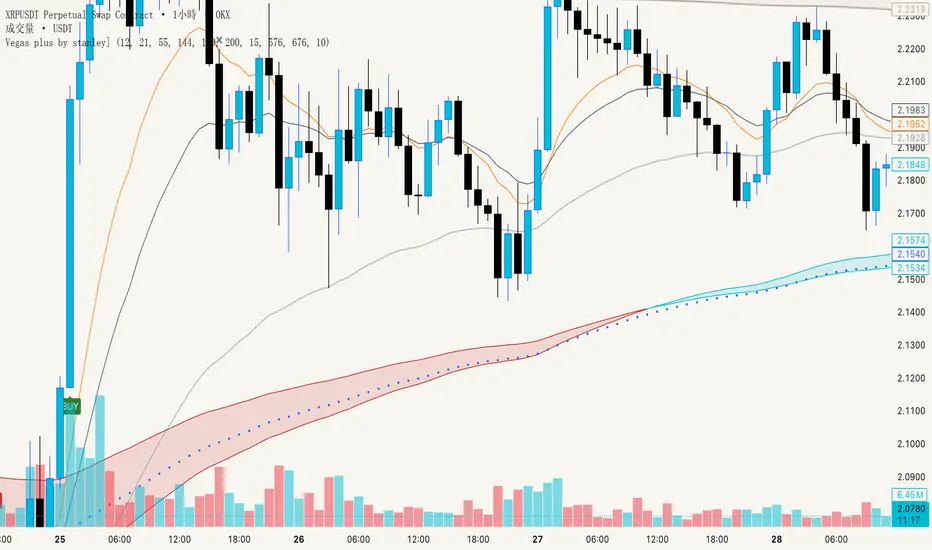
Vegas plus by stanleyThis Pine Script implements a comprehensive trend-following strategy known popularly as the **Vegas Tunnel Method**. It combines multiple Exponential Moving Averages (EMAs) to define trends, pullbacks, and breakouts.
Here is a step-by-step walkthrough of how the code works, broken down by its components and logic.
---
### 1. The Anatomy (The Indicators)
The script uses three distinct groups of Moving Averages to define the market structure.
#### A. The Fast EMAs (The Trigger & Exit)
* **EMA 12 (Signal):** The fastest line. It is used to trigger entries (crossing the tunnel).
* **EMA 21 (Exit):** Used as a trailing stop. If the price crosses this line against your trade, the script signals an exit.
* **EMA 55 (Filter):** A medium-term filter, often used visually to gauge trend health.
#### B. The "Hero" Tunnel (The Action Zone)
* **EMAs 144 & 169 & 200:** These creates the main "Tunnel."
* **Function:** This acts as dynamic Support and Resistance.
* **Bullish:** If the 144 (Top) is above the 200 (Bottom), the tunnel is painted Blue.
* **Bearish:** If the 144 is below the 200, it is painted Red.
#### C. The "Anchor" Tunnel (The Deep Trend)
* **EMAs 576 & 676:** This creates a massive, slow-moving background tunnel.
* **Function:** It tells you the long-term trend. Generally, you only want to take Buy signals if price is above this Anchor, though the script logic focuses primarily on the Hero tunnel for triggers.
---
### 2. State Memory (`var` Variables)
This is a sophisticated part of the script. It uses `var` variables to "remember" where the price was in the past.
* `originPrice`: Remembers if the price was last seen **Above** (1) or **Below** (-1) the tunnel.
* `originEMA`: Remembers if the EMA 12 was last seen **Above** (1) or **Below** (-1) the tunnel.
**Why is this needed?**
To distinguish between a **Breakout** (crossing from Bear to Bull) and a **Pullback** (already Bull, dipped into tunnel, and coming back out).
---
### 3. The Four Entry Triggers
The script looks for four specific scenarios to generate a Buy or Sell signal. You can turn these on/off in the settings.
#### Trigger 1: Price U-Turn (Trend Continuation)
* **Logic:** The Price was *already* above the tunnel (`originPrice == 1`), dipped down, and is now crossing back up (`crossover`).
* **Meaning:** This is a classic "Buy the Dip" signal within an existing trend.
#### Trigger 2: EMA U-Turn (Lagging Confirmation)
* **Logic:** Similar to Trigger 1, but uses the **EMA 12** line instead of the Price candle.
* **Meaning:** This is safer but slower. It waits for the average price to curl back out of the tunnel.
#### Trigger 3: Breakthrough (Momentum Shift)
* **Logic:** The EMA 12 was previously *below* the tunnel (`originEMA == -1`) and has just crossed *above* it (`crossover`).
* **Meaning:** This is a Trend Reversal signal. The market has shifted from Bearish to Bullish.
#### Trigger 4: Wick Rejection (Touch & Go)
* **Logic:**
1. Price is generally above the tunnel.
2. The `Low` of the current candle touches the tunnel.
3. The `Low` of the *previous* candle did NOT touch the tunnel.
4. The candle closes *outside* (above) the tunnel.
* **Meaning:** The price tested the support zone and was immediately rejected (bounced off), leaving a wick.
---
### 4. Trade Management (State Machine)
The script uses a variable called `tradeState` to manage signals so they don't spam your chart.
* `tradeState = 0`: Flat (No position).
* `tradeState = 1`: Long.
* `tradeState = -1`: Short.
**The Rules:**
1. **Entry:** If `validLong` is triggered AND `tradeState` is not already 1 -> Change state to 1 (Long) and plot a **BUY** label.
2. **Holding:** If you are already in State 1, the script ignores new Buy signals.
3. **Exit:** If `tradeState` is 1 AND price closes below EMA 21 -> Change state to 0 (Flat) and plot an **Exit L** label.
---
### 5. Visual Summary
* **Green Label:** Buy Signal (Long Entry).
* **Red Label:** Sell Signal (Short Entry).
* **Grey X:** Exit Signal (Close the position).
* **Blue/Red Tunnel:** The "Hero" tunnel (144/169/200).
* **Grey Background Tunnel:** The "Anchor" tunnel (576/676).
### How to read the signals:
You are looking for the price to interact with the **Hero Tunnel** (the thinner, brighter one).
1. **Trend:** Look at the slope of the Anchor (thick grey) tunnel.
2. **Setup:** Wait for price to come back to the Hero Tunnel.
3. **Trigger:** Wait for a **Green Label**. This means the price dipped into the tunnel and is now blasting out (U-Turn), or has rejected the tunnel (Wick), or has broken through a new trend (Breakthrough).
4. **Exit:** Close the trade when the **Grey X** appears (Price crosses the EMA 21).

VIX + Weekly ATR Hybrid RangeVIX + Weekly ATR Hybrid Range best used for complete range with accuracy

Auto Line📌 **《Auto Line》 Overview
Auto Line is a multi-level analytical engine that automatically generates structural price levels based on a variety of frameworks such as:
Moving averages
Upper / Lower band logic
Previous High / Previous Low
Swing pivot highs and lows
Fibonacci Pivot levels
Multi-timeframe (HTF) inputs
Each level is evaluated using a Break Count grading system, which measures how frequently price has crossed the level.
This grading does not produce buy or sell signals—it simply visualizes how often the market has interacted with that price area.
Auto Line is a market structure reference tool, not a prediction or signal generator.
✨ Key Features
1) Nine Independent Level Engines (SET 1–9)
Each of the nine SETs can independently generate levels using one of the following methods:
SMA
Upper band
Lower band
Previous High / Previous Low
Swing Points
Fibonacci Pivot Levels
NONE (disabled)
Each SET has its own:
Length
Multiplier
HTF timeframe
This allows full customization of the level-generation logic.
2) Built-in Multi-Timeframe (HTF) Support
Every SET can request data from any higher timeframe via request.security().
Example usage:
SET1 → Daily
SET3 → Weekly
SET9 → Weekly Fibonacci
Thus, the user can visualize multiple timeframe structures on a single chart.
3) Break-Count Level Strength System
Auto Line evaluates the “strength” of each level using a break-count formula:
breaks = Number of times price crosses above/below the level
grade = 0–100 scale based on breaks
More breaks → higher grade → lower opacity (more faded)
This gives a visual sense of how frequently the market has interacted with a level.
It is not a probability measure and does not imply trade direction or outcome.
4) Swing-Based Structural Levels
The indicator detects swing highs and lows using left/right parameters and converts them into structural levels.
Includes:
Automatic swing labeling
Break-count evaluation
Optional display of all swing points (showPP)
5) Automatic Fibonacci Pivot Levels
When the Fibonacci option is selected:
P
R1 to R5
S1 to S5
are generated automatically and evaluated just like any other level.
6) Selective Output (A–E Pick Slots)
The user can selectively display specific SET outputs using pick slots:
Pick A → choose SET #1 to SET #9
Pick B → choose another SET
… up to five independent visible selections
Each pick can display either:
a single line level
or a full 11-level Fibonacci set (when applicable)
📌 Explanation of User Inputs
Swing Settings
Left / Right: Controls pivot swing sensitivity
Show PP: Option to show all swing labels on chart
SET Parameters (1 to 9)
Each SET contains:
Parameter Description
Method SMA / Upper / Lower / Prev High / Prev Low / Swings / Fibonacci
Length Used for SMA/Band logic
Multiplier Used for Upper/Lower band expansion
HTF Timeframe used for data calculation
Each SET behaves independently.
Display Options (Picks A–E)
Each pick allows selecting one SET to display.
Example:
Pick A = SET3
Pick B = SET5
Fibonacci levels generate up to 11 plots;
other methods produce a single structural line.
📌 How Level Strength Is Calculated (Technical Description)
Auto Line tracks how often price alternates above and below a level:
Determine whether price begins above or below the level
Count each time price crosses it
Convert break count into a grade:
grade = min(100, round((100 / fade) * breaks))
The grade affects opacity only, giving a visual representation of interaction frequency.
This grading does not represent trade probability or outcome.
📌 Repainting Behavior
Auto Line:
Uses confirmed historical bars
Uses security() for HTF data
Does not modify past values once bars are confirmed
Therefore, the indicator does not repaint.
However, structural levels such as:
Swings
Pivot Levels
HTF lines
will naturally update when new bars close, which is expected behavior for this style of indicator.
📌 Purpose of the Indicator
Auto Line is designed for:
Identifying structural price regions
Observing where the market most frequently interacts
Comparing levels across multiple frameworks
Creating a comprehensive multi-timeframe level map
It does not:
❌ predict future price
❌ provide buy/sell signals
❌ guarantee profitable outcomes
It is a supporting tool for market structure analysis.
📌 Notes & Considerations
Swings and pivot levels depend on chart range and may change as new bars appear
Too many SETs may clutter the chart—use pick slots to selectively display
Break-count is purely informational, not directional

AJ Price Action Trading SetupThe AJ Price action trading setup Involves :
1. Buy / Sell Signals Based On Previous Price Action
2. BOS/ COCH Showing Trend Reversals
3. Market Momentum Based On Price Action
Disclaimer :
Never Take trades based on Indicator only, make your own analysis and trade accordingly.
Price Action is not every body cup of cake, we are trading against smart and educated institutions its not easy to steal money from them.There is nothing in this world which helps in guaranteed returns,no indicator have done yet neither this one do.Try to Control your emotions and do not over trade.This is my updated version of my previous indicator Previous Candle Breakout Startegy.Follow and Comment for any clarifications.

RSI++ Smoothed + Divergence Lines by Indicatorhouse🚀 Introducing RSI++ Smoothed + Divergence Lines: Your Advanced Momentum Edge! 🚀
Hey,
I'm thrilled to share an indicator we've poured a lot of effort into, designed to give you a significant edge in understanding market momentum and anticipating reversals: RSI++ Smoothed + Divergence Lines.
This isn't just another RSI; it's a comprehensive momentum powerhouse built to provide cleaner signals, dynamic context, and crucial foresight that standard indicators often miss. If you're looking to reduce noise, spot high-probability reversals, and align with the broader market trend, this indicator is for you.
Why RSI++ is Different & What You Get:
Crystal-Clear Momentum with Advanced Smoothing Forget the jittery, noisy lines of a basic RSI. My indicator features a double-layered smoothing engine (EMA/SMA options + an additional EMA) to deliver a super-clean momentum line. This means you can spot actual shifts in market strength, not just minor wiggles.
Benefit: Reduces false signals, giving you more reliable entry and exit points.
Dynamic Overbought/Oversold Bands Static 70/30 levels are good, but dynamic levels are better! RSI++ integrates Bollinger Bands directly onto the RSI line itself. This means the overbought and oversold thresholds adapt to the current volatility of the momentum, giving you a more intelligent read on extreme conditions.
Benefit: Context-aware signals that truly reflect when momentum is stretched, regardless of market conditions.
Precision 'B'uy & 'S'ell Reversal Signals When the smoothed RSI changes direction from an extreme (overbought or oversold) zone, the indicator plots clear 'B' (Buy) or 'S' (Sell) labels. These are filtered signals designed to highlight high-probability reversals from significant momentum exhaustion.
Benefit: Pinpoint powerful turning points with easy-to-read visual cues directly on the indicator panel.
Automated Divergence Detection (Regular & Hidden!) One of the most powerful leading indicators is now automated for you! RSI++ automatically identifies and plots both Regular (trend reversal) and Hidden (trend continuation) Bullish and Bearish divergences between price and the smoothed RSI.
Benefit: No more squinting to find divergences. Clear lines and labels appear, giving you an early warning of potential shifts or continuations.
Multi-Timeframe (MTF) Confluence Dashboard Never trade against the higher timeframe trend again! A customizable dashboard discreetly shows you the momentum direction (RSI slope) across five different timeframes. It even calculates a confluence score!
Benefit: Gain instant perspective on the market's overall bias, helping you confirm trades and avoid low-probability setups.
Built-In Professional Alerts
Stay on top of the market without being glued to your screen. RSI++ comes with a comprehensive suite of alerts:
RSI Color Change (Slope): Get notified when momentum direction shifts.
Sell/Buy Signal (Extreme Reversal): Alerts for those high-conviction 'B' and 'S' signals.
Multi-Timeframe Confluence: Be alerted when 3 or more timeframes align, or when your first 3 timeframes are fully aligned.
Ready to Elevate Your Trading?
The RSI++ Smoothed + Divergence Lines indicator is available for purchase now! Experience a cleaner, smarter way to trade momentum.
🔑 Request Access: RSI++ (7-Day Trial)
We offer a 7-day free trial of the RSI++ Smoothed + Divergence Lines indicator!
To get access:
Follow My Profile.
Send a Private Message with your TradingView Username (ID).
We will grant access promptly!
Feel free to drop any questions below. Happy trading!
#RSI #MomentumTrading #Divergence #TradingView #CustomIndicator #TechnicalAnalysis #PineScript #PremiumIndicator

RSI Volume Order BlocksOverview
This script builds structured order blocks using a combination of RSI pivots, price structure, and optional volume/ATR-based scaling.
It is designed to create a clean, explainable map of support/resistance levels that respond only to meaningful momentum shifts rather than small, insignificant oscillations.
Core Idea
Traditional order blocks rely solely on price highs/lows, which often produces excessive or noisy zones.
This model instead:
Detects pivot highs/lows on the RSI (controlled by RSI Length and Sensitivity).
Generates bearish order blocks from RSI pivot highs and bullish order blocks from RSI pivot lows.
Allows the user to choose whether blocks are based on candle bodies or the full candle range.
Optionally filters blocks so that:
bearish OBs form only when RSI is above an overbought threshold,
bullish OBs form only when RSI is below an oversold threshold.
The resulting zones represent areas of momentum exhaustion and imbalance rather than random price fluctuations.
Volume–ATR Height Mode
The script offers two approaches for block height:
1. Price Candle Mode
Block height equals either:
the candle body, or
the full high–low range of the pivot bar.
2. Volume–ATR Mode
Block height is adaptively scaled using:
ATR (ATR Length for Height),
relative volume compared to a baseline (Volume Baseline Length),
a global height multiplier.
This makes zones thicker when the pivot candle had both higher volatility and above-average volume, and thinner when market participation was lower.
Lifespan and Mitigation
Each block extends forward in time until price mitigates it.
Mitigation Method: Close
Bearish OB is removed when a candle closes above its top.
Bullish OB is removed when a candle closes below its bottom.
Mitigation Method: Wick
Bearish OB is removed when a wick breaks above the top.
Bullish OB is removed when a wick breaks below the bottom.
Additional controls:
Maximum number of stored OBs per side.
Maximum number of displayed OBs per side.
Overlap filtering to avoid redundant zone stacking.
Main Inputs (Summary)
RSI Length – standard RSI lookback.
RSI OB Sensitivity – pivot aggressiveness (higher = fewer, stronger pivots).
Overbought/Oversold Levels – thresholds for optional filters.
RSI Filter –
bearish OB only if RSI > overbought,
bullish OB only if RSI < oversold.
Order Block Style – candle body or full range.
Mitigation Method – close-based or wick-based.
OB Height Mode – price candle or volume–ATR scaling.
Volume Baseline Length, ATR Length for Height, Height Scale – parameters for adaptive height mode.
Show Bullish / Bearish OBs – toggles for each side.
Color settings for zone visualization.
How to Use
Typical workflows include:
Using higher-timeframe OB zones as structural support/resistance, then refining entries on lower timeframes.
Watching for price reactions inside thick Volume–ATR zones, which may indicate areas of strong participation.
Combining this tool with trend filters, volume metrics, or price action confirmation (e.g., rejection wicks or engulfing patterns).
This script does not generate automated entries/exits; it is a contextual mapping tool designed to highlight where meaningful imbalance likely originated and where reactions may occur.
Notes
Works on any symbol and timeframe available on TradingView.
Most effective when combined with disciplined risk management and a defined trading plan.
Provided for research, chart analysis, and backtesting.
Disclaimer
This tool is for educational and informational purposes only.
It does not constitute financial advice or a recommendation to buy or sell any asset.
Always perform your own analysis and manage risk appropriately.

Vegas Pro_邀請版Vegas Pro
Access Requirements To access this script, please follow these steps:
Register on MEXC using the link below.
Deposit at least 200 USDT.
Provide your email address to receive access.
Sign up link: www.mexc.com

Weekly & Monthly Thresholds + VIX-Based Dynamic Targets copyWeekly & Monthly Thresholds + Targets copy backup in case of issue with the previous " Weekly & Monthly Thresholds + VIX-Based Dynamic Targets "

SMC Pro: Real-Time Final**Description:**
This comprehensive SMC indicator is designed to automatically visualize major **Trading Sessions** and **Killzones**, alongside Fair Value Gaps (FVG). It helps traders identify high-probability setups by correlating time and price, specifically during key market hours (London, New York, Asia).
**Key Features:**
1. **Trading Sessions & Killzones:** The indicator clearly highlights the open and duration of major sessions (Asia, London, New York), allowing traders to spot volatility injections and "Judas Swings."
2. **Automated FVG Detection:** Scans price action to locate valid Fair Value Gaps and Imbalances within these sessions.
3. **Entry Logic:** Marks potential entry zones at the 50% retracement level of the identified FVG.
4. **Risk Management:** Projects a fixed Risk-to-Reward ratio (e.g., 1:3) with automatic Stop Loss and Take Profit levels.
5. **Clean Visualization:** Color-coded boxes for sessions and gaps keep the chart organized.
**How to Use:**
* **Time Analysis:** Watch for price action as the London or NY session opens (highlighted by the indicator).
* **Signal:** Wait for an Imbalance/FVG to form during these high-volume times.
* **Entry:** Set a limit order at the 50% mark of the gap.
* **Exit:** Use the projected TP levels.
**Disclaimer:**
This tool is for educational purposes and technical analysis assistance only. Past performance does not guarantee future results.
