Current and Average Volume Table [CHE]Introduction:
The "Current and Average Volume Table " script is designed as a custom indicator for trading platforms that support Pine Script (specifically Pine Script version 5). This indicator provides a compact and informative table summarizing key volume-related metrics for financial instruments, enhancing traders' ability to analyze buying and selling dynamics over a specified period.
Description:
The script calculates and displays essential volume metrics in a customizable table format. It includes options for positioning the table on the chart (e.g., top-right, bottom-left) and adjusting its visual size (auto, huge, large, normal, small, tiny) to fit user preferences and chart layout.
Analysis:
The indicator computes several critical metrics:
Current Volume Metrics:
Current Volume: Displays the total volume traded in the current bar.
Buy Percentage (%): Indicates the proportion of the total volume attributed to buying activities.
Sell Percentage (%): Shows the percentage of the total volume attributed to selling activities.
Average Volume Metrics:
Average Volume: Calculates the simple moving average (SMA) of the volume over a specified number of bars. This provides a smoothed average volume figure, helping traders identify trends or anomalies in trading activity.
Average Buy Percentage (%): Computes the average percentage of buying volume over the SMA period.
Average Sell Percentage (%): Calculates the complementary percentage of selling volume over the SMA period.
The script uses conditional formatting to highlight cells based on comparative values of buy versus sell percentages and their averages. Green shades indicate higher buying activity, while red shades signify higher selling activity, providing a quick visual cue to traders.
Resume:
The "Current and Average Volume Table " script offers traders a concise and insightful tool to monitor and analyze volume dynamics. By displaying current and average volume metrics alongside buy and sell percentages, traders can quickly gauge market sentiment and potential trends. The customizable table placement and size options enhance usability, adapting to individual trading styles and chart preferences.
This script is ideal for traders seeking to incorporate volume analysis into their technical analysis toolkit, providing both real-time insights and historical trend comparisons to inform trading decisions effectively.
This description outlines the functionality, benefits, and practical applications of the script, catering to traders interested in volume-based analysis within the cryptocurrency and traditional financial markets.
Volumedelta

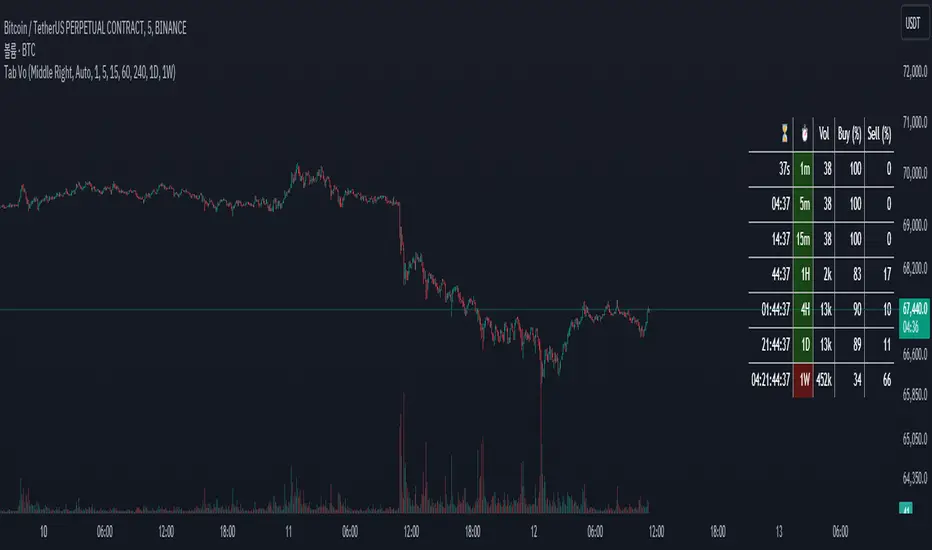
Table Volume MultiframeDescription
The Table Volume Multiframe indicator displays volume information across multiple timeframes in a convenient table format. Users can customize the table's position, size, and the specific timeframes to be displayed. This indicator helps traders analyze volume trends and divergences across different timeframes, providing a comprehensive view of market activity. The table shows the total volume, buy percentage, sell percentage, and a countdown timer for the next bar close for each selected timeframe. The countdown function updates consistently to provide real-time information.
Features
- Customizable table position and size
- Selectable timeframes
- Displays volume, buy percentage, sell percentage
- Countdown timer for next bar close
- Real-time updates
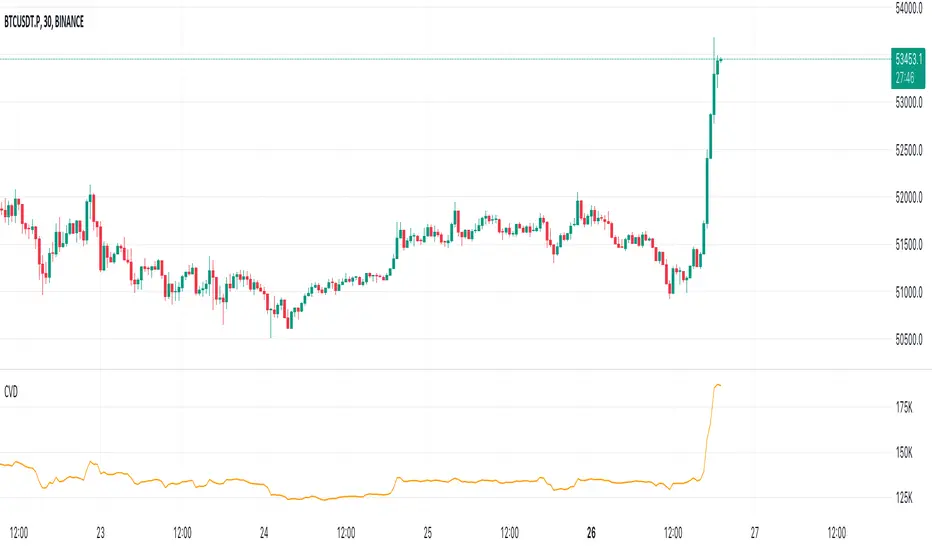
Cumulative Volume Delta LineThis script is a refined version of TradingView's Cumulative Volume Delta (CVD) indicator. It features a CVD line for lower time frames and automatically switches to a Simple Moving Average (SMA) line on daily time frames and higher. This functionality makes it easier to spot Volume Delta divergences on daily charts while maintaining utility on intraday time frames.
Key Features:
Line Chart and Oscillator Configuration: Unlike TradingView's standard CVD, this script can be configured as a line chart or an oscillator, enhancing flexibility and usability.
Line chart for easier divergence spotting: The line chart format is preferred for spotting divergences, providing a clearer visual representation compared to other formats.
Accurate Calculations: Many older community CVD scripts use approximate calculations that can be inaccurate. This script leverages TradingView's own calculations, which are the most accurate available without tick data feeds.
Intraday and Daily Adaptation: The Traditional CVD script is a per bar volume delta on Daily and higher timeframes and cumulative volume delta for intraday session timeframes which makes it very hard to spot divergences on higher timeframes. This script resolves that by using an SMA on daily time frames and higher.
Auto-Switching Feature: The script intelligently switches between the CVD line and the SMA line based on the active time frame. This feature can be toggled off if you prefer to use the CVD on all time frames or the SMA on all time frames.
Customizable Settings: Building on TradingView's CVD script, this version includes all the same settings in addition to the new auto-switch, SMA length etc.
About Volume Delta and Cumulative Volume Delta:
Volume Delta is the difference between the buying and selling volume within a specified period. It helps traders understand the net buying or selling pressure in the market. A positive volume delta indicates more buying activity, while a negative volume delta indicates more selling activity.
Cumulative Volume Delta (CVD) aggregates the volume delta over time to provide a running total. This cumulative approach helps traders see the overall buying and selling pressure trends, making it easier to identify potential reversals or continuations in the market trend.

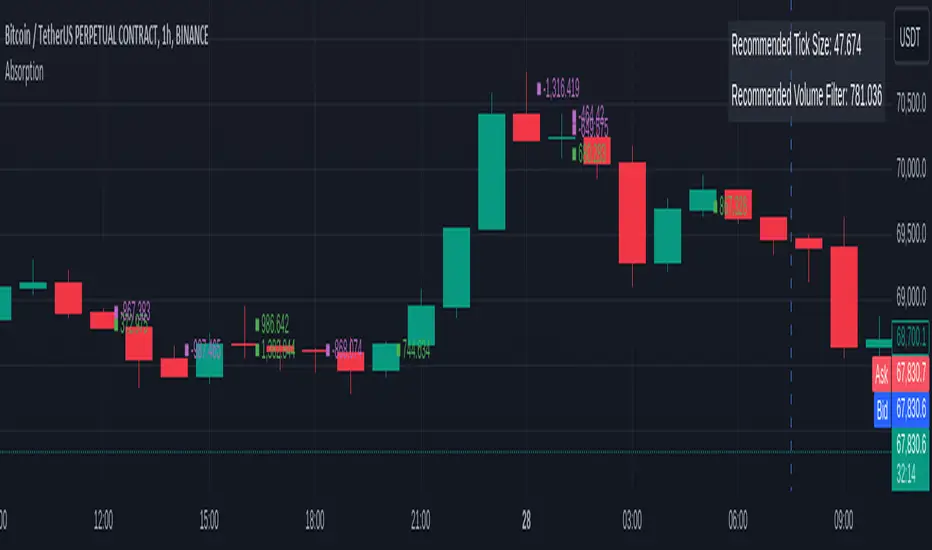
OrderFlow Absorption IndicatorWhat it Does
The OrderFlow Absorption Indicator marks areas where the price absorbs a large volume of aggressive market trades. This indicates areas where price may bounce back due to large limit (resting) orders absorbing significant aggressor volume (market orders). Absorption can also be seen as "preventing" or "stopping" the other side from breaking through a price level (e.g. bids stopping an influx of sell market orders). Absorption may signal a change in sentiment, potentially leading to a pullback or reversal.
An Example of Absorption
Of course, it is not always the case that such bullish absorption will initiate a trend as the example above. The OrderFlow Absorption Indicator merely serves as a tool for spotting possible absorption points in the market which you can incorporate into your trading arsenal.
How it Works
The indicator actively monitors price changes and records volume accumulated at a price level. If the price bounces back to at least where it was before the current price move, the indicator records this as absorption, provided it meets the Volume Requirement and optional Time Requirement.
How to Use it
1. Set Parameters
Choose your desired tick size and volume filter value. If unsure, refer to the table on the top right of the chart for recommended values. An automatic volume limit filter mode is also available.
Automatic Limit Mode : Enable this mode to have the indicator automatically select a volume filter value. It calculates the standard deviation of the last n minutes of volume and multiplies it by a volume multiplier. You can adjust these parameters.
Higher Volume Filter : Setting a higher volume filter value results in fewer, but higher quality detections, reducing noise.
2. Enabling the Time Limit
Enabling the time limit further improves detection quality by filtering out price levels that can defend against quick, sudden aggressive orders, acting as confirmation and indicating strong sentiment and resilient liquidity.
3. Enabling Historical Data Absorption
The indicator can also detect absorption in historical data, though less accurately than in real-time due to OHLCV aggregation.
You can select the granularity of historical data.
Lower granularity (e.g., 1 second) : Provides more accurate detections but may slow down the indicator.
Higher granularity : Improves speed but reduces detection accuracy.
Other Features
Hovering : When hovering over an absorption point, the interface reveals the price where the absorption occurred, along with the volume absorbed by the bids and asks, as well as the volume filter value used.
Delta Mode : In Delta mode, the system calculates the difference between the volume absorbed by bids and asks, revealing points only when the absolute value of this difference exceeds the volume filter value. Especially useful for larger tick sizes.
Troubleshooting
If the indicator doesn't mark anything, it means the traded volume hasn't exceeded the set volume filter value within the specified price intervals(tick size) and time limit. Adjust these settings as necessary.
Ocs Ai TraderThis script perform predictive analytics from a virtual trader perspective!
It acts as an AI Trade Assistant that helps you decide the optimal times to buy or sell securities, providing you with precise target prices and stop-loss level to optimise your gains and manage risk effectively.
System Components
The trading system is built on 4 fundamental layers :
Time series Processing layer
Signal Processing layer
Machine Learning
Virtual Trade Emulator
Time series Processing layer
This is first component responsible for handling and processing real-time and historical time series data.
In this layer Signals are extracted from
averages such as : volume price mean, adaptive moving average
Estimates such as : relative strength stochastics estimates on supertrend
Signal Processing layer
This second layer processes signals from previous layer using sensitivity filter comprising of an Probability Distribution Confidence Filter
The main purpose here is to predict the trend of the underlying, by converging price, volume signals and deltas over a dominant cycle as dimensions and generate signals of action.
Key terms
Dominant cycle is a time cycle that has a greater influence on the overall behaviour of a system than other cycles.
The system uses Ehlers method to calculate Dominant Cycle/ Period.
Dominant cycle is used to determine the influencing period for the underlying.
Once the dominant cycle/ period is identified, it is treated as a dynamic length for considering further calculations
Predictive Adaptive Filter to generate Signals and define Targets and Stops
An adaptive filter is a system with a linear filter that has a transfer function controlled by variable parameters and a means to adjust those parameters according to an optimisation algorithm. Because of the complexity of the optimisation algorithms, almost all adaptive filters are digital filters. Thus Helping us classify our intent either long side or short side
The indicator use Adaptive Least mean square algorithm, for convergence of the filtered signals into a category of intents, (either buy or sell)
Machine Learning
The third layer of the System performs classifications using KNN K-Nearest Neighbour is one of the simplest Machine Learning algorithms based on Supervised Learning technique.
K-NN algorithm assumes the similarity between the new case/data and available cases and put the new case into the category that is most similar to the available categories.
K-NN algorithm stores all the available data and classifies a new data point based on the similarity. This means when new data appears then it can be easily classified into a well suite category by using K- NN algorithm. K-NN algorithm can be used for Regression as well as for Classification but mostly it is used for the Classification problems.
Virtual Trade Emulator
In this last and fourth layer a trade assistant is coded using trade emulation techniques and the Lines and Labels for Buy / Sell Signals, Targets and Stop are forecasted!
How to use
The system generates Buy and Sell alerts and plots it on charts
Buy signal
Buy signal constitutes of three targets {namely T1, T2, T3} and one stop level
Sell signal
Sell signal constitutes of three targets {namely T1, T2, T3} and one stop level
What Securities will it work upon ?
Volume Informations must be present for the applied security
The indicator works on every liquid security : stocks, future, forex, crypto, options, commodities
What TimeFrames To Use ?
You can use any Timeframe, The indicator is Adaptive in Nature,
I personally use timeframes such as : 1m, 5m 10m, 15m, ..... 1D, 1W
This Script Uses Tradingview Premium features for working on lower timeframes
In case if you are not a Tradingview premium subscriber you should tell the script that after applying on chart, this can be done by going to settings and unchecking "Is your Tradingview Subscription Premium or Above " Option
How To Get Access ?
You will need to privately message me for access mentioning you want access to "Ocs Ai Trader" Use comment box only for constructive comments. Thanks !

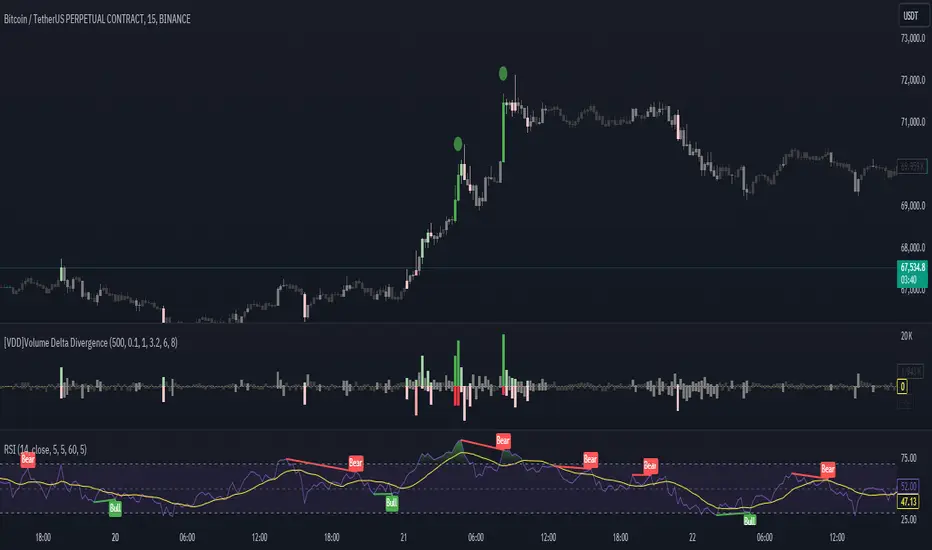
[VDD]Volume Delta DivergenceThis indicator displays volume candles bidirectionally and indicates the strength of the volume. It can create better synergy when used together with the Momentum Squeeze Indicator and can be very useful for bottom and top catching. I am continually modifying it for additional features, so please evaluate it with that in mind.
Advanced Real-Time Volume Delta// -----------------------------------------------------------------------------
// Advanced Real-Time Volume Delta Indicator
// Developed by ThomasTradingAlgo
// -----------------------------------------------------------------------------
// DESCRIPTION:
// This script calculates and displays various volume-related metrics in real-time
// to help traders analyze buying and selling pressure in the market. It includes
// features such as volume delta, cumulative delta, volume delta pace, and price-volume
// delta relationship. This script also highlights High Volume Nodes (HVNs) and Low
// Volume Nodes (LVNs) and allows users to customize various display options.
// USAGE:
// 1. Add this script to your TradingView chart by copying and pasting the code into
// a new Pine Script indicator.
// 2. Customize the input parameters to suit your analysis needs:
// - Timeframe: Select the timeframe for analysis.
// - Mode: Choose between "Up/Down/Neutral" or "Up/Down" to consider neutral volume.
// - Show Split: Display the split of buy, sell, and neutral volumes separately.
// - Show Start Line: Display a line indicating where real-time data starts.
// - Show MA: Display a moving average of volume.
// - MA Period: Set the period for the volume moving average.
// - Show Net Delta Vol Above Bar: Display the net delta volume above the bar.
// - Show Cumulative Delta: Display the cumulative delta volume.
// - Scale Down Factor: Scale down the net delta value for better readability.
// - Highlight Threshold: Highlight bars based on a threshold of average volume.
// - Show Buying/Selling Pressure in Candlestick: Show buying and selling pressure
// directly in the candlestick.
// - HVN Threshold: Set the threshold for High Volume Nodes based on average volume.
// - LVN Threshold: Set the threshold for Low Volume Nodes based on average volume.
// 3. Interpret the volume metrics displayed in the table and on the chart to make
// informed trading decisions.
// HELPFUL TIPS:
// - Use the "Volume Delta" metric to gauge the difference between buying and selling
// pressure in real-time.
// - The "Cumulative Delta" helps track the overall buying or selling pressure over time.
// - "Delta Pace" indicates the speed at which volume delta changes, which can signal
// strong buying or selling pressure.
// - Analyze the "Price-Delta Relationship" to understand potential reversals or trend
// continuations. For instance, if the price is rising but delta is falling, it could
// suggest weakening buying pressure and a potential reversal.
// - Pay attention to HVNs and LVNs, as they can indicate significant support or resistance
// levels based on volume concentration.

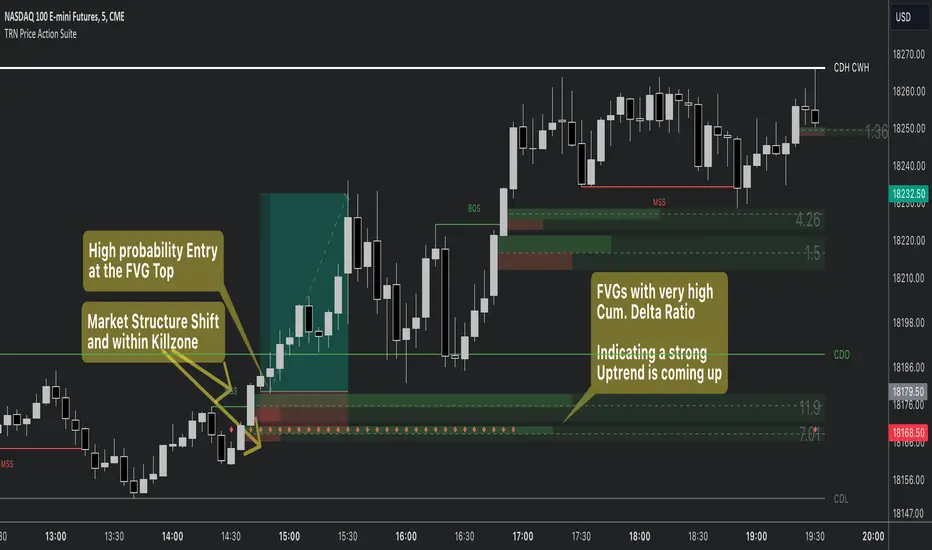
Price Action SuiteThe TRN Price Action Suite incorporates a treasure trove of time and price action concepts. It includes a set of trading tools that, when combined, allow for a more accurate view of the market. This enables traders to find high probability entry points before the market moves to the next liquidation level.
Features of the TRN Price Action Suite:
(Inverse) Fair Value Gaps (FVG)
Order Blocks (OB)
FVG and OB with Cumulative Volume Delta
Volume Imbalances
Market Structure
Liquidity levels
Sessions
Kill zones/Opening Range
The indicator helps traders to easily identify favorable market conditions and high probability trade setups. It automatically finds time and price action concepts and displays them in an intuitive way on the chart. One of the highlights is the detection of Fair Value Gaps and Order Blocks in connection with Cumulative Volume Delta (approx.). You will not find this connection anywhere else.
Fair Value Gaps (FVGs)
A fair value gap occurs when there are inefficiencies in the market or imbalanced buying and selling pressures. Fair value gaps can become a magnet for the price before continuing in the same direction. Special attention should be paid to FVGs that are supported by support and resistance levels, as these offer a higher probability of success for trades. Additionally, the indicator plots inverse FVG (iFVG). These are FVG that are “closed” by a FVG in the other direction. IFVGs are a strong sign of the market to continue in the direction of the iFVG.
In addition to the FVGs you see on the chart, you can add also FVGs from a higher timeframe including the cumulative buy/sell volume. For this you can set “Timeframe 1” and “Timeframe 2” in the settings to your preferred timeframes. E.g. you trade on a 5-minute chart, and you want to see FVGs from 4 hours and a daily chart, then you set Timeframe 1 to 4 h and to Timeframe 2 to 1 D.
Order Blocks and Volume Imbalances can also be shown from higher timeframes.
Order Blocks (OBs)
Order blocks are areas on the chart where a high concentration of limit orders was found in the past. They can serve as potential support or resistance areas. These represent areas in the market where there is an oversupply (supply) or an excess demand (demand). They are often key zones for potential turning points or continuations of the current trend. A bullish OB, for example, is the last bearish candle before a significant uptrend.
FVGs and OBs with Cumulative Volume Delta
The TRN Price Action Suite can show FVGs and OBs with the corresponding Cumulative Volume Delta (CVD). It is a metric to analyze market dynamics by tracking the net difference between buying and selling volumes over a specific timeframe. It is used to determine the strength of the FVG/OB. The FVG/OB includes two bars on the left side, indicating the cumulative buy volume in green as well es the cumulative sell volume in red. At the right side of the FVG/OB box the ratio of the cumulative buy/sell volume is displayed. A high ratio over 1, for example 1.5, indicates a lot of buying pressure. On the hand, a ratio far below 1, for example 0.66, indicates a lot of selling pressure.
Volume Imbalances (VIBs)
Volume Imbalances indicate a price gap from the previous close, but unlike gaps, there is no absence of trading activity within a specific price range. Bullish VIs have opening and closing prices above the previous close, with overlap between the current low and previous high. Bearish VIs are vice versa.
Market Structure
The market structure represents the dominant trend in the market. It is based on swing highs and lows. For instance, if the price makes higher highs (HH) and higher lows (HL) the market structure represents an uptrend. Vice versa if price makes lower lows (LL) and lower highs (LH) the market trend is down.
If the market structure is up, traders can enter positions in a pullback. For this, a trader could use a FVG or an OB as an entry condition.
Market Structure Shift (MSS) (Change of Character (ChoCh))
A market structure shift occurs when the market transitions from one dominant trend to a different one, often signaling a potential change in the underlying market dynamics. A MSS signals the start of a new trend. It signals the change from an uptrend to a down trend and vice versa. Therefore, it is sometimes called change of character (ChoCh). A valid MSS should ideally occur in a strong supply or demand zone. This indicates that the market may be approaching a trend reversal or consolidation.
Break of Structure (BOS)
A break of structure happens when the market breaks out of its established trading range or pattern. The market continues its dominant trend, indicated by the last MSS.
In an uptrend, for example, each time the price breaks through a new high, a "bullish BOS" is formed. This indicates that the market can overcome previous resistance levels and continue to rise.
Levels
One core concept in trading is that price flows to areas of liquidity. Natural liquidity areas are the current day open, high, low (CDO, CDH, CDL) or the previous day high, low, close (PDH, PDL, PDC). The same is true for the current week (CWO, CWH, CWL) and the previous week (PWH, PWL, PWC).
Pay special attention in case some of these levels are close together. Then these levels serve like a magnet for the price. The TRN Price Action Suite indicator can cluster these levels fully automatically together to give the trader the flexibility to focus solely on the trading part.
Sessions
Sessions are the trading hours during which the banks are actively trading. The three main trading sessions:
Asia: Most of the volume from the Asian players are handled within this session.
London: This is where the European players are most active.
New York: In the New York session all the USA players are active as well as all the other American players. Furthermore, a lot of global players are active in this session as well.
Killzones
A kill zone in trading refers to a specific time period during the trading day when the market experiences increased volatility and liquidity. It is an opportunity for traders to capitalize on potential price movements and generate profits. There are several different killzones during the day.
There are three different types of killzones:
Indices/Futures: This one is suitable if you trade products like the ES, NQ, FDAX, CL or Stocks, Options.
Forex: If you trade Forex this setting will mark the most liquid periods of the day.
Opening Range: In case you trade the opening range of the sessions, use this setting.
Trading Example
Volume Delta [hapharmonic]Volume Delta: Volume Delta is an indicator that simplifies how you analyze trading volumes and the percentage of buy-sell activities effortlessly.
As a trader or market analyst, understanding underlying volume and trade flows is critical. The Volume Delta indicator provides thorough insight into both the total volume and the percentage of buying versus selling within the current candlestick. This information is pivotal for those looking to gauge market momentum and sentiment more effectively.
Additionally, the Volume Delta indicator can plot the candlestick colors based on the percentage of the dominant buying or selling volume. The area between the open and close prices of the candlestick is considered 100% and fills with colors corresponding to the predominant volume at that percentage.
Volume Delta also integrates the concept of Net volume. This component is crucial as it reveals the real market sentiment by calculating the difference between the volume of trades executed at an uptick and those at a downtick.
🟠 Overview
This indicator now displays in two layouts. Recently, Tradingview introduced the "force_overlay=true" function in Pine Script , allowing plots to be moved to the main chart. Thus, all displays are from the same indicator.
🟠 USAGE
From the data displayed in 'plot.style_columns' , the peak area represents the entire volume, accounting for 100%. Within this area, there are two color levels indicating volume. If one type of volume, whether buying or selling, exceeds the other, the larger volume will be positioned behind and the smaller in front. This arrangement prevents the scenario where a higher buying volume obscures the smaller selling volume. Therefore, the two colors can be switched between the front and the back as needed.
As you can see, the 12 and 26-day Exponential Moving Averages (EMAs) are used, with the Volume Confirmation Length set at 6. Therefore, the crossing of the EMAs proceeds normally, but it is highlighted with three triangular arrows to indicate a high likelihood of a valid crossover. However, if the volume is insufficient, these markers won't be displayed, although the EMA crossover will still occur as usual. This can be useful for using volume to verify the significance of the EMA crossover.
🟠 Setting
If you enable the label, please be aware that the chart size will shrink, causing the candlestick display to become unclear. Therefore, you might need to select "Logarithmic" at the bottom right of your screen, or for mobile applications, press and hold on the price scale and choose "Logarithmic" to adjust the scale appropriately.
Enjoy!

Trend, Momentum, Volume Delta Ratings Emoji RatingsThis indicator provides a visual summary of three key market conditions - Trend, Momentum, and Volume Delta - to help traders quickly assess the current state of the market. The goal is to offer a concise, at-a-glance view of these important technical factors.
Trend (HMA): The indicator uses a Hull Moving Average (HMA) to assess the overall trend direction. If the current price is above the HMA, the trend is considered "Good" or bullish (represented by a 😀 emoji). If the price is below the HMA, the trend is "Bad" or bearish (🤮). If the price is equal to the HMA, the trend is considered "Neutral" (😐).
Momentum (ROC): The Rate of Change (ROC) is used to measure the momentum of the market. A positive ROC indicates "Good" or bullish momentum (😀), a negative ROC indicates "Bad" or bearish momentum (🤮), and a zero ROC is considered "Neutral" (😐).
Volume Delta: The indicator calculates the difference between the current trading volume and a simple moving average of the volume (Volume Delta). If the Volume Delta is above a user-defined threshold, it is considered "Good" or bullish (😀). If the Volume Delta is below the negative of the threshold, it is "Bad" or bearish (🤮). Values within the threshold are considered "Neutral" (😐).
The indicator displays these three ratings in a compact table format in the top-right corner of the chart. The table uses color-coding to quickly convey the overall market conditions - green for "Good", red for "Bad", and gray for "Neutral".
This indicator can be useful for traders who want a concise, at-a-glance view of the current market trend, momentum, and volume activity. By combining these three technical factors, traders can get a more well-rounded understanding of the market conditions and potentially identify opportunities or areas of concern more easily.
The user can customize the indicator by adjusting the lengths of the HMA, ROC, and Volume moving average, as well as the Volume Delta threshold. The colors used in the table can also be customized to suit the trader's preferences.

Delta ZigZag [LuxAlgo]The Delta ZigZag indicator is focused on volume analysis during the development of ZigZag lines. Volume data can be retrieved from a Lower timeframe (LTF) or real-time Tick data.
Our Delta ZigZag publication can be helpful in detecting indications of a trend reversal or potential weakening/strengthening of the trend.
This indicator by its very nature backpaints, meaning that the displayed components are offset in the past.
🔶 USAGE
The ZigZag line is formed by connecting Swings , which can be set by adjusting the Left and Right settings.
Left is the number of bars for evaluation at the left of the evaluated point.
Right is the number of bars for evaluation at the right of the evaluated point.
A valid Swing is a value higher or lower than the bars at the left/right .
A higher Left or Right set number will generally create broader ZigZag ( ZZ ) lines, while the drawing of the ZZ line will be delayed (especially when Right is set higher). On the other hand, when Right is set at 0, ZZ line are drawn quickly. However, this results in a hyperactive switching of the ZZ direction.
To ensure maximum visibility of values, we recommend using " Bars " from the " Bar's style " menu.
🔹 Volume examination
The script provides two options for Volume examination :
Examination per ZigZag line
Examination per bar
Bullish Volume is volume associated with a green bar ( close > open )
Bearish Volume is volume associated with a red bar ( close < open )
Neutral Volume (volume on a " close == open" bar) is not included in this publication.
🔹 Examination per ZigZag line
As long as the price moves in the same direction, the present ZZ line will continue. When the direction of the price changes, the bull/bear volume of the previous ZZ line is evaluated and drawn on the chart.
The ZZ line is divided into two parts: a bullish green line and a bearish red line.
The intercept of these two lines will depend on the ratio of bullish/bearish volume
This ratio is displayed at the intercept as % bullish volume (Settings -> Show % Bullish Volume)
* Note that we cannot draw between 2 bars. Therefore, if a ZZ line is only 1 bar long, the intercept will be at one of those 2 bars and not in between. The percentage can be helpful in interpreting bull/bear volume.
In the example above (2 most right labels), you can see that an overlap of 2 labels is prevented, ensuring the ability to evaluate the bullish % volume of the ZZ line .
The percentage will be colored green when more than 50%, red otherwise. The color will fade when the direction is contradictory; for example, 40% when the ZZ line goes up or 70% when the ZZ line falls.
More details can be visualized by enabling " Show " and choosing 1 of 3 options:
Average Volume Delta/bar
Average Volume/bar
Normalised Volume Delta
For both 'averages', the sum of " Volume "/" Volume Delta " of every bar on the ZZ line is divided by the number of bars (per ZZ line ).
The " Normalised Volume Delta " is calculated by dividing the sum of " Delta Volume " by the sum of " Volume " (neutral volume not included), which is displayed as a percentage.
All three options will display a label at the last point of the ZZ line and be coloured similarly: green when the ratio bullish/bearish volume of the ZZ line is bullish and red otherwise. Here, the colour also fades when it is bullish, but the ZZ line falls or when it is bearish with a rising ZZ line .
A tooltip at each label hints at the chosen option.
You can pick one of the options or combine them together.
🔹 Examination per bar
Besides information about what's happening during the ZZ line , information per bar can be visualized by enabling " Show Details " in Settings .
Split Volume per bar : show the sum of bullish (upV) and bearish (dnV) volume per bar
Volume (bar) : Total Volume per bar (bullish + bearish volume, neutral volume not included)
Δ Volume (bar) : Show Delta Volume (bullish - bearish volume)
🔹 Using Lower Timeframe Data
The ZigZag lines using LTF data are colored brighter. Also note the vertical line where the LTF data starts and the gap between ZZ lines with LTF data and without.
When " LTF " is chosen for the " Data from: " option in Settings , data is retrieved from Lower Timeframe bars (default 1 minute). When the LTF setting is higher than the current chart timeframe, the LTF period will automatically be adjusted to the current timeframe to prevent errors.
As there is a 100K limit to the number of LTF intrabars that can be analyzed by a script, this implies the higher the difference between LTF and current TF; the fewer ZZ lines will be seen.
🔹 Using real-time tick data
The principles are mostly the same as those of LTF data. However, in contrast with LTF data, where you already have LTF ZZ lines when loading the script, real-time tick data-based ZZ lines will only start after loading the chart.
Changing the settings of a ticker will reset everything. However, returning to the same settings/ticker would show the cached data again.
Here, you can see that changing settings reset everything, but returning after 2 minutes to the initial settings shows the cached data. Don't expect it to be cached for hours or days, though.
🔶 DETAILS
The timeframe used for LTF data should always be the same or lower than the current TF; otherwise, an error occurs. This snippet prevents the error and adjusts the LTF to the current TF when LTF is too high:
res = input.timeframe('1')
res := timeframe.from_seconds( math.min( timeframe.in_seconds(timeframe.period), timeframe.in_seconds(res) ) )
🔶 SETTINGS
Data from: LTF (Lower TimeFrame) or Ticks (Real-time ticks)
Res: Lower TimeFrame (only applicable when choosing LTF )
Option: choose " high/low " or " close " for Swing detection
🔹 ZigZag
Left: Lookback period for Swings
Right: Confirmation period after potential Swing
🔹 ZigZag Delta
Show % Bullish Volume : % bullish volume against total volume during the ZZ line
Show:
Average Volume Delta/bar
Average Volume/bar
Normalised Volume Delta
See USAGE for more information
🔹 Bar Data
Split Volume per bar: shows the sum of bullish ( upV ) and bearish ( dnV ) volume per bar
Volume (bar): Total Volume per bar (bullish + bearish volume, neutral volume not included)
Δ Volume (bar): Show Volume Delta (bullish - bearish volume)

Cumulative Delta Volume WaveIntroducing an Enhanced Version of the CDV by LonesomeTheBlue
For the original version and description check this link:
What Makes This Version Different than the original?
This enhanced version of the CDV indicator incorporates advanced signal processing techniques to bring new depth to market analysis.
Standard Deviation Bands and EMAs: These additions to the CDV offer a visual representation of significant market movements—highlighting major pumps and dumps, as well as identifying potential support and resistance levels.
Color-Coded Insights: The standard deviation bands utilize color coding based on signal processing principles. This feature becomes increasingly useful the more you zoom out, making it easier to observe and interpret market waves.
Market Maker Activity: By examining fluctuations within the standard deviation bands, traders can gauge when Market Makers are actively maneuvering to establish their long and short positions, often at the expense of retail traders.
EMA Support and Resistance: The embedded Exponential Moving Averages (EMAs) serve as dynamic support and resistance levels. Analyzing these can help traders determine the continuing strength of a market move, whether bullish or bearish.
Visual Guide to the Basics
For a clearer understanding of what this enhanced indicator can show, please refer to the image below:
And in addition to all the above one can detect relevant W and M structures way easier with this indicator ;)

Order Chain [Kioseff Trading]Hello!
This indicator "Order Chain" uses live tick data (varip) to retrieve live tick volume.
This indicator must be used on a live market with volume data
Features
Live Tick Volume
Live Tick Volume Delta
Orders are appended to boxes, whose width and height are scaled proportional to the size of the order.
CVD recorded at relevant tick levels
Order chain spans up to 450 ticks (might include aggregates)
The image above shows key features for the indicator!
The image above explains line and color placements.
The image above shows the indicator in action for a live market!
How It Works
The indicator records the difference in volume from "now" and the previous tick. Predicated on whether the "now" price is greater than or less than price one tick prior, the difference in volume is recorded as "buy" or "sell" volume.
This filled order (or aggregates) is colored in congruence with price direction. The filled order is subsequently appended to its relevant tick level and added (buy order) or subtracted (sell order) from the CVD value at the identified tick level.
Of course, thank you to @PineCoders and @RicardoSantos for their awesome libraries :D
Thank you!

Cumulative Volume Delta (CVD)█ OVERVIEW
Cumulative Volume Delta (CVD) is a volume-based trading indicator that provides a visual representation of market buying and selling pressure by calculating the difference in traded volumes between the two sides. It uses intrabar information to obtain more precise volume delta information than methods using only the chart's timeframe.
Volume delta is the net difference between Buy Volume and Sell Volume. Positive volume delta indicates that buy volume is more than sell volume, and opposite. So Cumulative Volume Delta (CVD) is a running total/cumulation of volume delta values, where positive VD gets added to the sum and negative VD gets subtracted from the sum.
I found simple and fast solution how to calculate CVD, so made plain and concise code, here is CVD function :
cvd(_c, _o, _v) =>
var tcvd = 0.0, delta = 0.0
posV = 0.0, negV = 0.0
totUV = 0.0, totDV = 0.0
switch
_c > _o => posV += _v
_c < _o => negV -= _v
_c > nz(_c ) => posV += _v
_c < nz(_c ) => negV -= _v
nz(posV ) > 0 => posV += _v
nz(negV ) < 0 => negV -= _v
totUV += posV
totDV += negV
delta := totUV + totDV
cvd = tcvd + delta
tcvd += delta
cvd
where _c, _o, _v are close, open and volume of intrabar much lower timeframe.
Indicator uses intrabar information to obtain more precise volume delta information than methods using only the chart's timeframe.
Intrabar precision calculation depends on the chart's timeframe:
CVD is good to use together with open interest, volume and price change.
For example if CVD is rising and price makes good move up in short period and volume is rising and open interest makes good move up in short period and before was flat market it is show big chance to pump.
Asset capital flows - multi-timeframeIndicator for use on the any timeframe to show net capital flows into an asset of your choosing, to allow the user to track potential buy and selling pressure.
Net volume is derived from lower timeframe data (5 minute chart by default for daily timeframe) and multiplied by the average price for the same LTF period (defined by the mean of the high, low + close values). This gives the net capital inflow or outflow for the asset per bar. The cumulative sum of all previous bars is also calculated each period/day and available to be plotted as a line chart.
This might be preferred to other similar indicators as it uses low time frame bars to calculate the up/down volumes and price, thus accuracy is improved.
It should be borne in mind that the values of capital flows displayed are specific to the asset and the volume/price feed origin (ie the listed exchange used), and thus correlated with the total underlying flows, but there are other external factors influencing the volume/price data feed beyond the buy/sell volume of the specified exchange (such as spot and futures trading on other locations/exchanges)

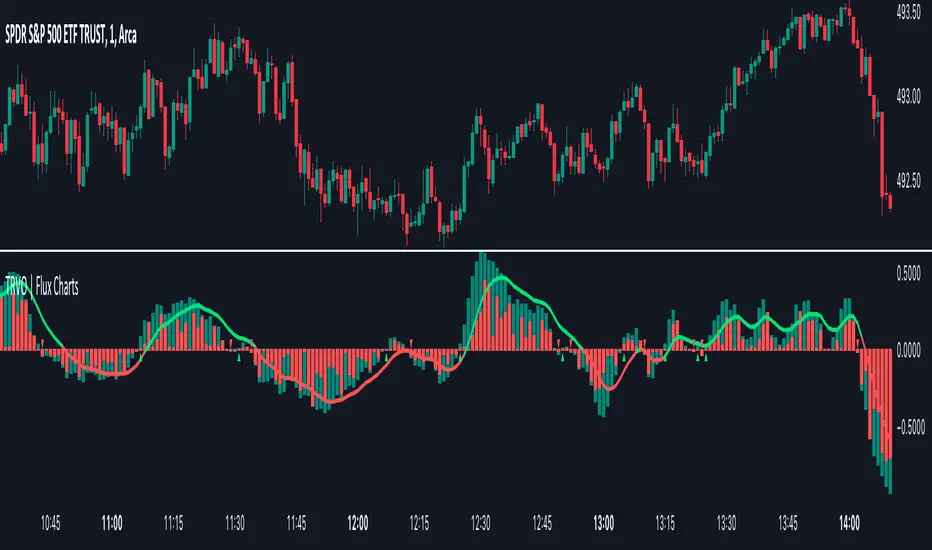
Time Relative Volume Oscillator | Flux Charts💎 GENERAL OVERVIEW
The relative volume indicator aims to improve upon the default existing relative volume indicator by comparing volumes between previous trading sessions rather than previous candles. As such, it works best on lower time frames as there is more data to compare with. The purpose of the indicator is to show how the current bar’s volume compares to the volume at the same time on previous trading days.
There exists a couple different modes and combinations that each provide a different perspective on the trading volume.
Oscillator mode
Oscillator mode starts with the same relative volume calculation, but adds two EMAs of different lengths that diverge and converge. Like the MACD, it plots the difference as a histogram. This functions as an easy way to view when relative volume is increasing or decreasing.
How to use:
The oscillator oscillates between -1 and 1. It moves along with volume direction, so this mode can be used to view the current volume direction in a lagging fashion. In oscillating markets, this indicator can give an idea of how buy/sell volume is moving and where it currently stands. Small arrows mark where reversals are predicted, when the histogram crosses over 0. The biggest pitfall of this mode is that, in a straight trending market, the two EMAs converge and it gives a false reversal signal.
Delta mode
Delta volume mode is a step up from the buy/sell volume mode. It separates both sides into the top and bottom, while also displaying the actual volume behind it in a semi transparent overlay. The best feature, however, is the delta oscillator. This oscillator fluctuates depending on how buy/sell volume is changing and plots bullish/bearish labels when the dominant side (bullish/bearish) changes. The signals, while a bit common, can sometimes dictate large direction changes, started by a dominant volume switch.
On top of different display modes, there is also one more volume mode: buy/sell volume. Instead of only showing the total volume and relative volume, it calculates and separates buying and selling volume.
This volume mode displays differently in all three viewing modes, but the basic principle is the same. It adds a vital piece of information to the chart without adding clutter. The calculation for buy/sell volume uses the candle wicks and body to compare bullish and bearish movement.
Classic mode
Classic mode takes the default volume indicator and improves upon it by also displaying the relative volume on top of the actual volume. Relative volume is calculated similarly between the three display modes: simply by comparing the current bar’s volume to the volume at the same time during previous trading days. Classic mode displays this “relative volume” as well as a simple EMA over top of the actual trading volume.
Originality
The script improves upon the existing relative volume indicator by using previous trading days rather than previous candles to generate the relative volume. On top of that, the calculation methods are unique, using different formulas like variations of the sigmoid function to smooth noise. The main issue this script aims to fix is that towards the start or end of the day relative volume indicators all see spikes as volume grows into close. The new relative volume calculations fix this problem and show what the “true” relative volume is because they compare the current bar to the “same” bar on previous trading sessions.
Advanced VolumeThe "Advanced Volume" indicator is a versatile tool designed for traders who need a detailed analysis of market volume dynamics. It provides three unique modes of volume analysis: Simple, Complex, and Analytics, each offering distinct insights for various trading styles.
Key Features:
Modes of Operation:
Simple Mode: Displays traditional volume data for a quick overview of market activity.
Complex Mode: Reveals the differential volume between buyers and sellers in a lower time frame. This mode features two average lines - one showing the current average volume level and another depicting the past average, based on the chosen length. These lines provide a comparative view of current and historical market dynamics.
Analytics Mode: Combines buyers' and sellers' volume in a lower time frame with their average. The average line in this mode changes color based on the dominant volume: it turns blue (default color for positive volume) if the average buy volume is higher, and switches to the sell volume color if the average sell volume is predominant.
Customizable Settings:
Average Length: Allows you to adjust the length for moving average calculations.
Definition: Select from 'Maximum', 'High', or 'Medium' for time frame granularity.
Visual Preferences: Customize the width and colors of the volume bars and average lines to suit your visual preference.
Dynamic Calculations and Plots:
Differentiates between up-volume and down-volume for nuanced market sentiment analysis.
Includes various plots such as volume bars, moving averages, and dynamic lines for comprehensive analysis.
Usage Tips:
Utilize 'Simple Mode' for a quick market overview.
Engage 'Complex Mode' to assess buying vs. selling pressures and compare current volume trends against historical averages.
Apply 'Analytics Mode' for an in-depth analysis of volume trends, with color-coded average lines indicating dominant market forces.

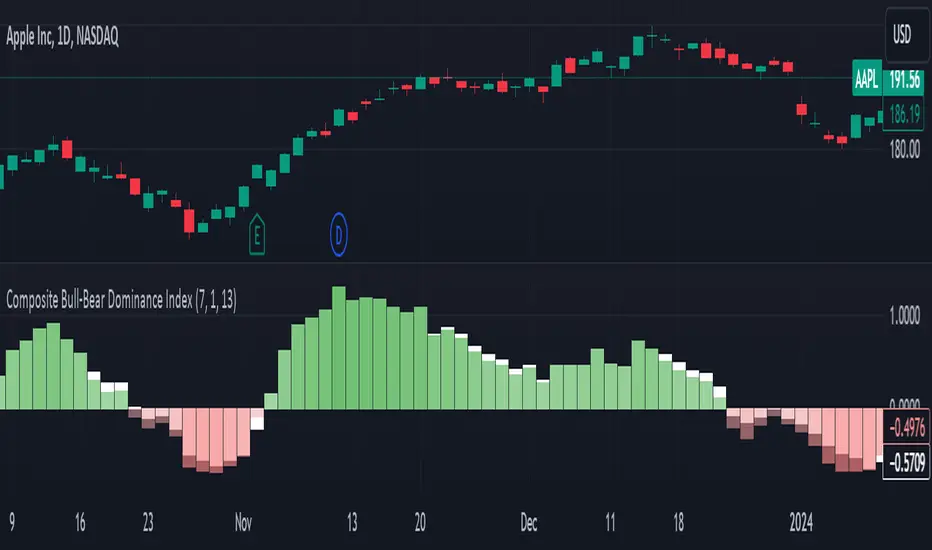
Composite Bull-Bear Dominance IndexNote: CREDITS: This is based on the Up Down Volume Indicator (published in Trading View) and Elder Ray Index (Bull Bear Power).
The Composite Bull Bear Dominance Index (CBBDI) is a indicator that combines up down volume analysis with Bull and Bear Power to provide a comprehensive view of market dynamics. It calculates Z-scores for up down volume delta and bull bear power measures, averages them, and then smoothes the result using Weighted Moving Average (WMA) for Bull and Bear Power and Volume Weighted Moving Average (VWMA) for Up and Down Volume Delta. The advantages include responsiveness to short-term trends, noise reduction through weighting, incorporation of volume information, and the ability to identify significant changes in buying and selling pressure. The indicator aims to offer clear signals for traders seeking insights into overall market dominance and indicate if the bulls or the bears have the upper hand.
Volume Analysis (Up/Down Volume Delta):
Up/Down Volume Delta reflects the net difference between buying and selling volume, providing insights into the prevailing market sentiment.
Positive Delta: Indicates potential bullish dominance due to higher buying volume.
Negative Delta: Suggests potential bearish dominance as selling volume surpasses buying volume.
Price Analysis (Bull and Bear Power):
Bull and Bear Power measure the strength of buying and selling forces based on price movements and the Exponential Moving Average (EMA) of the closing price.
Positive Bull Power: Reflects bullish dominance, indicating potential upward momentum.
Positive Bear Power: Suggests bearish dominance, indicating potential downward momentum.
Composite Bull Bear Dominance Index (CBBDI):
CBBDI combines the standardized Z-scores of Up/Down Volume Delta and Bull Bear Power, providing an average measure of both volume and price-related dominance.
Positive CBBDI: Indicates an overall bullish dominance in both volume and price dynamics.
Negative CBBDI: Suggests an overall bearish dominance in both volume and price dynamics.
Smoothing Techniques:
The use of Weighted Moving Average (WMA) for smoothing Bull and Bear Power Z-scores, and Volume Weighted Moving Average (VWMA) for smoothing Up/Down Volume Delta, reduces noise and provides a clearer trend signal.
Smoothing helps filter out short-term fluctuations and emphasizes more significant trends in both volume and price movements.
Color Coding:
CBBDI values are color-coded based on their direction, visually representing the prevailing market sentiment.
Green Colors: Positive values indicate potential bullish dominance.
Red Colors: Negative values suggest potential bearish dominance.
Cumulative Volume Price (Candle Body, High-Low)Indicator Description: Cumulative Volume Price (Candle Body, High Low)
This indicator features three cumulative plots that continuously accumulate values over time.
Cumulative Volume Plot:
The first plot displays the cumulative volume, calculated by continuously adding the volume values from zero.
Cumulative Candle Body Width Plot:
The second plot displays the cumulative width of the candle bodies, obtained by continuously adding the actual body widths from zero.
Cumulative Candle High-Low Width Plot:
The third plot displays the cumulative width of the candle high-low ranges, calculated by continuously adding the widths between the high and low prices from zero.
Usage Guidelines:
Due to the different orders of magnitude in value range used for volume and candlesticks, it is advisable to typically select and display any single plot.
説明
このインジケーターは、時間の経過とともに値を累積し続ける3つのプロットを備えています。
累積ボリューム:
ボリュームの値をゼロから累積的に加算しています。
ローソク足の累積実体幅:
ローソク足の実体幅の値をゼロから累積的に加算しています。
ローソク足の累積高安幅:
ローソク足の高安の幅の値をゼロから累積的に表示しています。
使用ガイドライン:
ボリュームとローソク足で使用する数値のオーダーが異なるため、通常は任意の一本を選択して表示することを想定しています。

Trended CVD [Mxwll]Hey!
This indicator "Trended CVD" categorizes price movement by trend (using zig zag) and calculates cumulative volume delta for the entirety of the price move.
Features
CVD calculated for the trend
CVD divergences are distinguished (uptrend and falling CVD / downtrend and rising CVD)
CVD output normalized to scale with chart, and is plotted alongside the trend
Can be used for trend confirmation (CVD trend correlating with price trend)
All regular zig-zag features available
What constitutes a trend is customizable. Can locate small, medium, large price trends with detailed user-input settings.
How-To Use Trended CVD
The image above shows one of two primary uses for the indicator.
In the left-half of the image, price is downtrending simultaneously with CVD; thereby, CVD is confirming the downtrend.
The right-half of the image shows price uptrending simultaneously with CVD; CVD is confirming the uptrend.
This information can be used to classify the "strength" of the price move, and decide to trade with it or against it.
The image above shows the second primary use for the indicator.
A slight price decrease transpires while CVD increases - CVD diverging upwards from the price trend.
This information can be used to classify the strength of the downtrend, and decide to trade against it, or abstain from trading with it.
The image above shows, subsequent to divergence, price failed to sustain "meaningful" downwards movement.
Labels oriented at the final pivot of a trend show the cumulative volume delta for the entirety of the price move (distinguishable by the superimposed zig zag line).
That's really it! A more complex concept integrated with a simple output.
Thank you!

Split VolumeThe Split Volume indicator displays 'Upwards' and 'Downwards' volume with an additional method for distributing 'split' candle volume.
A 'split' candle is a candle whose direction is...'Split'...since the open and close are equal. (Ex. Doji)
Upwards and Downwards Volume is tracked by comparing the Open and Closes of the Lower Timeframes.
If the Close is Greater-than the Open, we track the Volume as 'Upwards' Volume.
If the Close is Less-than the Open, we track the Volume as 'Downwards' Volume.
If the Close and Open are Equal, we assume that the Volume is an even split 50/50, and track it as such.
The indicator pulls data from lower timeframes to achieve more granular Open,Close,& Volume Data
Specifically:
<5m Timeframe: 1 Second LTF
<60m Timeframe: 5 Second LTF
<1D Timeframe: 1 Minute LTF
>1D Timeframe: 60m LTF
We have also included some nice-to-have features
50% Volume Line: This line splits each columns in half, this is used as quick reference to see exactly which side the volume is on.
High Volume Candle Identification: We are detecting bars with high relative volume and coloring them on the upper chart for use as important zones.
Status Line Readouts: The Status line for this indicator is formatted for simple reading. It Reads(Left-to-Right):Total Volume, Downwards Volume, 50% Value, Upwards Volume

Volume Heatmap 2024 | NXT2017 Christmas EditionHi big players around the world,
I wish you a merry christmas time.
Today I have a nice present for you: a new volume heatmap indicator for free using!
HISTORY
My first volume heatmap project got a lot of feedback and a big demand. You can find it here:
In this time pinescript version 4 was the newest one and I worked the first time with arrays.
Today we have pinescript version 5 and some new features. This is why I tried again with matrix function and the results are better than I expected.
HOW IT WORKS
The indicator calculates similar like the volume profile. It looks back and every volume where the close price is on the same row area, the volume will cumulated. How much rows the new chart view is showing, you can choose manually.
The mind behind this is to find high volume levels, where high volume catch the price in a range or get function as support/resistance line.
PICTURES
I hope it helps for your trading. You are welcome to give some comments.
Merry christmas and best regards
NXT2017

Enhanced Cumulative Volume Delta [NariCapitalTrading]Enhanced Cumulative Volume Delta (eCVD) Technical Guide
Introduction
The Enhanced Cumulative Volume Delta (eCVD) is a technical indicator in trading that measures the cumulative difference between buying and selling volume over a user-defined period. It helps in understanding market sentiment by showing whether buyers or sellers dominate.
Calculation
Inputs
Period : Number of bars for cumulative volume calculation (default: 14).
MA Period : Period for the moving average of eCVD (default: 20).
Volume Delta Calculation
Buying Volume (buyVolChange) : Counted as buying volume if the current close is greater than the previous.
Selling Volume (sellVolChange) : Counted as selling volume if the current close is less than the previous.
Cumulative Volume Delta (CVD)
Cumulative buying ( cumBuyVol ) and selling volumes ( cumSellVol ) are calculated.
Every period bars, these cumulative volumes are reset.
eCVD is the difference between cumulative buying and selling volumes.
CVD Moving Average
Simple Moving Average (SMA) of eCVD calculated over maPeriod .
Interpretation
eCVD Histogram
Plotted as a histogram.
Color Coding :
Green : Positive eCVD (more buying volume).
Red : Negative eCVD (more selling volume).
Black : No significant difference between buying and selling volume.
CVD Moving Average
Moving average line (yellow) indicates eCVD trend direction and strength.
Application
Trend Confirmation : Rising eCVD suggests an uptrend; falling eCVD suggests a downtrend.
Divergence : Opposite movements in price and eCVD can indicate potential reversals.
Volume Analysis : High eCVD values signal high trading activity, significant at market extremes.
Conclusion
The eCVD can be used to analyze buyer/seller dynamics through volume. It should be used alongside other methods for informed trading decisions.
