OPEN-SOURCE SCRIPT
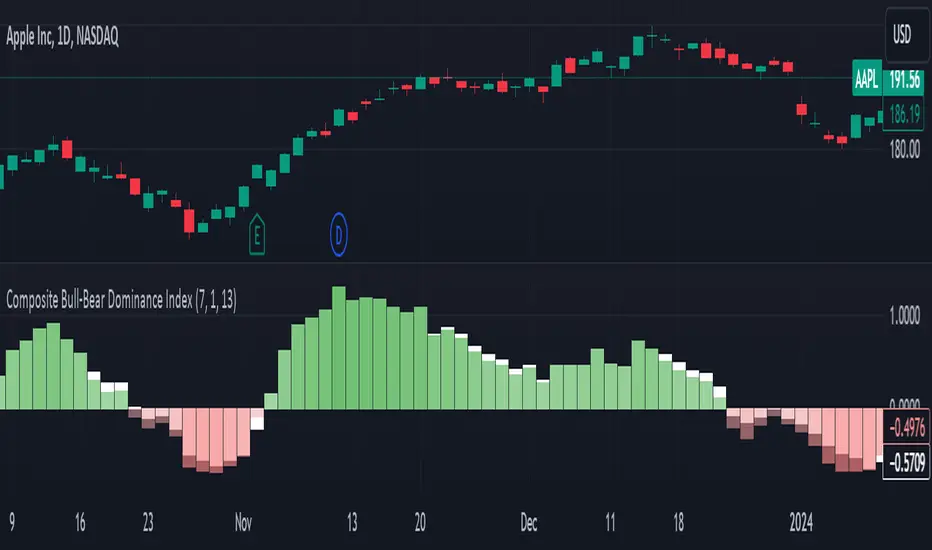
Composite Bull-Bear Dominance Index
Note: CREDITS: This is based on the Up Down Volume Indicator (published in Trading View) and Elder Ray Index (Bull Bear Power).
The Composite Bull Bear Dominance Index (CBBDI) is a indicator that combines up down volume analysis with Bull and Bear Power to provide a comprehensive view of market dynamics. It calculates Z-scores for up down volume delta and bull bear power measures, averages them, and then smoothes the result using Weighted Moving Average (WMA) for Bull and Bear Power and Volume Weighted Moving Average (VWMA) for Up and Down Volume Delta. The advantages include responsiveness to short-term trends, noise reduction through weighting, incorporation of volume information, and the ability to identify significant changes in buying and selling pressure. The indicator aims to offer clear signals for traders seeking insights into overall market dominance and indicate if the bulls or the bears have the upper hand.
Volume Analysis (Up/Down Volume Delta):
Up/Down Volume Delta reflects the net difference between buying and selling volume, providing insights into the prevailing market sentiment.
Positive Delta: Indicates potential bullish dominance due to higher buying volume.
Negative Delta: Suggests potential bearish dominance as selling volume surpasses buying volume.
Price Analysis (Bull and Bear Power):
Bull and Bear Power measure the strength of buying and selling forces based on price movements and the Exponential Moving Average (EMA) of the closing price.
Positive Bull Power: Reflects bullish dominance, indicating potential upward momentum.
Positive Bear Power: Suggests bearish dominance, indicating potential downward momentum.
Composite Bull Bear Dominance Index (CBBDI):
CBBDI combines the standardized Z-scores of Up/Down Volume Delta and Bull Bear Power, providing an average measure of both volume and price-related dominance.
Positive CBBDI: Indicates an overall bullish dominance in both volume and price dynamics.
Negative CBBDI: Suggests an overall bearish dominance in both volume and price dynamics.
Smoothing Techniques:
The use of Weighted Moving Average (WMA) for smoothing Bull and Bear Power Z-scores, and Volume Weighted Moving Average (VWMA) for smoothing Up/Down Volume Delta, reduces noise and provides a clearer trend signal.
Smoothing helps filter out short-term fluctuations and emphasizes more significant trends in both volume and price movements.
Color Coding:
CBBDI values are color-coded based on their direction, visually representing the prevailing market sentiment.
Green Colors: Positive values indicate potential bullish dominance.
Red Colors: Negative values suggest potential bearish dominance.
Açık kaynak kodlu komut dosyası
Gerçek TradingView ruhuna uygun olarak, bu komut dosyasının oluşturucusu bunu açık kaynaklı hale getirmiştir, böylece yatırımcılar betiğin işlevselliğini inceleyip doğrulayabilir. Yazara saygı! Ücretsiz olarak kullanabilirsiniz, ancak kodu yeniden yayınlamanın Site Kurallarımıza tabi olduğunu unutmayın.
Feragatname
Bilgiler ve yayınlar, TradingView tarafından sağlanan veya onaylanan finansal, yatırım, işlem veya diğer türden tavsiye veya tavsiyeler anlamına gelmez ve teşkil etmez. Kullanım Şartları'nda daha fazlasını okuyun.