Cumulative Volume Delta Profile and Heatmap [BackQuant]Cumulative Volume Delta Profile and Heatmap
A multi-view CVD workstation that measures buying vs selling pressure, renders a price-aligned CVD profile with Point of Control, paints an optional heatmap of delta intensity, and detects classical CVD divergences using pivot logic. Built for reading who is in control, where participation clustered, and when effort is failing to produce result.
What is CVD
Cumulative Volume Delta accumulates the difference between aggressive buys and aggressive sells over time. When CVD rises, buyers are lifting the offer more than sellers are hitting the bid. When CVD falls, the opposite is true. Plotting CVD alongside price helps you judge whether price moves are supported by real participation or are running on fumes.
Core Features
Visual Analysis Components
CVD Columns - Plot of cumulative delta, colored by side, for quick read of participation bias.
CVD Profile - Price-aligned histogram of CVD accumulation using user-set bins. Shows where net initiative clustered.
Split Buy and Sell CVD - Optional two-sided profile that separates positive and negative CVD into distinct wings.
POC - Point of Control - The price level with the highest absolute CVD accumulation, labeled and line-marked.
Heatmap - Semi-transparent blocks behind price that encode CVD intensity across the last N bars.
Divergence Engine - Pivot-based detection of Bearish and Bullish CVD divergences with optional lines and labels.
Stats Panel - Top level metrics: Total CVD, Buy and Sell totals with percentages, Delta Ratio, and current POC price.
How it works
Delta source and sampling
You select an Anchor Timeframe that defines the higher time aggregation for reading the trend of CVD.
The script pulls lower timeframe volume delta and aggregates it to the anchor window. You can let it auto-select the lower timeframe or force a custom one.
CVD is then accumulated bar by bar to form a running total. This plot shows the direction and persistence of initiative.
Profile construction
The recent price range is split into Profile Granularity bins.
As price traverses a bin, the current delta contribution is added to that bin.
If Split Buy and Sell CVD is enabled, positive CVD goes to the right wing and negative CVD to the left wing.
Widths are scaled by each side’s maximum so you can compare distribution shape at a glance.
The Point of Control is the bin with the highest absolute CVD. This marks where initiative concentrated the most.
Heatmap
For each bin, the script computes intensity as absolute CVD relative to the maximum bin value.
Color is derived from the side in control in that bin and shaded by intensity.
Heatmap Length sets how far back the panels extend, highlighting recurring participation zones.
Divergence model
You define pivot sensitivity with Pivot Left and Right .
Bearish divergence triggers when price confirms a higher high while CVD fails to make a higher high within a configurable Delta Tolerance .
Bullish divergence triggers when price confirms a lower low while CVD fails to make a lower low.
On trigger, optional link lines and labels are drawn at the pivots for immediate context.
Key Settings
Delta Source
Anchor Timeframe - Higher TF for the CVD narrative.
Custom Lower TF and Lower Timeframe - Force the sampling TF if desired.
Pivot Logic
Pivot Left and Right - Bars to each side for swing confirmation.
Delta Tolerance - Small allowance to avoid near-miss false positives.
CVD Profile
Show CVD Profile - Toggle profile rendering.
Split Buy and Sell CVD - Two-sided profile for clearer side attribution.
Show Heatmap - Project intensity panels behind price.
Show POC and POC Color - Mark the dominant CVD node.
Profile Granularity - Number of bins across the visible price range.
Profile Offset and Profile Width - Position and scale the profile.
Profile Position - Right, Left, or Current bar alignment.
Visuals
Bullish Div Color and Bearish Div Color - Colors for divergence artifacts.
Show Divergence Lines and Labels - Visualize pivots and annotations.
Plot CVD - Column plot of total CVD.
Show Statistics and Position - Toggle and place the summary table.
Reading the display
CVD columns
Rising CVD confirms buyers are in control. Falling CVD confirms sellers.
Flat or choppy CVD during wide price moves hints at passive or exhausted participation.
CVD profile wings
Thick right wing near a price zone implies heavy buy initiative accumulated there.
Thick left wing implies heavy sell initiative.
POC marks the strongest initiative node. Expect reactions on first touch and rotations around this level when the tape is balanced.
Heatmap
Brighter blocks indicate stronger historical net initiative at that price.
Stacked bright bands form CVD high volume nodes. These often behave like magnets or shelves for future trade.
Divergences
Bearish - Price prints a higher high while CVD fails to do so. Effort is not producing result. Potential fade or pause.
Bullish - Price prints a lower low while CVD fails to do so. Capitulation lacks initiative. Potential bounce or reversal.
Stats panel
Total CVD - Net initiative over the window.
Buy and Sell volume with percentages - Side composition.
Delta Ratio - Buy over Sell. Values above 1 favor buyers, below 1 favor sellers.
POC Price - Current control node for plan and risk.
Workflows
Trend following
Choose an Anchor Timeframe that matches your holding period.
Trade in the direction of CVD slope while price holds above a bullish POC or below a bearish POC.
Use pullbacks to CVD nodes on your profile as entry locations.
Trend weakens when price makes new highs but CVD stalls, or new lows while CVD recovers.
Mean reversion
Look for divergences at or near prior CVD nodes, especially the POC.
Fade tests into thick wings when the side that dominated there now fails to push CVD further.
Target rotations back toward the POC or the opposite wing edge.
Liquidity and execution map
Treat strong wings and heatmap bands as probable passive interest zones.
Expect pauses, partial fills, or flips at these shelves.
Stops make sense beyond the far edge of the active wing supporting your idea.
Alerts included
CVD Bearish Divergence and CVD Bullish Divergence.
Price Cross Above POC and Price Cross Below POC.
Extreme Buy Imbalance and Extreme Sell Imbalance from Delta Ratio.
CVD Turn Bullish and CVD Turn Bearish when net CVD crosses zero.
Price Near POC proximity alert.
Best practices
Use a higher Anchor Timeframe to stabilize the CVD story and a sensible Profile Granularity so wings are readable without clutter.
Keep Split mode on when you want to separate initiative attribution. Turn it off when you prefer a single net profile.
Tune Pivot Left and Right by instrument to avoid overfitting. Larger values find swing divergences. Smaller values find micro fades.
If volume is thin or synthetic for the symbol, CVD will be less reliable. The script will warn if volume is zero.
Trading applications
Context - Confirm or question breakouts with CVD slope.
Location - Build entries at CVD nodes and POC.
Timing - Use divergence and POC crosses for triggers.
Risk - Place stops beyond the opposite wing or outside the POC shelf.
Important notes and limits
This is a price and volume based study. It does not access off-book or venue-level order flow.
CVD profiles are built from the data available on your chart and the chosen lower timeframe sampling.
Like all volume tools, readings can distort during roll periods, holidays, or feed anomalies. Validate on your instrument.
Technical notes
Delta is aggregated from a lower timeframe into an Anchor Timeframe narrative.
Profile bins update in real time. Splitting by side scales each wing independently so both are readable in the same panel.
Divergences are confirmed using standard pivot definitions with user-set tolerances.
All profile drawing uses fixed X offsets so panels and POC do not swim when you scroll.
Quick start
Anchor Timeframe = Daily for intraday context.
Split Buy and Sell CVD = On.
Profile Granularity = 100 to 200, Profile Position = Right, Width to taste.
Pivot Left and Right around 8 to 12 to start, then adapt.
Turn on Heatmap for a fast map of interest bands.
Bottom line
CVD tells you who is doing the lifting. The profile shows where they did it. Divergences tell you when effort stops paying. Put them together and you get a clear read on control, location, and timing for both trend and mean reversion.
Volumedelta

Cumulative Volume DeltaCumulative Volume Delta (CVD) Indicator
This indicator is a modification of the Trading View CVD indicator. Cumulative Volume Delta (CVD), which represents the net difference between up volume (volume traded as the price increases) and down volume (volume traded as the price decreases) over a chosen Anchor Period.
The data for the CVD calculation is requested using the built-in ta.requestVolumeDelta function from a lower timeframe to approximate the directional volume with greater precision. This lower timeframe is either automatically selected based on the chart's timeframe or can be customized by the user.
Key Features and Inputs
Anchor Period: Defines the period over which the volume delta is accumulated and plotted. The default is "1D" (Daily), but it can be changed to any higher timeframe (e.g., "1W" for Weekly) to analyze CVD across different cycles.
CVD Candle Plot: The calculated volume delta values are plotted as a custom candle, where:
The open and close of the CVD candle represent the volume delta at the start and end of the anchor period, respectively.
The high and low represent the maximum and minimum volume delta reached during that period.
Up/Down Coloring Logic: The color of the CVD candle is determined by the directional movement of the price during the anchor period, allowing traders to quickly correlate volume delta with price action. Users can select between two methods via the "Strong Up/Down Coloring" input:
Strong Up/Down (Default): The candle is colored bullish (Teal) if the current price closes above the previous bar's high or bearish (Red) if it closes below the previous bar's low. This logic highlights significant momentum.
Regular Up/Down: The candle is colored bullish (Teal) if the close is greater than the open (price moved up) or bearish (Red) if the close is less than the open (price moved down).
Lower Timeframe Selection: This determines the resolution of the up and down volume components.
By default, the script automatically selects an appropriate lower timeframe (e.g., "1" minute for intraday charts, "5" minutes for daily charts) to balance historical data availability with calculation precision.
An option is provided to customize this "Lower Timeframe" for advanced users seeking higher or lower resolution.
The CVD indicator is a powerful tool for analyzing order flow dynamics and assessing the genuine strength of price movements by comparing the aggregate buying pressure (up volume) against the selling pressure (down volume).
Technical Notes (Code Details)
Language: Pine Script® //@version=6.
Function: Utilizes the ta.requestVolumeDelta() function with a user-defined anchorInput (default "1D") and a determined lowerTimeframe to retrieve the relevant delta data: .
Error Handling: Includes a check to confirm the symbol provides volume data, preventing runtime errors.

Adaptive Volume Delta Map---
📊 Adaptive Volume Delta Map (AVDM)
What is Adaptive Volume Delta Map (AVDM)?
The Adaptive Volume Delta Map (AVDM) is a smart, multi-timeframe indicator that visualizes buy and sell volume imbalances directly on the chart.
It adapts automatically to the best available data resolution (tick, second, minute, or daily), allowing traders to analyze market activity with micro-level precision .
In addition to calculating volume delta (the difference between buying and selling pressure), AVDM can display a Volume Distribution Map — a per-price-level visualization showing how volume is split between buyers and sellers.
Key Features
✅ Adaptive Resolution Selection — Automatically chooses the highest possible data granularity — from tick to daily timeframe.
✅ Volume Delta Visualization — Displays delta candles reflecting the dominance of buyers (green), sellers (red), and delta (orange).
✅ Per-Level Volume Map (optional) — Shows detailed buy/sell volume distribution per price level, grouped by `Ticks Per Row`.
✅ Bid/Ask Classification — When enabled, AVDM uses bid/ask logic to classify trade direction with greater accuracy.
✅ Smart Auto-Disable Protection — Automatically disables volume map if too many price levels (>50) are detected — preventing performance degradation.
Inputs Overview
Use Seconds Resolution — Enables use of second-level data (if your TradingView subscription allows it).
Use Tick Resolution — Enables tick-based analysis for the most detailed view. If available, enable both tick and seconds resolution.
Use Bid/Ask Calculated — Uses bid/ask midpoint logic to classify trades.
Show Volume Distribution — Toggles per-price-level buy/sell volume visualization.
Ticks Per Row — Controls how many ticks are grouped per volume level. Reduce this value for finer detail, or increase it to reduce visual load.
Calculated Bars — Sets how many historical bars the indicator should process. Higher value increases accuracy but may impact performance.
How to Use
1. Add the indicator to your chart.
2. Ensure that your symbol provides volume data (and preferably tick or second-level data).
3. The indicator will automatically select the optimal timeframe for detailed calculation.
4. If your TradingView subscription allows second-level data , enable “Use Seconds Resolution.”
5. If your subscription allows tick-level data , enable both “Use Tick Resolution” and “Use Seconds Resolution.”
6. Adjust the “Calculated Bars” input to set how many historical bars the indicator should process.
7. Observe the Volume Delta Candles :
* Green = Buy pressure dominates
* Red = Sell pressure dominates
8. To see buy/sell clustering by price, enable “Show Volume Distribution.”
9. If the indicator disables the map and shows:
" Volume Distribution disabled: Too many price levels detected (>50). Try decreasing 'Ticks Per Row' or using a lower chart resolution. If you don’t care about the map, just turn off 'Show Volume Distribution'. "
— follow the instructions to reduce chart load.
Notes
* Automatically adapts to your chart’s resolution and data availability.
* If your symbol doesn’t provide volume data, a runtime warning will appear.
* Works best on futures , FX , and crypto instruments with high-frequency volume streams.
Why Traders Love It
AVDM combines adaptive resolution , volume delta analysis , and visual distribution mapping into one clean, efficient tool.
Perfect for traders studying:
* Market microstructure
* Aggressive vs. passive participation
* Volume absorption
* Order flow imbalance zones
* Delta-based divergence signals
Technical Highlights
* Built with Pine Script v6
* Adaptive resolution logic (`security_lower_tf`)
* Smart memory-safe map rendering
* Dynamic bid/ask classification
* Automatic overload protection
---

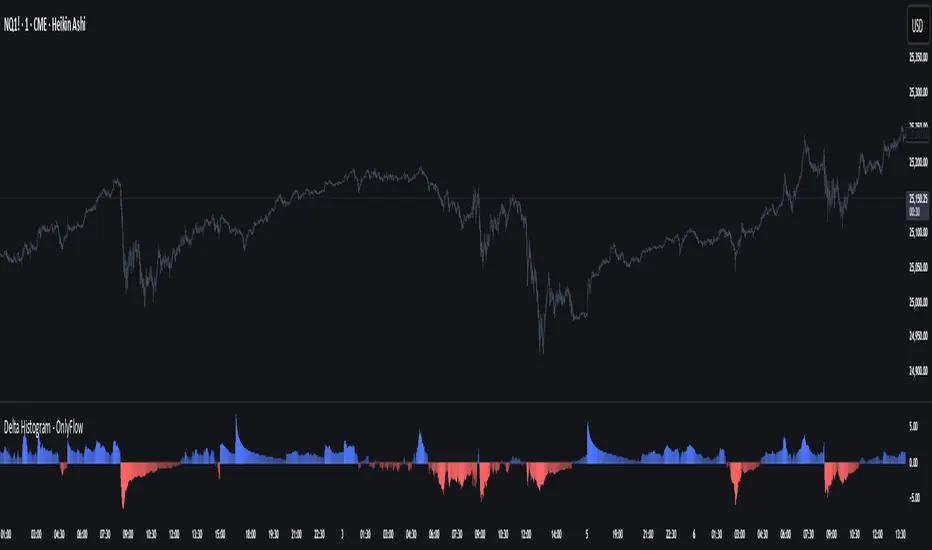
Delta Histogram - OnlyFlowThis script plots a histogram of delta proxies (approximations of buying vs. selling pressure) using available chart data. Because TradingView does not provide bid/ask tape data, delta is estimated with several selectable methods:
Uptick/Down-tick (proxy): volume signed by close direction.
Body-weighted Volume: weights volume by candle body relative to its range.
VWAP-slope Volume: signs volume by changes in the typical price (HLC3).
Features
Cumulative or per-bar mode: reset daily or by custom session hours.
Normalization options: Z-score, percentile scaling, or raw values; with percentile clipping for stable colors and axis scaling.
Visualization: color-coded positive/negative bars, optional zero line and ± bands, adjustable opacity scaling.
Readout Panel: shows the latest delta values and their normalized equivalents on the chart edge.
Alerts: triggers when normalized delta exceeds positive or negative thresholds, highlighting potential spikes in pressure.
Usage
Switch between delta modes to explore different perspectives on order-flow imbalance. Cumulative mode shows whether pressure builds over a session, while per-bar mode highlights bar-to-bar shifts. Normalization helps identify relative extremes in context rather than raw values.
CCI PKTELUGUTRADERThe Commodity Channel Index (CCI) is a momentum oscillator that helps traders identify potential buy and sell opportunities by measuring how far the price of a security deviates from its average price over a specific period. It’s widely used for spotting new trends, overbought and oversold conditions, and possible price reversals in various financial markets.
Description of CCI
The CCI calculates the difference between the current price and its historical average price, normalized by mean deviation. Unlike indicators such as RSI, the CCI is an unbounded oscillator, meaning its values can go above +100 or below -100, providing broader insights into momentum shifts in prices.
The formula for CCI is:
CCI
=
Typical Price
−
SMA of Typical Price
0.015
×
Mean Deviation
CCI=
0.015×Mean Deviation
Typical Price−SMA of Typical Price
where:
Typical Price = (High + Low + Close) / 3
SMA is the Simple Moving Average of the Typical Price over the chosen period
Mean Deviation is the average deviation from the SMA.
Buy and Sell Signals
A buy signal is typically generated when the CCI moves above +100, indicating the start of a strong uptrend.
A sell signal occurs when the CCI drops below -100, signaling a strong downtrend.
Many traders close their buy positions when the CCI falls back below +100 and close their sell positions when it rises above -100, or use price action confirmation to validate signals.
Values above +100 suggest overbought conditions, while below -100 indicate oversold; extreme values (like +200 or -200) suggest even stronger momentum.
CCI divergences (price moves not confirmed by the indicator) may indicate potential reversals.
Summary Table: CCI Signals
CCI Level Market Condition Potential Action
Above +100 Overbought/Uptrend Consider Buying
Below -100 Oversold/Downtrend Consider Selling
Back between -100 and +100 Neutral/Indecision Exit or Wait
The CCI is best used alongside other technical indicators for confirmation, as it can generate false signals during sideways markets.
References:
Guide to Commodity Channel Index
What Is CCI?
CCI Trading Strategies
CCI: Technical Indicator
Commodity channel index

Delta Volume Signals by Claudio [hapharmonic]Modifications:
Percentages without decimals.
I replaced the 'Current Volume' row with two boxes: "Δ Vol" and its value, which changes color depending on the direction of the bearish/bullish candle.
Signals can change color in the settings.
Box spacing so the table doesn't constantly change size.
To be modified:
The Net Volume sign shouldn't change to negative when the candle is red.
If anyone does this, let me know...
claudio.ventola@hotmail.com
Best regards!

Heatmap (Delta/Change) - ORDEROFTWOORDER OF TWO Premium Indicator
This Indicator helps to build an better edge for your overall BIAS.

Ober Trend Oscillator [by Oberlunar]The Ober Trend Oscillator by Oberlunar unifies a volume-weighted view of price with order-flow information in a single, disciplined signal. At its core is a Triple Hull Moving Average applied to the session VWAP. This pairing is intentional: the Hull family is widely used because its quadratic weighting and internal differencing reduce phase lag versus SMA/EMA while preserving a smooth, readable contour; running it on top of VWAP anchors the calculation to a price already “risk-weighted” by volume, which behaves in practice like a microstructural equilibrium level. Around VWAP, the indicator computes standard-deviation envelopes that provide statistical context; excursions to the far band against the prevailing direction often mark probabilistic excess and become the first checkpoint for signal qualification.
The order-flow module is built on a tick-rule Cumulative Volume Delta, the most robust choice when native bid/ask deltas are unavailable. Volumes are signed by up- or down-moves, cumulatively integrated, then smoothed by a configurable EMA. To make the series comparable across instruments and timeframes, the CVD is standardised via an adjustable z-score window. This normalisation matters because it reframes “push” and “exhaustion” as deviations from recent behaviour rather than absolute thresholds tied to each market’s idiosyncratic liquidity. When enabled, a pivot-based divergence engine searches for fresh local highs or lows in price that the CVD refuses to confirm and annotates the symbol Δ with the percentage size of the divergence on price, on CVD, or both. Quantifying divergence avoids binary, eye-ball readings and lets you compare the relative strength of signals over time.
Signal generation follows a two-stage logic. Stage one is regime detection by the THMA on VWAP. The slope of the long THMA defines the primary trend, while the instantaneous difference between the THMA and its own lag sets the “serpentine” colour that conveys the local direction of pressure. Using slope on the longer window is deliberate: trend-following practice shows that slope filters materially reduce false positives in choppy regimes. Stage two enforces contextual alignment between price and higher-timeframe VWAP bands. For a long, the THMA computed on the higher-timeframe VWAP must sit below the current curve and below the second lower deviation, consistent with either a mean-reverting excess or early re-accumulation; shorts are defined symmetrically. Volume-flow confirmation is then required through either a rising CVD, a supportive z-score, or a detected pivot divergence in the same direction. To discourage over-trading, signals alternate by design and a strict colour gate is applied: a green diamond is never printed on a red line and bullish divergences are not drawn when the serpentine indicates bearish pressure. This visual consistency is not cosmetic; it reduces cognitive dissonance between filters and execution signal and improves reading discipline.
Parameters are organised to make these choices explicit. The main THMA length controls the oscillator’s sensitivity to VWAP, while the “trend” and “long-term” lengths drive the slope filter, with the latter acting as the regime anchor. The higher timeframe used to compute THMA on VWAP is the context-alignment knob and enables true multi-period operation, which is essential in fractal markets such as crypto, FX and equity indices. The VWAP deviation multiplier sets the breadth of the statistical bands; values modestly below one are a deliberate default to keep excess detection sensitive without turning the envelopes into a very wide channel. The ATR window that drives the line’s thickness is not a visual gimmick: thickness adapts to volatility and communicates the movement’s energy at a glance, much like an adaptive envelope.
The CVD package offers full control. A dedicated timeframe lets you decouple order-flow estimation from the chart’s timeframe when a slower, more reliable read of pressure is preferred. The calculation mode can reference Close-to-Close for responsiveness or HL2 for slightly greater robustness to closing noise, depending on the instrument’s microstructure. EMA smoothing governs granularity, the slope lookback sets how many observations are required to validate an inflection, and the z-score length defines the statistical horizon for normalisation—longer windows make the signal steadier, shorter windows make it more tactical. The pivot divergence option with percentage sizing grades relevance rather than merely flagging presence. Measuring both the price change between pivots and the CVD change is intentional: the most actionable divergences exhibit not only directionally opposing shapes but also a quantitative mismatch between price and flow; putting the two numbers side by side clarifies whether price is outrunning flow or flow is reversing ahead of price.
On the attached weekly Bitcoin example, the turquoise serpentine highlights impulsive phases while red denotes retracement or distribution. Δ labels with “P:%” and “C:%” mark points where price sets a new extreme without a matching CVD extreme; the percentage annotation helps distinguish a trivial imbalance from a credible exhaustion. Diamonds appear only when their colour agrees with the serpentine, and their location relative to the higher-TF VWAP bands clarifies when the market stops pushing “with volume” and starts pushing “against volume”—often the operational cue that precedes mean reversion or a consolidation before the next impulse.
Three methodological choices deserve emphasis. The THMA-on-VWAP architecture addresses the classic lag-versus-noise trade-off by combining a low-lag smoother with a volume-anchored base series that reflects institutional execution practice. Z-scoring the CVD is consistent with a statistical reading of flow that reasons in deviations from expected behaviour rather than fixed thresholds, which is particularly relevant on assets with shifting liquidity regimes. Finally, the colour gate plus signal alternation mitigates the well-known clustering of false positives in sideways markets: you do not print green on red or red on green, and you do not fire the same direction twice in a row without an opposite transition, which avoids hammering into the same move.
Practical usage is straightforward. Select your trading timeframe and align context with a higher timeframe in the VWAP-THMA; tune the VWAP deviation multiplier to match the instrument’s excess profile; choose an equal or slower CVD timeframe to extract structural pressure; enable divergence sizing when you want to measure, not only see, the gap between price and flow. Signals can also be drawn on the main chart, so next to candles, you will see both the execution diamonds and Δ labels with their percentage sizes. If you work with higher-timeframe inputs via `request.security`, be aware that those series confirm only at their own close; you can require confirmation for both the higher-TF VWAP and CVD timeframes to eliminate any practical repaint. Integrated alerts tied to THMA+VWAP+CVD validation convert discretionary reading into a monitorable workflow consistent with systematic routines.
Known limitations are stated explicitly. Tick-rule CVD is an approximation and, while standard in the absence of native bid/ask deltas, it may diverge from “true” delta on venues with unusual execution dynamics; normalisation helps but does not eliminate this. Pivot divergences depend on swing definition and require sensitivity calibration to avoid over-signalling on erratic markets. By construction, the oscillator favours trending contexts with statistically motivated pullbacks; during prolonged congestion, signals will naturally thin out, and the standardised CVD becomes the primary discriminator.
In sum, the Ober Trend Oscillator is a dual-channel reader: the THMA-on-VWAP line tells you about regime and movement quality, and the normalised CVD tells you about the pressure sustaining that movement. When the two stories align, continuation probability improves; when they diverge, the Δ annotation quantifies the gap and offers an objective basis for judging whether you are seeing a healthy pause or an impending reversal. The integration of volume-weighted price, simple statistics, and order-flow makes the indicator genuinely multi-period, capable of scaling from intraday to swing without changing its visual language or its decision criteria.
Oberlunar 👁️⭐

Volume Bubbles & Liquidity Heatmap [LuxAlgo]The Volume Bubbles & Liquidity Heatmap indicator highlights volume and liquidity clearly and precisely with its volume bubbles and liquidity heat map, allowing to identify key price areas.
Customize the bubbles with different time frames and different display modes: total volume, buy and sell volume, or delta volume.
🔶 USAGE
The primary objective of this tool is to offer traders a straightforward method for analyzing volume on any selected timeframe.
By default, the tool displays buy and sell volume bubbles for the daily timeframe over the last 2,000 bars. Traders should be aware of the difference between the timeframe of the chart and that of the bubbles.
The tool also displays a liquidity heat map to help traders identify price areas where liquidity accumulates or is lacking.
🔹 Volume Bubbles
The bubbles have three possible display modes:
Total Volume: Displays the total volume of trades per bubble.
Buy & Sell Volume: Each bubble is divided into buy and sell volume.
Delta Volume: Displays the difference between buy and sell volume.
Each bubble represents the trading volume for a given period. By default, the timeframe for each bubble is set to daily, meaning each bubble represents the trading volume for each day.
The size of each bubble is proportional to the volume traded; a larger bubble indicates greater volume, while a smaller bubble indicates lower volume.
The color of each bubble indicates the dominant volume: green for buy volume and red for sell volume.
One of the tool's main goals is to facilitate simple, clear, multi-timeframe volume analysis.
The previous chart shows Delta Volume bubbles with various chart and bubble timeframe configurations.
To correctly visualize the bubbles, traders must ensure there is a sufficient number of bars per bubble. This is achieved by using a lower chart timeframe and a higher bubble timeframe.
As can be seen in the image above, the greater the difference between the chart and bubble timeframes, the better the visualization.
🔹 Liquidity Heatmap
The other main element of the tool is the liquidity heatmap. By default, it divides the chart into 25 different price areas and displays the accumulated trading volume on each.
The image above shows a 4-hour BTC chart displaying only the liquidity heatmap. Traders should be aware of these key price areas and observe how the price behaves in them, looking for possible opportunities to engage with the market.
The main parameters for controlling the heatmap on the settings panel are Rows and Cell Minimum Size. Rows modifies the number of horizontal price areas displayed, while Cell Minimum Size modifies the minimum size of each liquidity cell in each row.
As can be seen in the above BTC hourly chart, the cell size is 24 at the top and 168 at the bottom. The cells are smaller on top and bigger on the bottom.
The color of each cell reflects the liquidity size with a gradient; this reflects the total volume traded within each cell. The default colors are:
Red: larger liquidity
Yellow: medium liquidity
Blue: lower liquidity
🔹 Using Both Tools Together
This indicator provides the means to identify directional bias and market timing.
The main idea is that if buyers are strong, prices are likely to increase, and if sellers are strong, prices are likely to decrease. This gives us a directional bias for opening long or short positions. Then, we combine our directional bias with price rejection or acceptance of key liquidity levels to determine the timing of opening or closing our positions.
Now, let's review some charts.
This first chart is BTC 1H with Delta Weekly Bubbles. Delta Bubbles measure the difference between buy and sell volume, so we can easily see which group is dominant (buyers or sellers) and how strong they are in any given week. This, along with the key price areas displayed by the Liquidity Heatmap, can help us navigate the markets.
We divided market behavior into seven groups, and each group has several bubbles, numbered from 1 to 17.
Bubbles 1, 2, and 3: After strong buyers market consolidates with positive delta, prices move up next week.
Bubbles 3, 4, and 5: Strength changes from buyers to sellers. Next week, prices go down.
Bubbles 6 and 7: The market trades at higher prices, but with negative delta. Next week, prices go down.
Bubbles 7, 8, and 9: Strength changes from sellers to buyers. Next weeks (9 and 10), prices go up.
Bubbles 10, 11, and 12: After strong buyers prices trade higher with a negative delta. Next weeks (12 and 13) prices go down.
Bubbles 12, 14, and 15: Strength changes from sellers to buyers; next week, prices increase.
Bubbles 15 and 16: The market trades higher with a very small positive delta; next week, prices go down.
Current bubble/week 17 is not yet finished. Right now, it is trading lower, but with a smaller negative delta than last week. This may signal that sellers are losing strength and that a potential reversal will follow, with prices trading higher.
This is the same BTC 1H chart, but with price rejections from key liquidity areas acting as strong price barriers.
When prices reach a key area with strong liquidity and are rejected, it signals a good time to take action.
By observing price behavior at certain key price levels, we can improve our timing for entering or exiting the markets.
🔶 DETAILS
🔹 Bubbles Display
From the settings panel, traders can configure the bubbles with four main parameters: Mode, Timeframe, Size%, and Shape.
The image above shows five-minute BTC charts with execution over the last 3,500 bars, different display modes, a daily timeframe, 100% size, and shape one.
The Size % parameter controls the overall size of the bubbles, while the Shape parameter controls their vertical growth.
Since the chart has two scales, one for time and one for price, traders can use the Shape parameter to make the bubbles round.
The chart above shows the same bubbles with different size and shape parameters.
You can also customize data labels and timeframe separators from the settings panel.
🔶 SETTINGS
Execute on last X bars: Number of bars for indicator execution
🔹 Bubbles
Display Bubbles: Enable/Disable volume bubbles.
Bubble Mode: Select from the following options: total volume, buy and sell volume, or the delta between buy and sell volume.
Bubble Timeframe: Select the timeframe for which the bubbles will be displayed.
Bubble Size %: Select the size of the bubbles as a percentage.
Bubble Shape: Select the shape of the bubbles. The larger the number, the more vertical the bubbles will be stretched.
🔹 Labels
Display Labels: Enable/Disable data labels, select size and location.
🔹 Separators
Display Separators: Enable/Disable timeframe separators and select color.
🔹 Liquidity Heatmap
Display Heatmap: Enable/Disable liquidity heatmap.
Heatmap Rows: select number of rows to be displayed.
Cell Minimum Size: Select the minimum size for each cell in each row.
Colors.
🔹 Style
Buy & Sell Volume Colors.

Volume Pressure Arrows[Blk0ut]Volume Pressure Arrows are an innovative (I think) market pressure tool designed to cut through noise and provide traders with a realistic, but quick insight into buying vs selling pressure and which has real control. Rather than relying on any single classic indicator, this script blends five complementary measures of price–volume dynamics—Cumulative Volume Delta (CVD), VWAP distance, OBV slope, ATR expansion, and the DMI ratio—into a unified “pressure score.”
Each component is normalized, weighted, and combined into a single metric that can be read at a glance through intuitive up and down arrows plotted directly on the chart. By transforming multiple complex data streams into a single aggregated signal, Volume Pressure Arrows help traders answer some of the hardest questions we can face: is the current move backed by conviction? is there true momentum? Is price action about to reverse?
Why It’s Different
Traditional oscillators often create conflicting signals, forcing traders to guess which one to trust. This indicator integrates five perspectives on volume and momentum pressure into a single framework, balancing raw flow (CVD), relative positioning (VWAP), trend conviction (OBV slope), volatility expansion (ATR), and directional bias (DMI). The result is a weighted, probability-minded score capped between -100 and +100 for consistency and clarity.
Important note : Inspiration for the use of directly plotted arrows came from dgtrd "https://www.tradingview.com/u/dgtrd/" and their brilliant work on LazyBear's Squeeze Indicator "https://www.tradingview.com/script/Dsr7B2xE-Squeeze-Momentum-Indicator-LazyBear-vX-by-DGT/"
How to Read It
Bullish Arrows appear below the candles when the pressure score pushes above the neutral threshold, signaling meaningful buyer dominance.
Bearish Arrows appear above the candles when pressure drops below the negative threshold, indicating strong selling pressure.
Neutral Arrows (smaller, faded) mark conditions where pressure exists but is not decisive—useful for spotting early rotations or fading momentum.
Color Gradients dynamically adjust with score intensity, making stronger signals visually brighter and weaker ones softer.
How to Use It Effectively
This tool is best applied as a confirmation and timing layer. It is not meant to replace your core strategy, but to validate whether momentum pressure supports your trade thesis.
Combine with trendlines, chart patterns, or breakouts to gauge conviction.
Use bullish or bearish arrows as filters, only take trades when price action aligns with strong directional pressure.
Watch neutral arrows near key levels; they often foreshadow balance breaking into directional moves.
Adjust the weightings to emphasize the components that matter most to your style (e.g., more weight on CVD for scalpers, or ATR expansion for volatility traders).
As with any indicator, this is not a magic ball and does not guarantee success. But it does allow you to increase the probability odds to your favor if you align it with your edge. Happy trading!

DeltaFlow Volume Profile [BigBeluga]🔵 OVERVIEW
The DeltaFlow Volume Profile builds a compact volume profile next to price and enriches every bin with flow context : bullish vs. bearish participation (%), a per-bin Delta % , an optional Delta Heat Map , and a PoC band with the bin’s absolute volume. This lets you see not just where volume clustered, but who (buyers or sellers) dominated inside each price slice.
🔵 CONCEPTS
Binned Volume Profile : Price range over a user-defined LookBack is split into Bins ; each bin aggregates traded volume.
Bull/Bear Split : Within every bin, volume is separated by candle direction into Bull Volume and Bear Volume , then normalized to % of the bin’s displayed size.
Delta % : The difference between Bull % and Bear % for the bin. Positive = buyer dominance; negative = seller dominance.
Delta Heat Map : Bin background shading that scales with both total volume strength and delta bias.
PoC (Point of Control) : The most significant bin gets a PoC band and a label with its absolute volume.
🔵 FEATURES
Profile with Flow : A clean horizontal volume bar per bin plus stacked Bull % and Bear % .
Per-Bin Delta Label : A readable “Δ xx%” tag at the start of each bin shows dominance at a glance.
Delta Heat Map : Optional gradient that intensifies with higher volume and stronger delta.
PoC Highlight : Optional PoC band colored separately, labeled with absolute volume (e.g., “1.23M”).
Configurable Inputs : LookBack, number of Bins (10–100), toggles for Delta, Heat Map, Volume Bars, and PoC color.
Readable Colors : Separate inputs for bullish (volume +) and bearish (volume –) hues.
🔵 HOW TO USE
Set the window : Choose LookBack and Bins to balance detail vs. performance (more bins = finer resolution).
Enable “Volume Bars” to display the bull/bear split as two stacked percent bars inside each bin.
High Bull % near support → constructive demand.
High Bear % near resistance → active supply.
Use Δ labels (toggle “Delta”) to quickly spot bins with clear buyer/seller control; combine with price position for confluence.
Turn on Delta Heat Map to prioritize areas with both large volume and strong imbalance.
Watch the PoC : The PoC band marks the most traded (and often magnet) level; its label shows absolute size for context.
Trade ideas :
Breakout continuation when Δ stays positive across consecutive upper bins.
Reversion risk when price enters a large bearish-Δ cluster below.
Manage risk around the PoC; reactions there can be sharp.
🔵 CONCLUSION
DeltaFlow Volume Profile upgrades a classic profile with flow intelligence. The bull/bear split, explicit Δ %, heat-weighted backdrop, and PoC volume label make dominant participation and key price shelves obvious. Use it to filter levels, time entries with imbalance, and validate breakouts or fades with objective volume-flow evidence.

CVD ema filtered 3.0This indicator is based on CVD Cumulative Volume Delta.
In this version the lines stop after a certain number of touches.
You can also choose the color for the bullish and bearish lines.

Net Positions (Net Longs & Net Shorts) - Volume AdjustedNet Positions (Net Longs & Net Shorts) - Volume Adjusted
Based on the legendary LeviathanCapital - Net Positions Indicator
Adjusted to use volume calculation for more percise data
Few important caveats:
- EVERY BUYER NEED A SELLER AND EVERY SELLER NEED A BUYER
- This indicator is meant to give you a sense of direction for the market orders ("who is the aggresive side") and should be used as confluence not as true values
In reality, in market movement each candle will contain both buying and selling, contracts closing and opening but due to some limitations that is hard to make properly.
Even with these limitations this indicator can provide a better picture than some other even external tools out there.
The main benefit of using volume delta and open interest instead of just open interest and candle closes G/R that it solves the problem with extreme cases where there might be an absorption of market orders.
Example of the Volume Edge in Action:
Bullish Absorption (The "Trap" for Sellers)
Candle Close + OI: A large Red Candle forms with Rising OI. The interpretation is simply: "New shorts are opening"
Volume Delta + OI: The same Red Candle with Rising OI has a Positive Volume Delta.
The True Story: Aggressive buyers tried to push the price up, but they were completely absorbed by large passive sell orders.
The "Volume Delta" logic:
If OI ↑ → new positions opened
• Delta ↑ → net longs added
• Delta ↓ → net shorts added
If OI ↓ → positions closed
• Delta ↑ → shorts closing
• Delta ↓ → longs closing
The "Price" logic:
If OI ↑ → new positions opened
• Price ↑ → net longs added
• Price ↓ → net shorts added
If OI ↓ → positions closed
• Price ↑ → shorts closing
• Price ↓ → longs closing

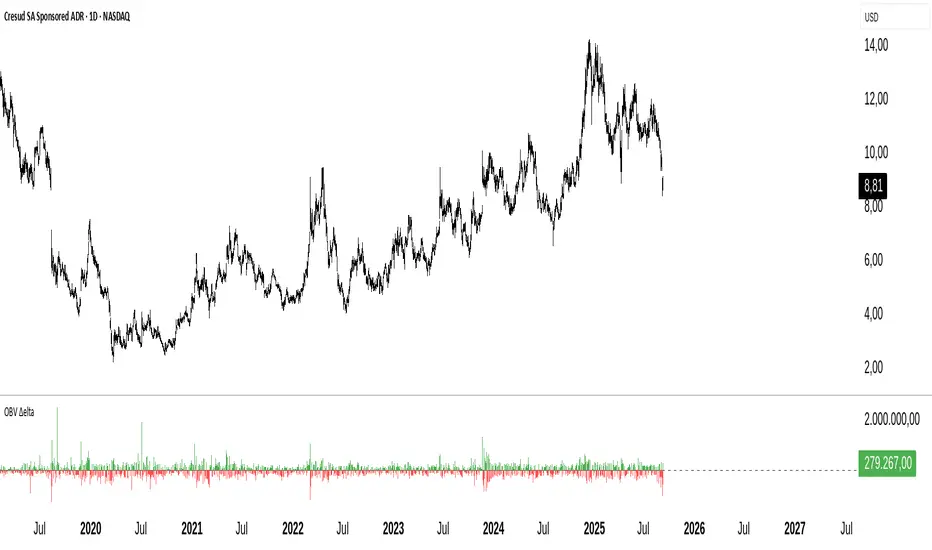
OBV Delta SimpleDelta OBV is a variant of the classic On Balance Volume (OBV).
While OBV accumulates volume flow over time, Delta OBV measures the bar-to-bar variation of OBV, showing the net momentum of buying or selling volume pressure in each period.
🔹 Interpretation:
Positive values → volume flow associated with buying pressure
Negative values → volume flow associated with selling pressure
Magnitude reflects the intensity of volume imbalance
🔹 Common uses:
Confirm trends when price advances with Delta OBV moving in the same direction
Detect divergences between price and volume (alert for potential reversals)
Identify accumulation or distribution peaks
In summary: Delta OBV converts OBV into a dynamic oscillator, more sensitive and direct for visualizing volume pressure in the short term.
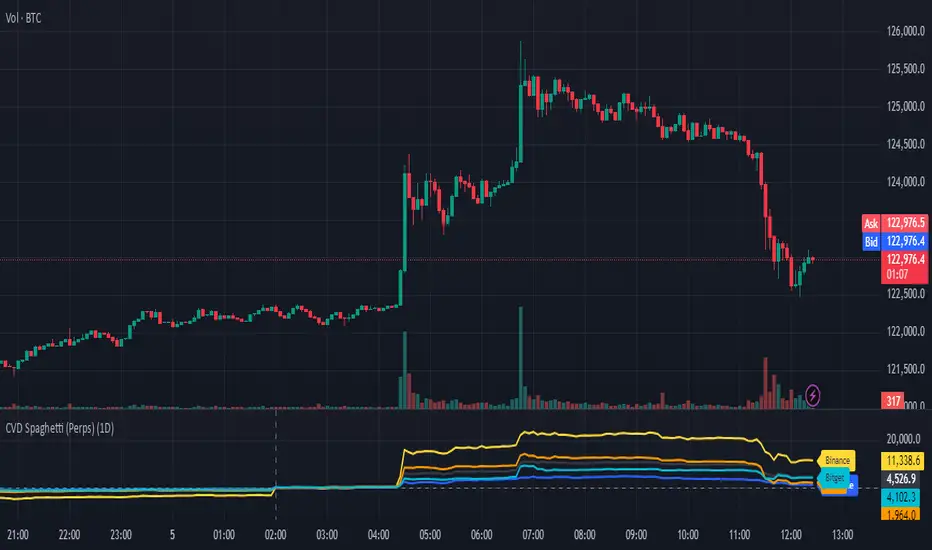
CVD Spaghetti - Multi-Exchange (Perpetuals)CVD Spaghetti – Multi-Exchange (Perpetuals) is designed to track and visualize Cumulative Volume Delta (CVD) across multiple cryptocurrency perpetual futures exchanges in one consolidated view. This indicator provides traders with a clearer perspective on buying and selling pressure by monitoring how order flow develops on different venues simultaneously.
What it does
The script calculates the CVD for each enabled exchange and plots them as separate lines on a single chart, creating a “spaghetti” style visualization. This allows traders to identify relative strength or weakness between major exchanges, which can often hint at institutional positioning, liquidity shifts, and potential market imbalances.
Why it’s useful
Order flow and liquidity dynamics can differ significantly between exchanges. By aggregating and comparing these flows, traders can:
Detect which venue is leading during trend development.
Spot divergences between exchanges, which may indicate inefficiencies or arbitrage-driven movements.
Gauge overall sentiment strength by comparing multiple sources instead of relying on a single dataset.
Technical details
Anchor Period Reset: The cumulative calculation resets based on the user-defined Anchor Period (default: daily), keeping data relevant for the chosen trading horizon.
Dynamic Resolution: The script automatically selects an appropriate lower timeframe for data requests based on the chart timeframe to maintain responsiveness and accuracy.
Normalization: Not all exchanges report volume in the same way—some use quote currency (USD), others in contracts or ticks. To ensure comparability, this indicator normalizes volumes where necessary:
Bybit USD and OKX contracts are divided by price to approximate base-coin terms.
Single-contract venues (e.g., Deribit) are normalized similarly.
Exchanges already reporting in the base currency remain unchanged.
Multi-Exchange Coverage: Supports major venues including Binance, Bybit, OKX, Bitget, Coinbase, and optional secondary exchanges like Blofin, Whitebit, and Deribit.
Visual Aids:
Zero baseline for directional reference.
Vertical session markers at each reset point.
Optional exchange labels positioned dynamically on the last bar for quick identification.
How traders might use it
Trend confirmation: Strong synchronized CVD across all major exchanges supports continuation; fragmentation may suggest weakening conviction.
Cross-exchange divergence: When one exchange’s CVD diverges from others, it can signal localized liquidity shocks or large player activity.
High-frequency strategies: On lower timeframes, the spaghetti view can highlight which venue is absorbing or providing liquidity fastest, aiding short-term decision-making.
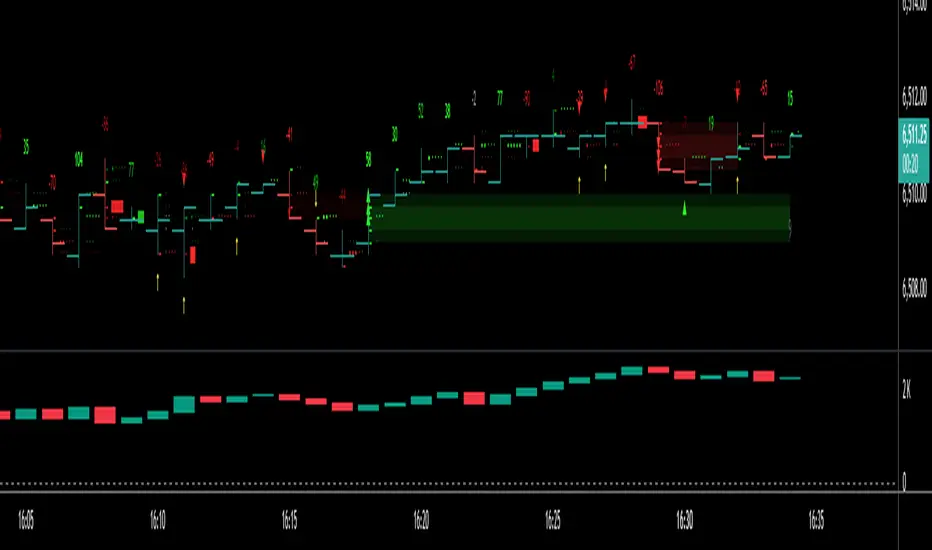
Footprint RealtimeFootprint Complete
A professional footprint-style order flow tool designed for serious traders who want deep insight into bid/ask dynamics, delta distribution, and imbalance detection directly on their TradingView charts.
🔑 Key Features
Footprint Wick Histogram
Visualize volume per tick with customizable block characters, scaled automatically (or via custom Vmax) for precision clarity.
Bid vs Ask Numbers (BvA)
Overlay raw bid/ask volume directly on each level of the candle wick for a true order-flow perspective.
Delta-Based Color Gradient
Adaptive coloring highlights strong buying/selling pressure. Includes neutral band and gamma curve control for fine-tuned intensity.
Diagonal Imbalance Detection
Spot aggressive buyers/sellers instantly. Highlights appear as transparent color fills, tiny horizontal markers, or both. Adjustable ratio thresholds, brightness, and transparency.
Imbalance Triangles
3-in-a-row IB triangles (▲/▼) signal stacked imbalance zones.
Edge Triangles mark traps at bar extremes (top/bottom).
Contrarian Delta Triangles detect divergences (e.g., red candle with positive delta).
Transparent IB Zones
Extend imbalance zones dynamically to the right until price retests their edge. Adjustable opacity, extension length, and minimum hold time.
Total Delta Label
Shows cumulative delta above each bar’s wick, with automatic color coding.
Customizable Everything
Colors, intensity curves, line characters, offsets, label transparency, and more — tailor the script to your personal trading style.
🎯 Benefits
Identify hidden absorption and aggressive imbalances.
Anticipate breakout traps and exhaustion zones.
Confirm order-flow bias with delta overlays.
Gain institutional-level insights without leaving TradingView.
This script combines multiple order flow concepts into one highly optimized package — giving you the footprint, imbalance, and delta context you need for sharper trading decisions.
4H Rejection + 2x15m Delta StrategyThis strategy uses rejections levels on different timeframes (you can change this in the settings) to identify the possibility of a price reaction or movement in the opposite side and potentially getting involved.
The confirmation for an entry signal is the volume and specifically the total delta of the candles after tabbing the rejection level on that specific time frame.
The delta has to show 2 positive candles for a buy at a support level, or 2 negative candles for a sell at a resistance level.
The strategy is quite flexible as it gives you the chance to adjust a lot of the things within the settings.
You can play around with the time frames in which you want to get your confirmation for the signal, as well as choosing which time frame you want the strategy to draw your rejection levels in.
Note: This strategy may show profitable results in the backtest/strategy tester but still not 100% guaranteed. Therefore, you need to do your own research on the market and the included strategy for better results.

Rapid Cumulative Delta Proxy (Close vs Close)Rapid Cumulative Delta Proxy (Close vs Close)
1. Summary
This indicator provides a powerful proxy for Cumulative Delta , offering insight into the buying and selling pressure within each candle without requiring access to specialized tick data. It works by analyzing a Lower Timeframe (LTF) of your choice and accumulating the volume based on simple price changes, then displaying the results in a clean, customizable "footprint-style" table on your main chart.
This tool is designed for traders who want to understand the underlying order flow dynamics and see whether buyers or sellers were more aggressive during the formation of a candle.
2. Key Features
Cumulative Delta Proxy: Calculates delta by comparing the close of each LTF bar to the previous one, assigning volume to either buyers or sellers.
Lower Timeframe Analysis: Gives you the flexibility to choose any LTF (e.g., 1-minute, 5-minute, or even seconds) to build your delta analysis, allowing for granular or broad views.
Historical "Footprint" Table: Displays data for the current, developing bar as well as a user-defined number of previous bars, allowing for immediate historical context.
Live Data Monitoring: The top row of the table always shows the real-time, developing values for the current bar.
Full Visual Customization: Provides extensive options to control the table's position, colors, and text styles to perfectly match your chart's theme.
3. Calculation Mechanism
The logic of this indicator is straightforward and transparent. For every single bar on your main (Higher Timeframe) chart, the script performs the following steps:
Data Collection: The script uses the request.security_lower_tf() function to gather all the close and volume data from the user-specified Lower Timeframe that falls within the current HTF bar.
Volume Allocation: It then iterates through each of these LTF bars to determine if it represented buying or selling pressure.
If an LTF bar's close is greater than the close of the previous LTF bar, its entire volume is added to a running total of Buy Volume.
If an LTF bar's close is less than the close of the previous LTF bar, its volume is added to a running total of Sell Volume.
If the closes are identical, the volume is considered neutral and is ignored.
Final Calculations: Once all the LTF bars have been processed, the final metrics for that single HTF bar are calculated:
Delta: This is the net difference between the accumulated volumes. The formula is:
Delta=TotalBuyVolume−TotalSellVolume
Imbalance %: This shows the percentage dominance of buyers or sellers relative to the total activity. The formula is:
Imbalance%= Delta / (TotalBuyVolume+TotalSellVolume) ×100
This entire process repeats for each bar on your chart, with the results stored and displayed in the historical table.
4. Settings Explained
Lower Timeframe: The most important setting. This is the timeframe the script will analyze to calculate delta. It must be a lower interval than your main chart's timeframe.
History Bar Count: Controls how many previous, closed bars of data are displayed in the table below the "Live" bar.
Table Visuals (Group):
Header Colors: Customize the text color for each column header (Buy, Sell, Delta, Imbalance).
Background Colors: Set the colors used for the conditional backgrounds on the Delta and Imbalance columns (Positive, Negative, and Neutral values).
Data Text Style: Control the color and size of all standard text in the table. Placed on one line for convenience.
Table Position: A dropdown menu to place the table in any of nine positions on your chart.
5. Trading Concepts & Examples
This is where the Delta Table truly shines. By comparing the delta data (the "Effort") with the candle on your chart (the "Result"), you can gain powerful insights.
A. Effort vs. Result Analysis
This concept helps you determine if the trading activity is actually succeeding in moving the price.
Confirmation:
High positive delta on a large green candle that closes strong. This confirms the buying pressure was effective and the trend is likely to continue.
High negative delta on a large red candle that closes weak. This confirms the selling pressure was effective.
Divergence (Sign of Reversal):
Absorption: You see very high positive delta, but the candle on the chart is small, with a long upper wick (a shooting star). This is a major warning sign. It means buyers exerted massive effort, but the result was poor because a large seller absorbed all their buying, preventing the price from rising. This often precedes a move down.
Exhaustion: You see very high negative delta, but the candle is small with a long lower wick (a hammer). This means sellers tried their best to push the price down but failed. Their effort was met with strong buying pressure, signaling selling exhaustion and a potential bottom.
B. Identifying Traps (Two-Bar Analysis)
Traps occur when a breakout or breakdown fails, catching traders on the wrong side of the market. The Delta Table makes these easy to spot.
Example of a Bull Trap:
The Bait (Bar 1): A strong green candle breaks above a key resistance level. You look at the table and see a strong positive delta, convincing traders to go long.
The Trap (Bar 2): The very next candle is a powerful red candle that closes back below the resistance level. Now, check the table for this candle—you will often see an equally strong or even stronger negative delta.
Interpretation: The initial breakout buyers are now "trapped." The aggressive negative delta on the second bar confirms that sellers have taken control, and the trapped longs will be forced to sell, fueling a sharper decline.
Example of a Bear Trap:
The Bait (Bar 1): A strong red candle breaks below a key support level, showing a strong negative delta in the table. Traders are convinced to go short.
The Trap (Bar 2): The next candle is a powerful green candle closing back above support, accompanied by a very strong positive delta.
Interpretation: The breakdown has failed. Aggressive buyers have stepped in, "trapping" the short-sellers who must now buy back their positions, adding fuel to the rally.
6. Important Notes
Repainting: This indicator does not repaint. Once a bar on your main chart closes, its calculated values in the historical table are fixed and will not change. The "Live" data row updates in real-time as the current bar forms, which is the intended and expected behavior.
1-Second Timeframe: The script allows for using second-based intervals (e.g., "1S"). Please be aware that access to second-based timeframes on TradingView requires a Premium subscription. If you do not have one, please use a minute-based interval (e.g., "1").
Historic Bars: The script can accommodate large range, does not have any max bar limit. Please be aware that large table will require heavy computing power.
7. Disclaimer
The information provided by this indicator is for educational and informational purposes only and does not constitute financial advice. All trading and investment decisions are your own and should be made with the help of a qualified financial professional. Trading financial markets involves substantial risk, and past performance is not indicative of future results. The author is not responsible for any losses you may incur as a result of using this script.

Cumulative Volume Delta Candles Aggregated (Lite)Cumulative Volume Delta Candles Aggregated (Lite)
Multi-Exchange CVD Visualization in Candle Format
This indicator provides an aggregated Cumulative Volume Delta (CVD) view across multiple major perpetual futures exchanges in one chart. It is designed for traders who want a broader perspective on buying and selling pressure without switching between multiple charts or relying on a single exchange feed.
What It Does
Combines volume delta data from Binance, Bybit, OKX, Bitget, and Coinbase into a unified representation.
Displays CVD as candlesticks, where each candle reflects the open, high, low, and close of cumulative delta for the selected period.
Offers a clear visual of how buying and selling pressure evolves across markets in a structured, familiar candle format.
Key Features
✔ Exchange Aggregation: Incorporates data from several top futures markets available on TradingView.
✔ Anchor Reset: Allows you to set an anchor timeframe (e.g., daily) to reset cumulative values for better readability and analysis.
✔ Unit Normalization: Since exchanges report volumes in different units, the indicator normalizes all data and outputs values denominated in the base currency (coins) for consistency.
✔ Hidden OHLC Outputs: Provides open, high, low, and close values as hidden plots for use with other indicators or strategies.
✔ Lightweight Design: Optimized for efficiency while handling multiple real-time data requests.
Why It’s Different
Unlike standard single-exchange CVD tools, this indicator aggregates the majority of perpetual volume data available on TradingView, offering a more representative view of market sentiment. The candle-based representation of CVD introduces an additional layer of structure, helping traders identify shifts in momentum and pressure with more context than a simple cumulative line.
Use Cases
- Spotting aggregated buy/sell pressure trends across multiple exchanges.
- Confirming breakout or reversal signals with broader volume delta context.
- Serving as a custom data source for other indicators or algorithmic strategies.

Shark EfficiencyShock! Indicator — Description
This indicator measures how efficient or inefficient each candle is compared to recent volatility. It uses two calculations:
Residual (R):
Compares the actual candle return to what would be expected based on an exponential weighted moving average (EWMA) of intraday variance.
Positive residuals mean the candle moved farther than expected (inefficient); negative residuals mean the move was smaller or more controlled (efficient).
Histogram (H):
Compares realized variance (RV) of recent candles to bipower variation (BV), which estimates what volatility should be if there were no large jumps.
A large positive histogram value means the candle was an inefficient “jump” relative to normal volatility.
A negative histogram value means the candle was efficient, moving in line with expected variance.
Both Residual and Histogram are plotted bar-by-bar, with green bars showing efficient moves and red bars showing inefficient moves.
How to read it:
Efficient bullish candle: Price closed up, Residual < 0, Histogram < 0.
Efficient bearish candle: Price closed down, Residual < 0, Histogram < 0.
Inefficient bullish candle: Price closed up, Residual > 0, Histogram > 0.
Inefficient bearish candle: Price closed down, Residual > 0, Histogram > 0.
This lets you see not just whether price moved, but whether that move was efficient (controlled, sustainable) or inefficient (overextended, unsustainable).
Inputs:
alpha sets the percentile for efficiency thresholds (default 0.10 = 10/90 bands).
lambda controls the decay speed of the EWMA used to smooth variance.
winCov sets the lookback window for realized/bipower variance.
shockLen and jumpLen control how many bars are used in the “shock” and “jump” tests.
Usage:
Inefficient spikes (large positive Residual + Histogram) often mark exhaustion or blowoff moves.
Efficient shifts in the opposite direction can confirm reversals.
The tool is designed for intraday trading, especially in futures and indices, to spot when price is moving in line with liquidity versus when it is stretched and vulnerable.

Bulls vs Bears % TableBulls vs Bears % Box
What it does
Shows a compact on-chart box with the percentage of volume attributed to Bulls vs Bears over a window you choose. It’s a fast market-internals glance to gauge who’s in control right now.
What’s original/useful
Configurable inference: choose how “bull/bear” is defined (Tick-Rule, Candle Body, Heikin-Ashi Body, or VWAP comparison).
Flexible windowing: Session (RTH) reset or Rolling N bars—match your intraday workflow.
Clean UI: tiny table with custom colors and nine anchor placements; designed to overlay any layout without clutter.
How it works (simple)
For each bar, the script infers direction with one of four rules and assigns that bar’s volume to Bulls or Bears:
Tick-Rule (close vs previous close) – responsive in chop (default).
Body (close vs open) – classic candle color approach.
Heikin-Ashi Body – smoother trend read using HA open/close.
VWAP (close vs VWAP) – bull if the bar closes above VWAP, bear if below.
Optional: doji split 50/50. The box displays the Bull % and Bear % of the accumulated window.
Settings
Window: Session (RTH) with editable hours/days, or Rolling N bars.
Direction Rule: Tick-Rule, Body, Heikin-Ashi Body, or VWAP.
Doji Handling: Split doji volume 50/50 (on/off).
Placement: 9 anchors (Top/Middle/Bottom × Left/Center/Right).
Colors: Header, background, border, and dominant/sub text colors for Bulls/Bears.
How to read it
Bulls % > Bears % → buyer dominance; continuation more likely.
Bears % > Bulls % → seller dominance; watch for rallies to fail.
Extreme imbalance (e.g., >60–70% one side) → strong push but also pullback risk as the move matures.
Limitations & transparency
Uses volume-based inference, not true bid/ask delta (TradingView does not expose tape-level buy/sell splits).
Results vary by rule/window; pick one and stay consistent for your playbook.
No forward-looking data; no lookahead is used. This is not a signal generator or a strategy.
Best practices
Index futures/indices intraday: Session (RTH) + Tick-Rule is a solid default.
Trend days: try Heikin-Ashi Body for smoother dominance.
Mean-reversion: watch for extremes reverting toward balance.
No external code reused.

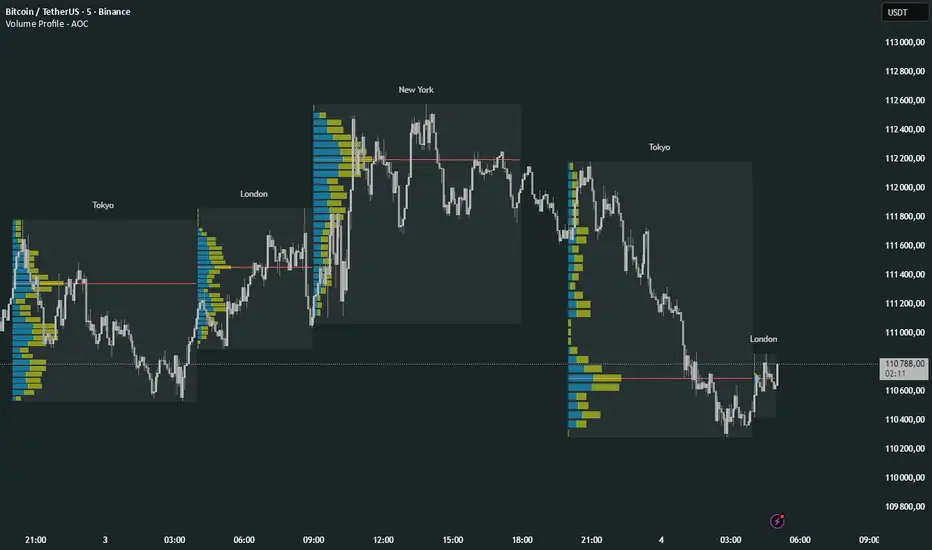
Volume Profile Multi periodVolume Profile - AOC 📈
Unlock market insights with this powerful volume profile indicator! Analyze trading activity across multiple sessions with customizable settings and clear visuals. Perfect for traders aiming to identify key price levels and market trends with precision. 🚀
Key Features:
Multi-Session Support: Visualize volume profiles for Tokyo, London, New York, Daily, Weekly, Monthly, Quarterly, and Semiannual sessions. 🌍
Customizable Display: Choose session types, resolution, and bar modes (Mode 1 or Mode 2) to match your strategy. 🎛️
Point of Control (POC): Highlights the most traded price levels for each session. 🎯
Color-Coded Profiles: Distinct up/down volume visualization for quick analysis. 📊
Session Labels: Optional labels for easy identification of session periods. 🏷️
High/Low Tracking: Tracks session-specific highs and lows for accurate profiling. 📏
Empower your trading decisions with clear, actionable volume data! 💡
Volume by Time [LuxAlgo]The Volume by Time indicator collects volume data for every point in time over the day and displays the average volume of the specific dataset collected at each respective bar.
The indicator overlays the current volume and the historical average to allow for better comparisons.
🔶 USAGE
Throughout the day, the volume of every bar is stored in groups organized by the time when each bar occurred.
Over time, the datasets accumulate, and from that, we can simply determine the average value at each specific time of the day.
The display is a histogram style, which consists of hollow bars and solid filled columns.
-Hollow bars represent the average volume at that time of the day.
-Solid columns display the current volume from the current bar.
By default, the entire history of data is used, but if desired, the number of days under analysis can be specified to provide a more relevant point of view.
A readout of the number of days being analyzed can be seen in the status bar at any time.
Note: Due to partial sessions, it is typical to see this value change throughout the day; this is simply due to the fact that not every trading session has the exact same schedule 100% of the time.
The analysis type can also be specified; these can be either Average (Default) or Median.
Additionally, a Bi-directional can be toggled for a distinct difference between upwards volume and downwards volume.
🔶 SETTINGS
Analysis Type: Choose between Average or Median analysis modes.
Length (Days): Set the number of days to use for analysis. Set to 0 for full data (Default 0).
Bi-Directional Toggle: Toggle between one-sided or two-sided display.
