Crack_RSI_Cloud_Ver_1.0.0
(주식/Stocks) 삼성전자 Samsung Electronics
(선물/Futures) 나스닥 NASDAQ
(코인/Cryptocurrency) 비트코인 BTCKRW
Hello my dear traders.
My team has recently developed a technical indicator that surprises ourselves every time we observe a price action caused by this very indicator.
Relative Strength Index has been developed by a scholar named Welles Wilder. Just like me, he turned himself into a technical analyst from a mechanical engineer after realizing how powerful and beautiful technical analysis is. As most of you know, RSI is a technical indicator that measures and visualizes the strength of bulls or bears objectively, in a percentage unit. This index, which oscillates between 0~100, is useful when identifying the general trend of the market
Here is the equation that computes RSI.
RSI(%) = (Average of Upward Price Change within N /( Average of Upward Price Change within N + Average of Downward Price Change within N))*100
* N = Time period/length or the number of candlesticks that are being considered
RSI is one of the most popular indicators used by daily traders these days. However, since default setting of the RSI only considers the closed price of candles, many limitations and weak points have been spotted recently. Since current financial market (such as crypto, stocks, futures, and forex) is heavily volatile and unstable, candle’s tails are not being considered properly on RSI (and also any other indicators that are computed using closed price).
To handle this problem, our team has worked very hard to achieve applying candle’s tails on our indicators.
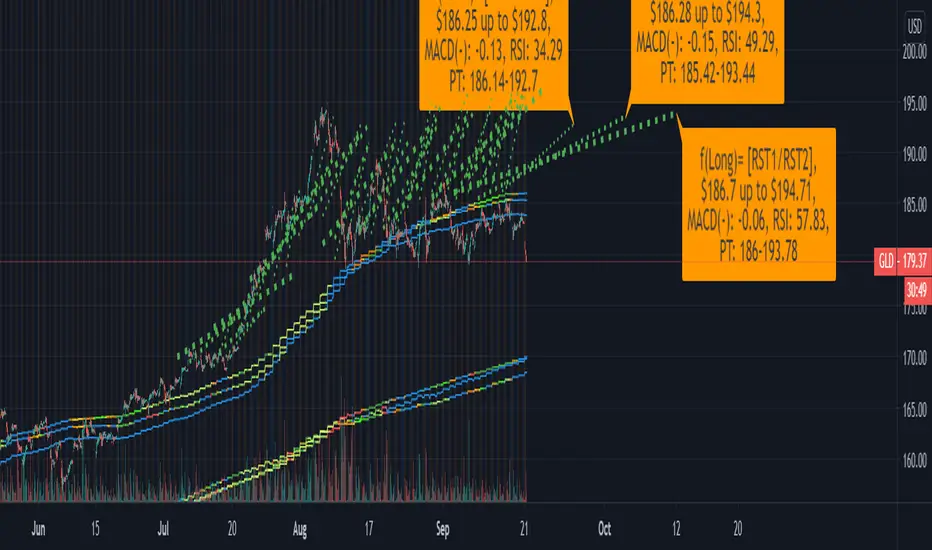
After numerous tries and updates, we have finally come up with a very decent one that plots RSI that reflects both the candle's wick and body. This indicator can be interpreted as a cloud of RSI just like Ichimoku.
Traders can consider this indicator as overbought/oversold only if all of the RSI lines, (or the whold cloud) enters to the zones. Moreover, plotting channels and trendline on this cloud works very well.
We have also made it to show divergence signals so that traders can refer when the relative strength of bulls/bears starts to resolve.
If you wish to obtain access to this indicator, please comment or DM to this account.
We will give you guys an update soon for a newer version!
Thanks.
안녕하세요 트레이더 여러분. 토미 트레이딩 팀입니다.
오늘은 요즘 많은 트레이더들이 유용하게 사용하는 RSI와 해당 지표의 한계점에 대해서 알려드리겠습니다. 또한 본 한계점을 극복하기 위해 저희 개발팀이 최근에 개발한 RSI 클라우드 지표에 대해서 소개해드리겠습니다.
RSI , Relative Strength Index (상대강도지수)는 1978년에 웰레스 월더라는, 저처럼 원래 공학자였지만 기술적분석이라는 학문에 푹 빠져 이쪽 분야로 발을 돌린 한 학자에 의해 개발됐습니다. 해당 지수는 주가의 상승/하락 압력 간의 상대적인 강도를 보여주는 보조지표로 추세의 강도세를 백분율로 표기해줍니다.
RSI를 산출하는 공식은 다음과 같습니다.
RSI (%) = (N의 상승폭 합계/(N의 상승폭 합계 + N의 하락폭 합계))*100
* N = Time period/length, 시간(캔들봉) 단위
본 공식에서 N은 RSI의 민감도를 조절하는 Parameter(설정값)로 보편적으로 Default(기본)값인 14, 조금 덜 민감한 값으로는 25가 사용됩니다. RSI의 단위는 %로 과매수 구간은 70~80%, 과매도 구간은 20~30%으로 사용됩니다. 즉 RSI가 70~80% 이상일 때 강세 혹은 과매수, 20~30%일 때 약세 혹은 과매도라고 판단할 수 있습니다.
정말로 직관적이면서도 참으로 쉽고 유용한 지표이죠.
하지만 아쉽게도 이 RSI도 크나 큰 한계점이 존재합니다. 해당 지수가 산정될 때 사용하는 소스값은 Closed, 즉 캔들의 종가로, 고가와 저가가 지수에 반영되지 않습니다. 즉 캔들의 꼬리는 해당 지수에 고려되지 않는다는 점입니다. 요즘에 누가 캔들 종가만 보고, 혹은 라인차트로만 매매하나요? 허구한날 미친 스캠무빙이 툭하면 나오는 현대 장에 종가만 가지고 매매하면 골로간다는건 다들 아실 거라 생각합니다. 요즘처럼 고변동성의, 툭하면 길고 뾰족한 꼬리들이 난무하는 현대 금융 시장에 적용시키기엔 문제가 너무 많습니다.
게다가 요즘에 너무나도 많은 개인투자자들이 RSI 지표를 사용합니다. 모두가 같은 자리, 같은 기법, 혹은 같은 지표를 쓰면 어떻게 된다고 했죠? 제가 매번 강조 드렸듯이 3~5% 개미 생종률은 불변의 법칙입니다. 모두가 롱을 외치면 숏자리를, 모두가 숏을 외치면 롱자리를 찾아야하는 금융시장. 높은 통찰력과 안목을 지닌 소수의 현명한 투자자들만 살아남는다고 제가 누누이 강조 드렸습니다.
이 문제를 해결하고자 최근 저희 팀은 캔들의 모든 가격들을 RSI지표에 반영시키기 위해, 그리고 종가를 기준이 아닌 다른 기준으로 다이버전스를 모색하는 매우 다양한 시도들을 해왔습니다.
수많은 연구, 실험 및 고찰 끝에 마침내 캔들의 모든 가격을 반영하는 RSI 지표를 만들고 말았습니다. 이름하여 RSI 클라우드! RSI를 하나의 라인이 아닌 범위로 표기를 함으로써 조금 더 보수적이고 정확하게 강도지수를 파악할 수 있게 되었습니다. 본 지표는 일목구름과 마찬가지로 RSI를 하나의 선이 아닌 구름대로 해석하시면 됩니다.
다수의 라인(라인들의 범주를 구름으로 표기함)으로 구성된 이 지표는 고려하는 모든 선들이 과매수/과매도 구역에 진입해야 과열로 간주함으로써 더 보수적으로 확실한 과열 상황들을 포착할 수 있습니다. 그리고 해당 지표에 평행 채널 및 추세선들이 기가 막히게 잘 들어맞습니다. 주가에 추세선/채널 작도하는 것처럼 활용하시면 됩니다. 이탈 방향 나올 때, 그리고 심지어 이탈 이후 리테스트도 나옵니다.
또한 다이버전스 역시 종가가 아닌 캔들의 평균값을 사용하여 시그널이 나오게끔 했습니다. 때문에 중간중간에 긴 꼬리들 혹은 말도 안되는 무빙이나 노이즈들로 발생되는 주가 <-> 지표 다이버전스의 괴리감을 최소화시켰습니다. 이 또한 자동으로 다이버전스를 잡도록 로직을 짰으니 상승/하락세의 과열이 점차 해소되기 시작할 때, 즉 변곡 잡으실 때 매우 유용하게 사용하실 수 있습니다.
물론 당연한 말이지만 이 지표 하나만 가지고 매매를 하면 안되겠죠? 본인만의 여러 기법 및 지표들의 튼튼한 조합을 구성할 때 하나의 기준으로써 참고를 해야합니다.
아래는 비트코인이 아닌 선물과 주식 차트입니다. 해당 차트들은 예전 차트도 아닌 최근 차트입니다. 이와 같이 종목/상품과 타임프레임을 불문하고 다 잘 맞습니다.
그러면 이상, 급변하는 21세기 현대 금융시장에 최적화된 기법, 지표 및 전략들을 꾸준히 연구하고 개발하는 토미 트레이딩 팀이었습니다.
감사합니다.
Komut dosyalarını "trendline" için ara

Diego Riobo Cabot's Force Indicator Diego Riobo Cabot
© riobocabotd
Analysing the Market as Physical Forces
Credits First:
Tradingview Pine Comunity, it's just amazing, honestly.
Godmode Indicator's creators. I was inspired by them to create an indicator that takes a lot of variables into account. I also took the idea of the Momentum and LSMA from there
Function te get volume from lower tf was taken from a post in stack overflow. So, credits to you, anonymous hero.
Let's get to it:
so... What is this thing, exactly?
I wanted to measure the market's upward and downard force, in order to calculate the resulting force. Just as a curiosity.
At the end, I got a pretty decent indicator in my hands and I'd like to share it with you guys.
The main goal was to apply basic rules of physics: Velocity, Acceleration, Mass and Force (We could go further if we wanted, such as Impulse, Quantity of Movement, Impact and so on)
Everything appart from mass is a vector, meaning it has a direcction and a magnitude. Each of them were decompossed in upwards and downwards direction
Nevertheless I pictured this Analysis as a "fight" between two teams the Bulls and the Bears (Buyers and Sellers). So I measured two masses: Bulls (+) and Bears(-)
Glossary (internal Clockwork)
° Velocity: Is the ratio between a travelled distance and the time that took to travel it.
+ Upwards Velocity (v_up): Meausures if current source is higher than the previous and stores this value. Has positive values
+ Downwards Velocity (v_dn): Meausures if current source is lower than the previous and stores this value. Has negative values
+ Both vectors are averaged using the rma function (same average type used in the RSI)
+ The length of this average is called length_v: "Lookback - Velocity"
+ Resultant Velocity (v_av): The sum of the averaged v_up and v_dn, since they have equally opposite directions, there's no need for a vectorial sum.
+ Velocity Index (v_in): It's an index between +100% and -100%. Meausures where v_av stands in relation to high (v_up) and low (v_dn). Not used for calculations, but I'll leave it there for further research
° Acceleration: Meausures the rate of change of velocity during time. Since we already have the velocity calculated, it's pretty straight forward
+ Upwards Vel increase (v_up_up): Stores positive variations of upwards' velocity.
+ Upwards Vel decrease (v_up_dn): Stores negative variations of upwards' velocity.
+ Downwards Vel increase (v_dn_up): Stores positive variations of downwards' velocity.
+ Downwards Vel decrease (v_dn_dn): Stores negative variations of downwards' velocity.
+ Upwards Accel. (a_up): v_up_up + v_dn_up
+ Downwards Accel. (a_dn): v_up_dn + v_dn_dn
+ Resultant Accel. (a_av): a_up + a:dn Not used, is there for further research
° Mass: Measures the volume of operations. How much asset is bougth (Bull) or sold (bears).
+ Mass is measured from a lower timeframe. It checks if the candles are Bullish or Bearish (Could be done with closing prices, or typical price)
+ The Lower Timeframe is determined in minutes throught the input variable "Lower Timeframe"
+ Bull mass (vol_up): Total bullish volume in the lower timeframe, for the current candle period
+ Bear mass (vol_dn): Total bearish volume in the lower timeframe, for the current candle period
+ Neutral mass (vol_nt): Total neutral volume in the lower timeframe. (Buy price = Open price) Not used for calculations. Could be used for resistance points?
+ Resultant mass (vol_av): |vol_up - vol_dn|
+ Total mass (vol_tt): Sum of all masses (Just the total volume)
° Force: It's nothing else than mass * acceleration
+ Upwards Force (f_up): vol_up * a_up Bulls mass * Positive Acceleration
+ Downwards Force (f_dn): vol_dn * a_dn Bears mass * Negative Acceleration.
+ Resultant Force (f_av): f_up + f_dn Not used, is there for further research
° Force Index
+ Upwards Channel (fi_up)
+ Downwards Channel (fi_dn)
+ Both vectors are averaged using the rma function (same average type used in the RSI)
+ The length of this average is called length_v: "Lookback - Force"
+ Raw Index (fi_rw): It's an index between +100% and -100%. Meausures where f_av stands in relation to high (f_up) and low (f_dn).
+ Index (fi_in): It's the averaged raw index using the rma function and the "Force Index Smoothing" period
+ Signal (fi_sg): It's the averaged fi_in using the rma function and the "Force Signal Smoothing" period
+ Momentum (fi_mo): fi_in - f_sg. If the momentum is higher than the current force direction, current force should be outwon by previos market trend. It's Smoothed out using the "Force Momentum Lookback"
+ Trend (fi_tr): It's a linear regression of fi_in using a very long period (Force Trend Lookback)
Okay... sure, but how do I use it?
° It is very similar to how the GodMode 3.2 indicator works actually, so if you're familiar with it, you can start trying this indicator out. I've noticed it can provide a bit more timely signals
° It's also similar to Stochastics or RSI indices... but with three lines. an instantaneous one (Force - Blue), an averaged one (Signal - Orange) and a slow one (Trend - Green)
° Bullish/Bearish momentum: Trendline (green) above 0% means Bullish. Above 12% means a trend wants to form and if it reaches 40% means the strend is super strong (Bitcoin like, strong). The opposite goes for bearish trends (values under 0)
° Line crossings: Instant Force Line (Blue) crosses over the Signal Line (Orange), while the orange is going slightly down or flat under the -12%: Means a long signal. The opposite applies for the Short signals
° Line crossings: Same as above, but when the Signal crosses over the Trend Line (Green)
° Reversals: The background columns are supposed to immitate the "Inertia" of movement. If inertia's bars are higher (when positive) or lower (when negative) than the Force Line (Blue), then it means that the current force the market is making, is probably weaker (at that time) than the inertia the market carries with it.
Tips:
° If you wen't long, the orange line is going slightly down, but it's over +12%, it means the bullish trend is still going, although not as strong as before. You could keep your long position. The reverse applies for short.

AustinJames: Yume Wave 2.0This is the all-access version of the Yume Wave 2.0
The wave uses the bottom, top, and mid line as resistance points. The upper limit is the resistance, the lower limit is support - and the middle line is the support when wave is above it, and resistance when wave is below it.
Check against trend lines to find the best buy/sell point based on the wave. The timeframe you select with the trendline should match the yume wave.
-----------
This is a upgraded version of the wave with modified parameters for a higher success rate. 3 New Lengths and 75 more lines of code added to the overall algorithm. Also included are 2 sublevel signals based on the Fib MA and pattern trading.
The Wave:
+ The Yume is the Fast length
+ The Akume is the Slow length
+ The Miaku is a median weighted length
+ The Upper Limit is an overbought asset indication
+ The Lower Limit is an oversold asset indication
+ The Wave is the spread between Yume and Miaku
Bullish Indications:
+ The Yume is above the Akume
+ The Yume is above the Miaku
+ The Yume is below the Lower Limit
Bearish Indications:
+ The Yume is below the Akume
+ The Yume is below the Miaku
+ The Yume is above the Upper Limit
Signal Strength Weights:
+ 50 = Yume Wave crossed a Limit Line
+ 100 = Yume Wave crossed a Limit Line + Close to a Fib Moving Average
+ 100 = Edge's Market Bottom/Top Algorithm is marked 'True'
Setting up Signals (Based on a 100 Signal Height):
+ Set the "Bull Signal" to be at 50 or 100
+ Set the "Bear Signal" to be at 50 or 100
+ 50 is Agressive, 100 is Conservative.
+ Bull/Bear are separate so you can play conservative bull with aggressive bear.

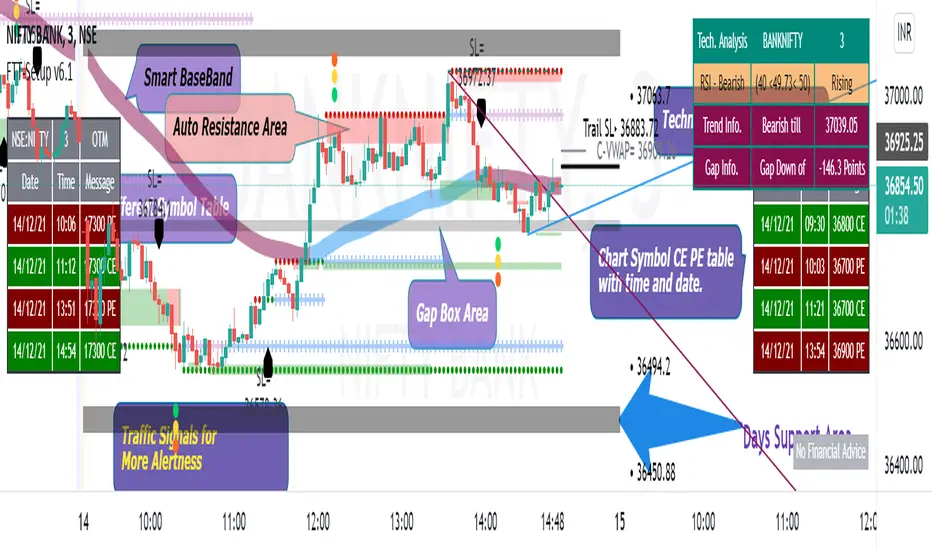
Fishing The Trend - SetupFishing The Trend - Setup
HOW Does it work ?
The name itself says we must have a trading setup for ease of trading for getting the most from the market.
i.e. Combining the most useful indicator under one roof...
Fishing The Trend - Setup have following ::-
1) IntraDay Range.
2) Four Friends.
3) Fishing The Trend.
4) Multi Time Frame - Custom VWAP.
5) RSI based SMA.
1) Intraday Range
HOW Does it work ?
For calculating the average most probable range for any plotted security, it plots 2 bands higher band and a lower band for a particular range using the default ADR. This indicator is on - as default.
# Upper and Lower band act as support and resistance , user may see a reversal in trend from these bands
# If the price breaks these bands, don't take a trade expecting a reversal
# These bands are calculated by averaging the previous x number of days' highs and lows of the security.
2) Four Friends
HOW Does it work ?
Plotting different EMA for finding the direction of Trend / Market, There are actually 5 EMAs- F1 = 20 EMA, F2 = 50 EMA, F3 = 100EMA, F4= 150, and Trend = 200-EMA. Usually 200 EMA is used to find the trend of market whether bearish / bullish, if market is above 200 ema than we may say its bullish and below 200 ema its bearish. The 50 EMA and 100 EMA works as best pullbacks in the trending market, user can configure as per his trading style and method. This indicator can be changed to multi timeframe as required. User can plot lower time frame data onto higher time or vice-versa for finding better opportunities for early trend detection, also the user have the option to use feature of non-repainting or vice versa. The default Color MA option is un=ticked, means plotting 5 different color EMAs, If the user ticks this feature, the whole 5 EMA color will change into red or orange as per direction of closing candle, user can change color as per his / her color combination. Default plotting time is of 1 min. This second indicator is off by default - user have to tick-it to activate it
3) Fishing The Trend
HOW Does it work ?
The code uses dynamic current levels to identify trend, This indicator is using SuperTrend, ATR and relatively Smoothened ATR for
early trend reversal detection to determine the trend and direction so that a fruitful decision can be made.
To Indicate the strength of the trendline, The standard calculations of SuperTrend, along with multiple smoothen ATR results are clubbed determine the direction, a step ahead. However, the indicator is not appropriate for all the situations. It works when the market is trending. Hence it is best to use for short-term technical analysis . SuperTrend uses only the two parameters of ATR and multiplier which are not sufficient under certain conditions to predict the accurate direction of the market. Here in this indicator ATR value is not editable and after long backtests the best ATR value is kept that helps the indicator working very well.
The default setting is best for use, but user can customize the Multiplier for his own fine tunings, So once the Levels are matched, a Long / Short suggestion is plotted. Best Time Frames to use : starting from 1, 3, 5, 15, 30 Mins and so on... to determine Trend.
Long = L and Short = S.
Where and how to use?
The main use of this indicator is quick scalping and Intra-day trading. The Indicator shows the option to show Long/Short Signals which the use can be turned on or off. The indicator shows a very useful option for early detection of the ongoing trend whether there will be reversal of trend or not ?
Stop Loss - That should be done by following ones risk appetite, Ideally the High of the Previous Candle should be the stop loss for
the Long / Short but everyone has their own Risk Management Strategies based on the capital deployed.
by default this comes on..
4) Multi Time Frame - Custom VWAP.
HOW Does it work ?
VWAP = The volume weighted average price (VWAP) is a trading benchmark used by traders that gives the average price a
security has traded at throughout the day, based on both volume and price. It is important because it provides traders with insight into both the trend and value of a security.
This indicator is programmed for using vwap for spot indices / securities not having volume calculations but have futures, specially banknifty and nifty of Indian markets. User has option to change the plotting timeframe as per his requirements for checking the trend under vwap or over vwap. The user have to type the equivalent script symbol in the space provided to calculate the vwap of that particular security and plot on the non-volume script. Seems confusing !!!! have a look
at example..
eg. - if you have chart of banknifty spot and u want to place vwap on in then just write security name in the blank field banknifty future of continuous contract running month " BANKNIFTY1! " Futures Chart... that's it and u will have futures vwap plotting on spot chart... this can give user a definite idea about the vwap line. User have option to change color of bar and change color of the
vwap line which is plotted.
By default this comes off..
Note = This indicator changes bar color
5) RSI based SMA
HOW Does it work ?
# This indicator is for user using RSI, The twist is that not only it uses RSI but also simple moving average, So this makes the user more safe as it is a combination of RSI and SMA.
# Multi-colored ----> Green/Red/Yellow user can change ..moving average of choice
# user can change overbought / over sold values of RSI as required. The time frame here is fixed.
* There is an On/Off Option for each Indicator.
Disclaimer : There could be scenarios when the candle is shown as a long or short and then the candle turns into opposite direction red/green. In such scenarios , Please refer to the just preceding candle and the early detection signal and if this candle is moving into positive direction only then go for long, Similarly opposite for Short, the value of multiplier 1.0 is determined using series of back test across various assets with different time frames.
User Options : Choice of turning on / off the Long / Short Labels and early detection/StopLoss Option can also be activated or deactivated.
Visual Checks - The user could manually validate the back test results on various assets they would like to use this strategy on before putting it live.
Usage/Markets : Index Trading / Equities and also well with Commodities and Currencies
How to get access
Please click on the link / email available in the signature or send me a private message to get access.
Feedback
Please click on the link/email in the signature or send me a private message for suggestions/feedbacks.
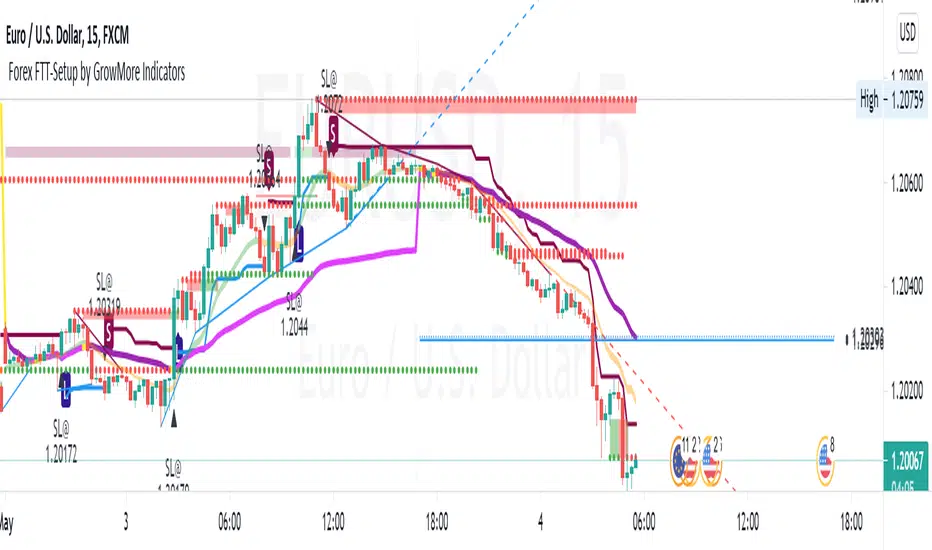
Fishing The TrendFishing The Trend
HOW Does it work ? The code uses dynamic levels to identify trend.
This script used SuperTrend (ST), ATR and relatively Smoothened ST for early trend reversal detection to determine the trend and direction so that a fruitful decision can be made.
To Indicate the strength of the trendline, The standard calculations of SuperTrend, along with multiple smoothen ATR results are clubbed determine the direction, a step ahead.
However, the indicator is not appropriate for all the situations. It works when the market is trending. Hence it is best to use for short-term technical analysis . SuperTrend uses only the two parameters of ATR and multiplier which are not sufficient under certain conditions to predict the accurate direction of the market. Here in this indicator ATR value is not editable and after long backtests the best ATR value is kept that helps the indicator working very well.
The default setting is best for use, but user can customize the Multiplier for his own fine tunings, So once the Levels are matched, a Long / Short suggestion is plotted.
Best Time Frames to use : starting from 1, 3, 5, 15, 30 Mins and so on... to determine Trend.
Long = L and Short = S.
Where and how to use?
The main use of this indicator is quick scalping and Intra-day trading.
The Indicator shows the option to show Long/Short Signals which the use can be turned on or off.
The indicator shows a very useful option for early detection of the ongoing trend whether there will be reversal of trend or not ?
Stop Loss - That should be done by following ones risk appetite, Ideally the High of the Previous Candle should be the stop loss for the Long / Short but everyone has their own Risk Management Strategies based on the capital deployed.
Disclaimer : There could be scenarios when the candle is shown as a long or short and then the candle turns into opposite direction red/green. In such scenarios , Please refer to the just preceding candle and the early detection signal and if this candle is moving into positive direction only then go for long, Similarly opposite for Short, the value of multiplier 0.5 is determined using series of back test across various assets with different time frames.
User Options : Choice of turning on / off the Long / Short Labels and early detection/StopLoss Option can also be activated or deactivated.
Visual Checks - The user could manually validate the back test results on various assets they would like to use this strategy on before putting it live.
Usage/Markets : Index Trading / Equities and also well with Commodities and Currencies
How to get access
Please click on the link / email in the signature or send me a private message to get access
Feedback
Please click on the link/email in the signature or send me a private message for suggestions/feedbacks
[blackcat] L2 Ehlers Automatic SineTrend Trading SystemLevel: 2
Background
John F. Ehlers introuced Automatic SineTrend Trading System in his "Rocket Science for Traders" chapter 12.
Function
blackcat L2 Ehlers Automatic SineTrend Trading System is used to find proper long and short entries.Dr. Ehlers developed a completely automatic trading system called the SineTrend Automatic System based on the rules in his book. His fundamental approach is to trade using the Trend Mode rules when the market is in a Trend Mode and trade using the Cycle Mode rules when the market is in a Cycle Mode.
Key Signal
Smooth --> 4 bar WMA w/ 1 bar lag
Detrender --> The amplitude response of a minimum-length HT can be improved by adjusting the filter coefficients by
trial and error. HT does not allow DC component at zero frequency for transformation. So, Detrender is used to remove DC component/ trend component.
Q1 --> Quadrature phase signal
I1 --> In-phase signal
Period --> Dominant Cycle in bars
SmoothPeriod --> Period with complex averaging
DCPeriod ---> Dominant Cycle Period
Trendline ---> IT fast line
SmoothPrice ---> IT slow line
Trend ---> Trend identifier: 1 for trend; 0 for cycle.
LeadSine ---> Lead Sine Wave signal
DCSine ---> Sine Wave signal
long ---> long entry signal
short ---> short entry signal
Pros and Cons
100% John F. Ehlers definition translation of original work, even variable names are the same. This help readers who would like to use pine to read his book. If you had read his works, then you will be quite familiar with my code style.
NOTE: Due to limited performance oberved from "Market Mode Identification" part, this trading system I observed was not so powerful.
Remarks
The 11th script for Blackcat1402 John F. Ehlers Week publication.
Readme
In real life, I am a prolific inventor. I have successfully applied for more than 60 international and regional patents in the past 12 years. But in the past two years or so, I have tried to transfer my creativity to the development of trading strategies. Tradingview is the ideal platform for me. I am selecting and contributing some of the hundreds of scripts to publish in Tradingview community. Welcome everyone to interact with me to discuss these interesting pine scripts.
The scripts posted are categorized into 5 levels according to my efforts or manhours put into these works.
Level 1 : interesting script snippets or distinctive improvement from classic indicators or strategy. Level 1 scripts can usually appear in more complex indicators as a function module or element.
Level 2 : composite indicator/strategy. By selecting or combining several independent or dependent functions or sub indicators in proper way, the composite script exhibits a resonance phenomenon which can filter out noise or fake trading signal to enhance trading confidence level.
Level 3 : comprehensive indicator/strategy. They are simple trading systems based on my strategies. They are commonly containing several or all of entry signal, close signal, stop loss, take profit, re-entry, risk management, and position sizing techniques. Even some interesting fundamental and mass psychological aspects are incorporated.
Level 4 : script snippets or functions that do not disclose source code. Interesting element that can reveal market laws and work as raw material for indicators and strategies. If you find Level 1~2 scripts are helpful, Level 4 is a private version that took me far more efforts to develop.
Level 5 : indicator/strategy that do not disclose source code. private version of Level 3 script with my accumulated script processing skills or a large number of custom functions. I had a private function library built in past two years. Level 5 scripts use many of them to achieve private trading strategy.

BTC期现基差指标 RTA-V1.2BTC期现基差指标 RTA-V1.2 来自RTA学院,作者Ruomise Lin,感谢Cqz提供建议。
★私人指标.仅供RTA学员与付费圈成员使用★
该指标根据【RTA 课程4.2 永续合约资金费率分析法】 编写。
指标作用:
用于分析数字货币市场BTC,BTCUSD永续合约与BTCUSD之间的基差关系,从而判断市场上期货市场多空人数情况与杠杆率高低。
当蓝色线(基差值)位于以下区间代表对市场方向为
黄色——震荡
绿色深——看涨
绿色浅——强烈看涨
红色浅——看跌
红色深——强烈看跌
功能说明:
精度选择 1.1版本更新
该指标拥有4种精度模式,分别为
低精度——超长期时间框架
中精度——长期时间框架
标准精度——中时间框架
高精度——短期时间框架
趋势线 1.2版本更新
趋势线来判断市场在长期时间框架及以上BTC价格所处的价格位置。
有任何意见或者建议请联系作者,联系方式请看签名。
--------------------------------------------------------------------------------------
以下为英文谷歌翻译。
BTC futures basis indicator RTA-V1.2 comes from RTA Academy, author Ruomise Lin.
Private indicators. Only for RTA students and members of the paid circle.
This indicator is compiled according to .
Indicator function:
It is used to analyze the basis relationship between the digital currency market BTC, BTCUSD perpetual contract and BTCUSD, so as to determine the number of long and short positions in the futures market and the level of leverage.
When the blue line (basis value) is in the following interval, it means that the market direction is
Yellow-shock
Green deep-bullish
Light green-strongly bullish
Light red-bearish
Deep red-strong bearish
Function Description:
Precision selection
The indicator has 4 accuracy modes, namely
Low accuracy-ultra long time frame
Medium precision-long-term time frame
Standard accuracy-medium time frame
High precision-short time frame
Trendline
The trend line is used to determine the price position of the BTC price in the long-term time frame and above.

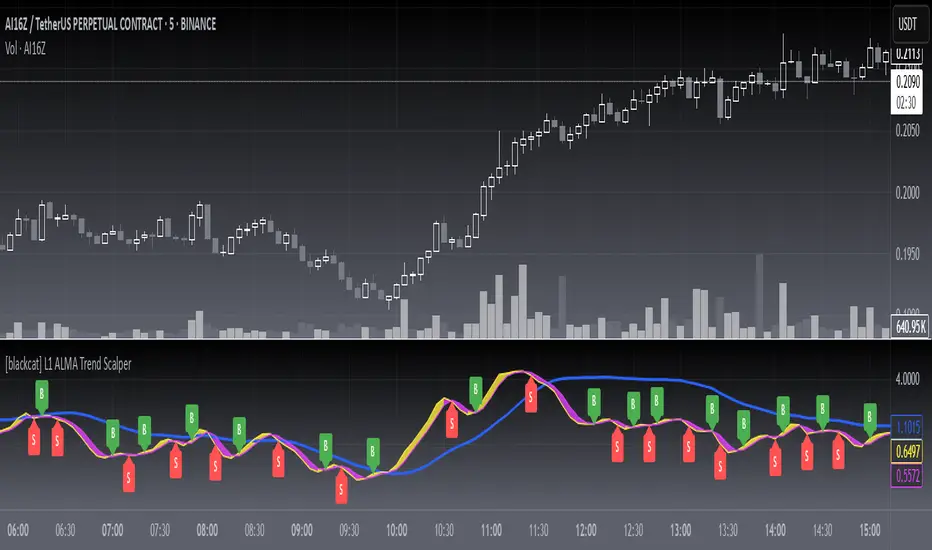
[blackcat] L1 ALMA Trend ScalperLevel: 1
Background
The Arnaud Legoux Moving Average (ALMA) indicator was recently added to the family of moving averages. It was developed in 2009 by Arnaud Legous and Dimitrios Kouzis Loukas. Since then, this indicator has gained huge popularity among traders.
ALMA works like any moving average work. However, the calculation of the ALMA is more perfect compared to the moving average. This indicator has minimal lag which makes it a leading indicator in the market. While the SMA, MA, EMA and SMMA signal line is often delayed. The ALMA was designed to address the two critical disadvantages of traditional moving averages, responsiveness and smoothness.
Function
L1 ALMA Trend Scalper is simple but powerful. This indicator makes full use of ALMA's rapid response advantage to provide buying and selling points by winding and crossing two short-term moving averages. A mid-term moving average can provide relatively effective support and pressure. Finally, the function of whale pump detection is simply realized through the characteristics of the moving average.
Key Signal
trendline --> mid term moving average for support and resistance
tradingline ---> basic element for fast line and slow line
fastline ---> fast line for short term
slowline --> slow line for short term
pumpstart ---> simple whale pump zone detection
Pros and Cons
Pros:
1. Simple but clear to see the trend reversals
2. Aux middle term moving average help just whether it is a true or fake breakout
Cons:
1. No advanced trading skill is incorporated
2. Need improvements on sideways.
Remarks
Just be simple but powerful
Readme
In real life, I am a prolific inventor. I have successfully applied for more than 60 international and regional patents in the past 12 years. But in the past two years or so, I have tried to transfer my creativity to the development of trading strategies. Tradingview is the ideal platform for me. I am selecting and contributing some of the hundreds of scripts to publish in Tradingview community. Welcome everyone to interact with me to discuss these interesting pine scripts.
The scripts posted are categorized into 5 levels according to my efforts or manhours put into these works.
Level 1 : interesting script snippets or distinctive improvement from classic indicators or strategy. Level 1 scripts can usually appear in more complex indicators as a function module or element.
Level 2 : composite indicator/strategy. By selecting or combining several independent or dependent functions or sub indicators in proper way, the composite script exhibits a resonance phenomenon which can filter out noise or fake trading signal to enhance trading confidence level.
Level 3 : comprehensive indicator/strategy. They are simple trading systems based on my strategies. They are commonly containing several or all of entry signal, close signal, stop loss, take profit, re-entry, risk management, and position sizing techniques. Even some interesting fundamental and mass psychological aspects are incorporated.
Level 4 : script snippets or functions that do not disclose source code. Interesting element that can reveal market laws and work as raw material for indicators and strategies. If you find Level 1~2 scripts are helpful, Level 4 is a private version that took me far more efforts to develop.
Level 5 : indicator/strategy that do not disclose source code. private version of Level 3 script with my accumulated script processing skills or a large number of custom functions. I had a private function library built in past two years. Level 5 scripts use many of them to achieve private trading strategy.
[blackcat] L2 Moving Average OscillatorLevel: 2
Background
OsMA is an abbreviation for the term Moving Average Oscillator (MAO). The OsMA is a technical indicator that shows the difference between an oscillator and its moving average over a period of time. The MACD is the most commonly used oscillator in the OsMA display, although any oscillator can be used. The MACD has a built-in moving average, which is the signal line. The signal line is an intersection of the MACD line. The OsMA is the difference or the distance between these two lines, which are usually drawn as a histogram. It can provide both a trend confirmation and possible trading signals.
Function
L2 Moving Average Oscillator combines advantages of moving average and oscillator. It can effectively reduce statruation effect of an oscillator under extreme market conditions.
Key Signal
fastline --> MAO fast line
slowline --> MAO slow line
trendline --> more stable trend line of fastline
Pros and Cons
Pros:
1. filter out oscillator fake signal with moving average processing
2. it is an oscillator that can detect overbought and oversold zones effectively
Cons:
1. need to select proper trading pair and time frame
Remarks
My first MAO indicator
Readme
In real life, I am a prolific inventor. I have successfully applied for more than 60 international and regional patents in the past 12 years. But in the past two years or so, I have tried to transfer my creativity to the development of trading strategies. Tradingview is the ideal platform for me. I am selecting and contributing some of the hundreds of scripts to publish in Tradingview community. Welcome everyone to interact with me to discuss these interesting pine scripts.
The scripts posted are categorized into 5 levels according to my efforts or manhours put into these works.
Level 1 : interesting script snippets or distinctive improvement from classic indicators or strategy. Level 1 scripts can usually appear in more complex indicators as a function module or element.
Level 2 : composite indicator/strategy. By selecting or combining several independent or dependent functions or sub indicators in proper way, the composite script exhibits a resonance phenomenon which can filter out noise or fake trading signal to enhance trading confidence level.
Level 3 : comprehensive indicator/strategy. They are simple trading systems based on my strategies. They are commonly containing several or all of entry signal, close signal, stop loss, take profit, re-entry, risk management, and position sizing techniques. Even some interesting fundamental and mass psychological aspects are incorporated.
Level 4 : script snippets or functions that do not disclose source code. Interesting element that can reveal market laws and work as raw material for indicators and strategies. If you find Level 1~2 scripts are helpful, Level 4 is a private version that took me far more efforts to develop.
Level 5 : indicator/strategy that do not disclose source code. private version of Level 3 script with my accumulated script processing skills or a large number of custom functions. I had a private function library built in past two years. Level 5 scripts use many of them to achieve private trading strategy.

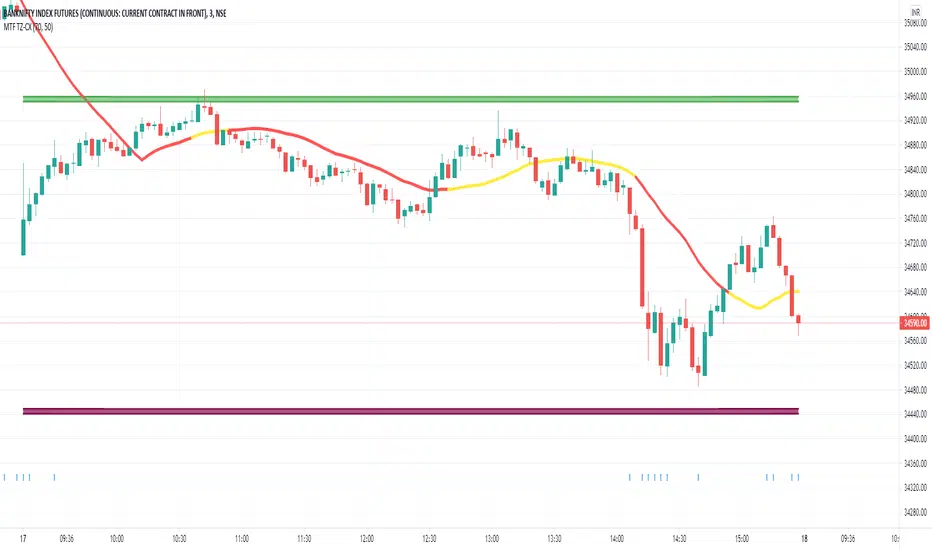
Multi Time Frame - Trend AnalysisMuti Time Frame - Trend Analysis
How does it work ? Price movements over range of period is to compute the trend forward.
This script used SuperTrend (ST) , ATR and RSI to determine the trend and direction so that a buy sell decision can be made
To Indicate the strength of the trendline , RSI is computed over multiple timeframes and then used to in sync with SuperTrend to help determine the direction
The user can customise the RSI strength validation. So one the Super Trend and ATR Levels are matched , the RSI is validated before giving a BUY/SELL suggestion
Best Time Frames to use : Upto 15/30 Mins if using RSI based logic , user can use higher timeframe if the goal is to identify the trend and the use lower time frame to determine Buy/Sell
Where to use
Trend Indicator using Multi Time Frame Analysis to suggest a long or a short
The main use of this indicator is quick scalping and Intra-day trading.
The Indicator shows the option to show the Trend Zone and Buy/Sell Signals which the use can on or off
How to use
User Choices : To avoid false positives we have introduced a double check using RSI ,
it is defaulted to 60/ 40 - the users are free to change it as per their preferences
The system will not suggest a trade when the the counter in beyond the RSI limits
Stop Loss - That should be done by following ones risk appetite , Ideally the open/close of the previous candle should be the stop loss for the buy/sell
but everyone has their own Risk Management Strategies based on the capital deployed.
Disclaimer : There could be scenarios when the candle is shown as a long or short and then the candle turns into opposite direction red/green .
In such scenarios , Please refer to the just preceding candle and if this candle is moving into positive direction (forming green candle) only then buy ,
Similarly Sell/Short only if this candle is forming a red candle
How to get access
Please click on the link / email in the signature or send me a private message to get access
Feedback
Please click on the link/email in the signature or send me a private message for suggestions/feedbacks
CC - ATP (Auto-Trendline Projection)I created this script with a simple goal in mind: Automatically plot trend-lines for a given interval with a resolution that fits the period chosen.
To accomplish this I used a combination of the following:
Ichimoku Spans and Ichimoku Span Width.
ATR and standard deviation from the ATR of the Ichimoku width.
Rolling MACD with directional RSI for coloration based on acceleration.
I then combined all of these pieces of data into a single label and line plotter, so that you can see the assumed trend-lines for the current period based on the interval selected. It attempts to avoid using look-ahead logic by resolving using security, and plotting based on the suggested methodologies.
Inputs:
n (this must be the smallest number). - This is usually 7,14 or 26 depending on the resolution you're going for.
m (must be m > n and m < o). - This is usually something close to 14,26 or 52.
o (must be o > m and o < p). - This is usually something close to 26,52 or 180.
p (must be p > o). - This is usually just o * 2 or 52, 180 or 360.
Show historical data - Keeps some of the lagging trend-lines at intervals of m, o and p.
Precision - The decimal precision to round to, useful if you need this for BTC or penny stocks.
Common Inputs I use:
n=7, m=14, o=26, p=52
n=14, m=26, o=52, p=180
n=26, m=52, o=180, p=360
You can use any numbers, but roughly you want:
m = n*2, o = m*2, p = o*2.
The labels contain the following information:
Expected Support/Resistance levels
The first level is assumed to be heading to the second level.
For instance, if you have S1 down to R2, that means a support is likely to become a resist.
If you have, instead, R1 up to R2 that means the resistance is moving up, but is still resist.
S1 down to S2 is similar in that it means the support level is moving lower but is still sup.
R1 up to S2 is the one that you want to look for as it indicates potential swings.
More-overly, R1-->S2 or S1-->R1 indicate pivotal moments.
MACD / RSI for the given period.
Pretty simple, it's given to the number of decimal places offered by the inputs.
Price Targets.
If it's above the price target area, that means the swing already probably happened.
If it's in the price target area, you're at a pivotal moment; it could go up or down.
If you're below the price target area, watch for catalysts that force price target entry.
WARNING:
Please note, all of this is trend analysis and can be completely demolished in an instant by a catalyst. If there is a huge retracement event, you MUST WAIT A MINIMUM OF THE INPUT PERIOD OF TIME FOR THE STOCK TO SETTLE. If you have a retracement within n-m periods for instance, the short data will be inaccurate. If you have a retracement from m-o the mid data may be inaccurate until it triggers retracement. Same with o-p on the long level. The higher numbers you use, the less reactive the script, but the more historical data it will consume. For instance high numbers may be good for amazon, so you have less reaction to big dips, as you are not afraid because it is a strong company. While this is good on strong companies, it is suicidal for unknown ones.
DISCLAIMER:
I do NOT state anywhere that the data provided by this indicator is valid, forward looking, or guaranteed. If you make a trade based on this indicator I am in no way responsible for the outcome. All trades should be backed by personal due diligence and not rely directly on the indicators of others, as they may contain unfound bugs, incorrect math or look-ahead logic that is potentially dangerous. One final disclaimer, I am a programmer at heart, and am new to this field of study. While I have found a group of supportive friends, do realize I have been at this for less time than most others, more notably I started on 8/16/2020. Please shower me with constructive criticism and other thoughts you have.
Please take this script and view it as a learning experience not a tool for money as of this moment, if you have further questions about me or my scripts, please feel free to message me.
BEST Standalone Trade Manager with Automatic Take ProfitHello BEST traders
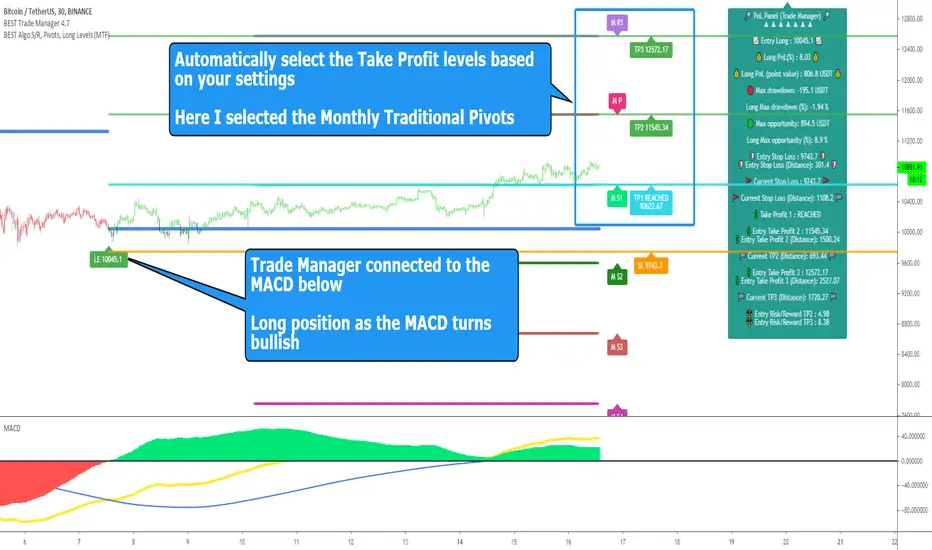
The BEST Trade Manager got upgraded with many more features
This version allows setting automatically the TP levels on either Daily/Weekly/Monthly Fibonacci/Traditional/Camarilla/Woodie pivots and Daily/Weekly/Monthly/Intraday Moving Averages
I. 💎 SCRIPTS ACCESS 💎
1. Available only with one-time payment on my website.
2. My website URL is in this script signature at the very bottom (you'll have to scroll down a bit and going past the long description) and in my profile status available here: Daveatt
3. Many video tutorials explaining clearly how all our indicators work are available on your website > guides section.
4. You may also contact me directly for more information
II. 🔎 What is the BEST Trade Manager?🔎
2.1 Concept
The BEST Trade Manager is compatible with any indicator.
Once connected, it adds another layer of good stuff with real-time user custom defined stop loss (8 available options), take profits (4 possible options) + alerts compatible for trading automation.
2.2 How hard is it to update your indicator?
We'll send to our customers, a comprehensive and easy tutorial, to make any indicator compatible.
I guarantee you, it should take no more than 2 minutes per indicator. We made it easy, fun, and awesome. #bolder #statement
III. The amazing benefits of our Plug&Play system
I hope you're ready to be impressed. Because, what I'm about to introduce, is my best-seller feature - and available across many of my indicators.
The BEST Trade manager can be connected to any external indicator
Let's assume you want to connect your RSI divergence to your Trade Manager.
I mentioned an RSI divergence but you may connect any oscillator ( MACD, On balance volume, stochastic RSI, True Strenght index, and many more..) or non-oscillatory (divergence, trendline break, higher highs/lower lows, candlesticks pattern, price action, harmonic patterns, ...) indicators.
THE SKY IS (or more likely your imagination) is the limit :)
Of course, this tool is compatible with my other indicators
We go in-depth on our website why the Plug&Play is an untapped opportunity for many traders out there - URL available on my profile status and signature
IV. 🧰 Features 🧰
Candles can be colored to highlight the trend direction better [/b [
4.1 Stop-Loss Management
For what's following, let's assume that 2 is the stop-loss value you inserted in the indicator, and the Algorithm Builder gives a BUY signal.
This is NOT a recommendation at all, only an example to explain how this feature works.
- %Trailing: The Stop-Loss starts 2% away from the entry price - and will move up (because we're on a BUY trade as per our example) every time your trade will gain 2% profit
- Pips Trailing: Same as above but using a distance in pips/USD value
- Percentage: The Stop-Loss stays static 2% away from the entry price. There is no trailing here
- TP Trailing: Trail your stop-loss every time a Take Profit level is hit
- Supertrend: embedded supertrend use as a trailing stop
- Fixed: Set the Stop-Loss at a fixed position (value should be in currency/units)
- ATR multiple: Set the Stop-loss at a multiple of ATR
- External connector: Let's say your indicator already contains embedded stop-loss levels, you can add them in the Trade Manager
4.2 Take Profits Management
You can manage up to 3 take profit levels defined as a percentage or price value or ATR multiple.
The expected input is in percentage value (for instance, setting the % target of TP1 to 2% will set the TP1 level 2% away from the entry price
This version allows setting automatically the TP levels on either Daily/Weekly/Monthly Fibonacci/Traditional/Camarilla/Woodie pivots and Daily/Weekly/Monthly/Intraday Moving Averages
4.3 Built-in Risk-to-Reward Panel with real-time analytics
The good stuff doesn't stop here.
You'll notice that this sometimes green (when in a LONG), sometimes red (when in a SHORT) panel at the right of your chart.
- Entry Price: the price when the Algorithm Builder will give a signal.
- The Trade PnL in percentage.
- Entry Stop Loss: Distance (in currency/units) between the selected stop-loss algorithm (percent, trailing, TP trailing, etc.) and the entry price.
- Entry TP1/TP2/TP3: Distance (in currency/units) between the entry price and the first take profit
- Risk/Reward TP1/TP2/TP3: Using the Stop-loss distance at entry, and Take Profit 1/2/3 at the entry to compute the risk-to-reward ratio.
- Max drawdown and Max opportunity (value and percentage): respectively the maximum loss and maximum win per trade
For more details, please check the guides section of my website. Links are in my signature and profile status.
V. 🔔 Alerts 🔔
We enabled the alerts on the:
1. Stop-Loss hit
2. Take Profit 1/2/3 hit
3. custom hard exits based on either MACD / RSI divergence/ MM cross
5.1 🤖 Compatible with trading bots? 🤖
It's compatible with all third-parties out there capturing alerts and forwarding them to the brokers.
We enabled TradingConnector and ProfitView alert templates so far.
If you have any doubts or questions, please hit me up directly or ask in the comments section of this script.
BEST regards,
Dave
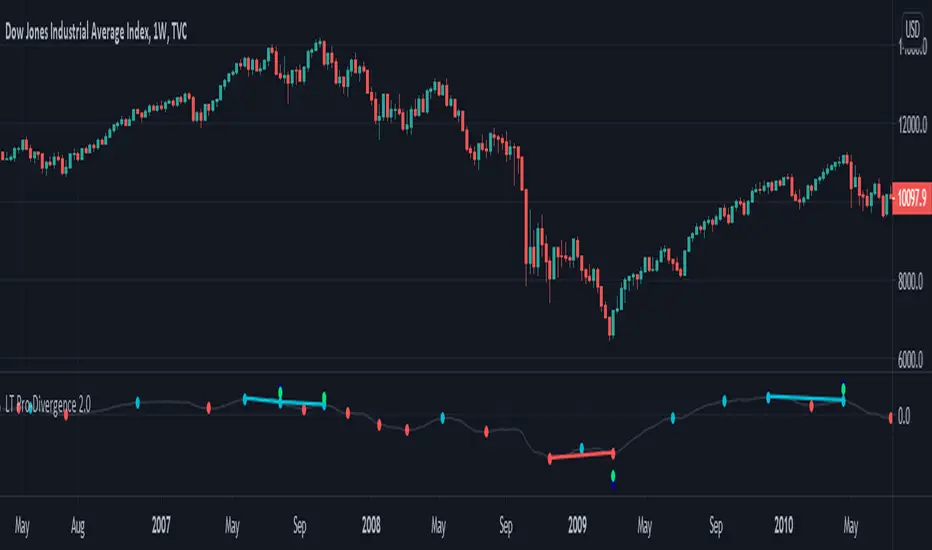
LT Pro-Divergence 2.0This indicator can visually show the divergences on the chart – i.e. a divergence between price action and the momentum. So for example, when price makes a new low and the momentum does not make a new low, this is often a “bullish” divergence – indicating that the force of the downtrend could be weakening. Similarly, when the price makes a new high but the momentum does not make a new high, this is often a “bearish” divergence – indicating that the force of the uptrend could be weakening. Typically, trend reversals are often preceded by a divergence (although it is possible for price to change trend without a prior divergence). We can use divergence as an advance warning of when price may potentially change direction – whether a change in the trend direction or just a correction (or pullback).
It is possible for a divergence to be “negated” – which happens when price continues to move in its direction (i.e. in the direction of the major trend) despite a divergence. So often price can negate a divergence (e.g. a bullish or bearish divergence). This can happen quite a lot in strong trends with momentum.
Due to the numerous divergences that can occur on charts (often with many false signals or whipsaws) – it can be better to use divergence in combination with other technical analysis methods to increase the probabilities. For example, combining divergence with other trend reversal chart techniques such as: trendline breaks, moving average crossovers, break of support or resistance, or oscillators like MACD or RSI etc.
The red divergence colour can indicate a potential bullish divergence, blue divergence colour can indicate a potential bearish divergence. The indicator can also warn of potential divergences developing – so a magenta warning can indicate a potential bullish divergence and a yellow/orange warning of a potential bearish divergence.
The pro divergence indicator incorporates green and blue dots to show when RSI and stochastics is oversold or overbought. The RSI overbought/oversold is shown as dark blue dots – and the stochastics overbought/oversold is shown as green dots. This is added as an extra feature to add further information to the divergence signal. The momentum used in the indicator is the MACD.
The indicator can be used on the charts of the majority of markets (e.g. stocks, indices, ETFs, currencies, cryptocurrencies, precious metals, commodities etc.) and any timeframe. It should be noted that the degree of noise and randomness increases significantly on lower timeframes. So the lower the timeframe that is chosen (e.g. 15-min or lower) the greater the degree of noise and randomness and therefore the higher the frequency of false signals or whipsaws.
Chartists should be aware of the probabilistic and uncertain nature of price action and the markets, and therefore prepare to limit and control any potential risks.
If you would like access, please send me a PM on Tradingview.
LT Pro-Divergence 2.0 ChartThis indicator can visually show the divergences on the chart – i.e. a divergence between price action and the momentum. So for example, when price makes a new low and the momentum does not make a new low, this is often a “bullish” divergence – indicating that the force of the downtrend could be weakening. Similarly, when the price makes a new high but the momentum does not make a new high, this is often a “bearish” divergence – indicating that the force of the uptrend could be weakening. Typically, trend reversals are often preceded by a divergence (although it is possible for price to change trend without a prior divergence). We can use divergence as an advance warning of when price may potentially change direction – whether a change in the trend direction or just a correction (or pullback).
It is possible for a divergence to be “negated” – which happens when price continues to move in its direction (i.e. in the direction of the major trend) despite a divergence. So often price can negate a divergence (e.g. a bullish or bearish divergence). This can happen quite a lot in strong trends with momentum.
Due to the numerous divergences that can occur on charts (often with many false signals or whipsaws) – it can be better to use divergence in combination with other technical analysis methods to increase the probabilities. For example, combining divergence with other trend reversal chart techniques such as: trendline breaks, moving average crossovers, break of support or resistance, or oscillators like MACD or RSI etc.
The red divergence colour can indicate a potential bullish divergence, blue divergence colour can indicate a potential bearish divergence. The indicator can also warn of potential divergences developing – so a magenta warning can indicate a potential bullish divergence and a yellow/orange warning of a potential bearish divergence.
The pro divergence indicator incorporates green and blue dots to show when RSI and stochastics is oversold or overbought. The RSI overbought/oversold is shown as dark blue dots – and the stochastics overbought/oversold is shown as green dots. This is added as an extra feature to add further information to the divergence signal. The momentum used in the indicator is the MACD.
The indicator can be used on the charts of the majority of markets (e.g. stocks, indices, ETFs, currencies, cryptocurrencies, precious metals, commodities etc.) and any timeframe. It should be noted that the degree of noise and randomness increases significantly on lower timeframes. So the lower the timeframe that is chosen (e.g. 15-min or lower) the greater the degree of noise and randomness and therefore the higher the frequency of false signals or whipsaws.
Chartists should be aware of the probabilistic and uncertain nature of price action and the markets, and therefore prepare to limit and control any potential risks.
If you would like access, please send me a PM on Tradingview.

VG CAPITAL TRENDLINE SUPPORT AND RESISTENCE Edited. Script designed based on price action, where we look for supports, resistances, as well as price closing. We also follow the trend to see future movements. It does not give entries, it only helps to do technical analysis. You must follow the trend and look for setbacks to continue looking for movements in your favor.
Contact for me message for more information

Profit Accumulator Moving Average SlopeMoving Average Slope Indicator
This is a support indicator to the Main Indicator which has also been published.
This indicator makes use of custom and adjustable moving averages. There are two options for this centred oscillator:
Average of Three Moving Averages on Current Time Frame
Average of Three Moving Average Time Frames for One Length (i.e. if I'm using a 1hr time frame I would take the average of 30min, 1hr and 4hr moving averages with a 12 length).
When the trend line crosses above zero it is an indication for a long trade and when the trend line crosses below zero it is an indication for a short trade.
Whilst an actual alert function is not set for the indicator, the TradingView alert function can be used to trigger a message when the trendline crosses above or below zero.
I've been using this successfully on the one hour FX charts, but seems to work equally as well on higher or lower time frames (not less than 15min).
The other indicators which are part of the suite are shown on the website which is highlighted in my signature at the bottom of the page. Purchase of the main indicator gives access to the full suite of eight indicators. I use the other indicators to confirm the direction of the trade and to determine if I want to trade or not. I use it along with the 2min, 15min and 4hr timeframes to identify the best entry window and how long I'm likely to be in the trade.
Support can be provided via private message or in the comments below.
The links are provided below for access to the indicator.
