DMT 369 DRAGRONFLY STRATSuccessful traders trade with a fixed plan and without emotion, but this a lot harder than many new traders think. Many never master this skill and suffer continual drawdowns on their accounts as they overtrade high leverage positions in volatile markets.
ĐΜŦ Autobot resolves this issue by taking the human element out of the equation, allowing full automation of trades using TradingView alerts to trigger your favourite trading bot, such as Alertatron or 3Commas.
Being a Trend Reversal Indicator based on Volatility & Average True Range, ĐΜŦ Autobot is designed to identify spots in the market that offer suitable scalp and swing trade opportunities.
Due to popular demand we have expanded our ĐΜŦ Autobot product line to include the new ĐΜŦ Autobot Dragonfly 3-6-9 Edition which combines DMT with 3-6-9 Vortex mathematics, our Titan indicator and a multi-ladder scalping strategy to ensure you maintain a preferable average entry when price action moves against your position.
Indicator View
It its default state the DMT Autobot Dragonfly indicator displays key signal information, such as:
• Support & resistance range lines
• Titan Body Small & Large Time Frame lines
• Long & Short entry positions
• Long & Short position ladders
• Profit targets
Dragonfly displays a range between resistance (upper line) and support (lower line) on the chart.
Once the price is granted support in the range the lower line will turn green. As price action develops it will make repeated attempts to test support. If support holds price will attempt to test the resistance line (red).
When resistance is broken and the price is above the upper line, the line will turn blue confirming the bullish momentum and provide a potential buy opportunity.
Price action will make attempts to test the upper line as support and will keep rising while support is granted.
Once support is lost the upper line will become red once more. As price action develops it will make repeated attempts to test resistance. If resistance holds, the price will attempt to test the support line (green).
When support is broken and the price goes below the lower line, the line will turn red confirming the bearish momentum and provide a potential selling opportunity.
Price action will make attempts to test the lower line as resistance and will keep dropping while resistance is granted.
Titan Body
The Titan Body Small & Large time frame options in the indicator add additional trendlines to the chart to provide further clarity and confirmation to the Support & Resistance range indication.
Once price is granted support by the Small Time Frame trend line the line will turn green. As price action develops it will make repeated attempts to test the Small Time Frame support. Once the price is below the Small Time Frame trend line, the line will turn red and can act as resistance in a trend reversal.
When price is granted support by the Large Time Frame trend line the line will turn cyan. As price action develops it will make repeated attempts to test the Large Time Frame support. Once the price is below the Large Time Frame trend line, the line will turn orange and can act as resistance in a trend reversal.
The Titan Body enabled and customized in the indicator’s style settings,
Alert indicators
DMT Autobot Dragonfly Edition generates signals that can be used to scalp trade a volatile asset.
Signals are enabled and customized in the indicator’s input settings Additional options can be found in the options, but it is recommended that these are left at the default, as shown below. The indicator generates many
Entry and Profit levels can be disabled or customized in the indicator’s style settings,
Tradingview Alerts
Using Tradingview alerts, DMT Autobot Dragonfly signals can be used to trigger a trading bot.
To trigger a long or short position, set the Tradingview Alert Condition to DMT 369 Dragonfly and select the long or short option.
It is recommended that long or short positions are configured to trigger Once Per Bar Close
Ladders can also be triggered using alerts. To trigger a ladder order, set the Tradingview Alert Condition to DMT 369 Dragonfly and select the appropriate Long or Short ADD option that is to be triggered by the relevant values defined in the indicator’s configuration.
It is recommended that ladder orders are configured to trigger Once Per Bar,
To trigger a take profit order, set the Tradingview Alert Condition to DMT 369 Dragonfly and select the Long or Short TP option that is to be triggered by the relevant values defined in the indicator’s configuration.
Take profit orders can be configured as Once Per Bar Close or Once Per Minute.
If you wish to trigger a take profit signal immediately when the indicator’s defined take profit value is achieved, then use the Once Per Bar option.
Selecting Once Per Bar Close to generate a take profit signal is a gamble as the candle may close far away from the defined profit target – positive or negative.
While stops can be used, they are not applicable to the recommended ladder strategy.
Ladder Strategy
The DMT Autobot Dragonfly indicator always turns an underwater position into a win by utilizing a ladder strategy.
By using the recommended defaults, the indicator will trigger ladder orders at 3%, 6% & 9% using increasing order sizes,
Order sizes increase exponentially to ensure a good average price is maintained. If you are not using DMT Autobot Dragonfly signals to trigger ladder or take profit orders, please ensure your trading bot is configured to recalculate the new ladder entry and profit target based on the new average position entry price as each ladder is filled.
If you are using DMT Autobot Dragonfly on a leveraged asset, please ensure the leverage position is configured suitably so that your position is not liquidated if the price rapidly moves against you.
If u are looking for more information or access to the script please private msg me in trading view chat thx for support
Komut dosyalarını "trendline" için ara

Aggregate CandlesThis script creates candles based on an aggregated Index price from various exchange tickers. A lot of exchanges have specific flash crash wicks, missing data, erraticness compared to other exchanges particularly in their first few months, this is an attempt to clean up the price history, be it for TA ( trendlines , S/R etc.) or use in algos or other indicators, without reliance on one exchange. It uses the new Array functionality to generate median and averages, and is entirely original work. This particular version is a generic version of the BTC version. Please read the header before use, and if you do wish to use the code, please ask permission first.

ALLinDivergence v12.60 :: PinPoint BUY/SELL OpportunitiesEasy to spot BUY/LONG or SELL/SHORT ENTRY POINT opportunities.
Just follow this 9 RULES!
Rule 1. ONLY THINK OF GETTING IN A POSITION when BackgroundWave is coloured GREEN and ON POSITIVE SIDE of Flat White Line
Rule 2. ONLY THINK OF GETTING IN A POSITION when BackgroundWave is coloured RED and ON NEGATIVE SIDE of Flat White LineRule
Rule 3. ENTER BUY POSITION (Same Direction) when HigherHighs of MiniWave are coloured GREEN and they are getting BIGGER - needs to be confirmed with RULE 1.
Rule 4. ENTER BUY POSITION (Change) when LowerLows of MiniWave are coloured RED and they are getting SMALLER - needs to be confirmed with RULE 2.
Rule 5. ENTER SELL POSITION (Change) when HigherHighs of MiniWave are coloured GREEN and they are getting SMALLER - needs to be confirmed with RULE 1.
Rule 6. ENTER SELL POSITION (Same Direction) when LowerLows of MiniWave are coloured RED and they are getting BIGGER- needs to be confirmed with RULE 2.
Rule 7. Draw DIVERGENCE TRENDLINES on HIGHS or LOWS to ease your "spotting capabilities" and to be able to set up whatever ALERT you need
Rule 8. IF NOT SURE - CLOSE THE POSITION
Rule 9. DO NOT BE GREEDY - FOLLOW THE PLAN, whatever it is - but definitely THE PLAN SHOULD EXIST)
TIP:
1. First choose your favourite TimeFrame (mine is 30min) and draw all the Lines you need for better preview of the situation and LOCK them (believe me!:)
2. After some move (BUY/SELL) is just about to get confirmed on 30min TF, you can go on lesser TF (i usually analyze 1min, 3 min, 9 min and 15 min) down to TF that its GREEN/RED waves still makes sense (does that makes sense?)
3. On smaller TF you will get confirmation faster but sometimes they are more unreliable than in bigger TF. But if it aligns with a confirmation from 30min TF than i guess it should be OK to judge a bit early:)

Tug-of-War Fast/Slow Technical IndicatorThe script Tug-of-War (ToW) Fast/Slow has a couple of lines (red and purple) and areas (purple and greenish) which give the trend. It also has one line (blue) and dots (green) that give the up-and-down swing.
HOW THE INDICATOR WORKS
It is based on moving averages run on normal OHLC bars, Heikin Ashi bars as well as customized bars (which modify the open/high/low/close values similar to how Haikin Ashi bars do). These moving averages are weighted by volume and related to each other (for example differences are calculated) to produce the final lines. Since the script requires volume, it may not work for tickers which don't have volume (however for some tickers the script uses a proxy-volume so that they work; for example it uses the SPY volume for VIX). There is a different but similar script that I'll be publishing (ToW Simple) which doesn't use volume and runs on any ticker.
HOW TO SETUP THE INDICATOR
The indicator can be run on "close" prices as well as "open", "high", "low" and several mini-max modes ("MM ..."). They pick highs and lows (minim and maxim values, hence the mini-max name) to generate the indicator lines. See the drop down box options under "Adjust Close Type" (the very fist options in the script settings). The multiple MM modes use different formulas to calculate the mini-max values. The more significant MM modes are MM ZZ (zig-zag), MM HL/HL (determines highs and lows based on highs and lows), MM HL/C (determines highs and lows based on close) and MM Close. Note: if the MM ZZ mode show you the highs for the current bar and you actually want the lows (or vice versa) check "MM ZZ Reverse".
The indicator has two fast lines:
the green dots (called F1 since it's the 1st Fast line, actually dots)
the blue line (called F2--the 2nd Fast line)
They are called "fast" because they move up and down faster. In previous iterations of the script I called them "swing lines" since they capture the prices swing up and down. The blue line is the more significant one (since the green one I set, by default to dots instead of an actual line).
The indicator has two slow lines:
the purple line (called S1 since it's the 1st Slow line)
the blue line (called S2--the 2nd Slow line)
They move slower than the fast line and they are better at determining the trend.
The order of lines, from fast to slow, is: F1 (green), F2 (blue), S1 (purple) and S2 (red).
The indicator also has two areas:
the greenish area (called FA since it's the Fast Area)
the purple area (called SA since it's the Slow Area)
Additional lines (but less significant are displayed if you uncheck the "Clean look" option).
The script allows to display up to for sets of lines (see the top "Adjust Close Type (Set #)" options). For example one set may show "Highs" and the other "Lows" or "Close" and "MM HL/HL". Additionally it can run in multi-set mode when it shows the chosen one line (F1, F2, S1, S2, FA, SA) for each OHLC (open, high, low, close). See "Only Show Related Lines" option. In this display purple is the line for Open, green is the line for High, red is the line for Low and black is the line for Close.
The indicator also has a custom mode (see the "Enable custom bars" checkbox and the options following it). With it you can change the open/high/low/close value (see "Custom #1 OHLC to Modify") of a bar ("Custom #1 Index To Modify" determines which bare to modify, 0 being the most recent bar). Then "Custom #1 Modifier Type" specifies to use open/high/low/close value of the same or different bar (use "Custom #1 Modifier Index/Value ..." to choose which bar's OHLC value to use for the custom value; 0 means the O/H/L/C value of the same bar as the one being modified; 1 means previous bar, etc.). If "Custom" is selected instead (under Modifier Type) then you can enter the custom value in the "Custom #1 Modifier Index/Value ..." field. This will show you how the indicator lines look like if the price was different. Three different bars can be modified this way. You can try different custom values and see for what price value one of the lines reaches a high or low point. That is an estimate of how far the price may go. Note: the indicator values depends depends on all OHLC values (plus volume) not just on the one chosen. That is, if the indicators is based on close values it is still affected to some extent by high, low and volume. Therefore the price value determined using the custom mode may not be exact but only a rough estimate (and the bigger changes in OHLC the bigger affect on the indicator and the actual price may not be exactly what was calculated using the custom mode.
HOW TO USE THE INDICATOR
Strategies and tools that apply to price such as resistance and support levels and trend lines, pitchforks (particularly Schiff pitchforks in case of the indicator) also apply to these lines. Because the indicator lines are within a range it is generally easier and faster to see and find such support/resistance levels and trend lines.
Additionally, the lines or the areas crossing the 0 line often indicate a change in trend (however if earlier indicator highs/lows bounce off around the 0 line that may happen this time around as well). The more significant 0 crossing is for the slow lines (red first and then purple) as well as the areas.
The slow lines and the areas, as mentioned already, show the trend (in previous iterations of the indicator I called them direction lines).
The fast lines (blue line, green dots) show the swing, as mentioned earlier. They often swing up and down. When they reach a high (you can thin of it as overbought) they may move back down on the next bar (or vice-versa when reaching a low). However, sometimes they don't swing but rather move in a line closer to a straight line (more like the slow lines). That indicates that the trend is stronger.
The fast lines can also indicate the trend by looking if their highs and/or lows are trending up or down. Thus, if the highs and lows are trending down then it's likely the price will go down.
Another thing to look at is divergence between the price and the slow lines or the high/lows trend of the fast lines (that I mentioned above). If the price is going up but the these are trending down then over the same bars then the price may be coming closer to a reversal.
STRATEGIES
Swing-in-trend. Find a ticker with the slow lines showing an upward trend (i.e., the red line crossing 0 or being above 0) and a the slow line (such as the blue line) reaching a previous low level (draw support levels and/or trend lines to determine that). Go long when the fast line reaches the support level or bottom trendline. The expectation is that the price will move up by the close of the next bar (when the position should normally be closed). The "go-short" setup is just reversed (slow lines trending down and the fast lines reaching high levels). You can use the "High", "Low", "MM ZZ" or one of the other MM modes instead of "Close" to get a better entry and exist point (in this case you enter when the the "Low" or "MM ZZ" modes reached a low and you enter if the "High" or "MM ZZ" reached a high or else exit at close of the next bar).
Trend-on-swing. When the red line is about to cross or just crossed the 0 line and wait for the swing line to go down first (you can use "High", "Low" or an MM mode, as explained dabove, for a better entry point) and then you enter the position and exit when either the slow (red) line reaches a resistance level, it crosses 0 the other way or when the fast line reaches a very high resistance level. This strategy will take longer, it won't be closed on the next bar.
Mini-max strategy. This is a new strategy I've developed. It uses MM ZZ mode (and a second MM ZZ set to "reverse") as well as "High", "Low" and "MM HL/HL" mode. I basically draw resistance and support lines on these, usually 2-3 lines for high and the same for low, for multiple tickers that seem a good match (they show a nice, consistent up/down pattern for MM ZZ). When the F2/blue lines reaches one of the horizontal lines further from the 0 lines (I setup alerts for this), then I enter expecting a move in the opposite direction. If it reaches the 2nd or 3rd low horizontal line then I go long. Then on the next bar when the F2 line reaches the 1st high horizontal line then I close the position (alternatively, I close half and keep half for when the second high horizontal line is reached). Alternatively, I may close the same bar, when the reversed MM ZZ setup reaches the 1st high horizontal line. I usually use this setup on weekly charts and use weekly options but it can be used on other charts such as daily charts as well.
I recommend to setup alerts on the indicator. After you draw a horizontal line or a trend line and you select it, its bar has a clock icon with a "+" sign. If you click on it you can setup an alert. In the setup dialog, under "Condition" select the indicator and then select the line of the indicator (such as "F2 (f_s/Blue)") then select "Once Per Bar" under "Options" (that's my recommendation, it will alert you only one time per bar). Finally customize the message for example: "ZZ: F2/blue /lo hl 1/3, TQQQ, 1D" (which means it's for MM ZZ mode when F2 (blue) line intersects the 1st (out of 3) low horizontal line (HL) and it's for TQQQ on 1D chart. When I use the reverse mode for ZZ then I write: "ZZr: ..."
In the chart above, the first indicator shows the "Close" mode and the second the "MM ZZ" mode (along with 2 levels for high and low).

Aggregate BTC CandlesThis script creates candles based on an aggregated Index price from various BTC exchange tickers. Since the early years in particular have a lot of exchange specific flash crash wicks, missing data, erraticness compared to other exchanges particularly in their first few months, this is an attempt to clean up the price history, be it for TA (trendlines, S/R etc.) or use in algos or other indicators, without reliance on one exchange. It uses the new Array functionality to generate median and averages, and is entirely original work.

[blackcat] L2 Ehlers Cyber CycleLevel: 2
Background
John F. Ehlers introuced Cyber Cycle Indicator in his "Cybernetic Analysis for Stocks and Futures" chapter 4 on 2004.
Function
Trading the Cyber Cycle Indicator is straightforward. Buy when the at this point. Sell when the Cycle line crosses under the Trigger line. You are at the bottom of the cycle at this point. Sell when the Cycle line crosses under the Trigger line. You are at the top of the cycle in this case. To be sure, there are crossings at other than the cyclic turning points. Many of these can be eliminated by discretionary traders using their experience or others of their favorite tools. One of the more interesting aspects of the Cyber Cycle is that it was developed simultaneously with the Instantaneous Trendline. They are opposite sides of the same coin because the total frequency content of the market being analyzed is in one indicator or the other. This is important because the conventional methods of using moving averages and oscillators can be dispensed with.
Key Signal
Cycle ---> Cyber Cycle fast line
Cycle (2) ---> Cyber Cycle slow line
Pros and Cons
100% John F. Ehlers definition translation of original work, even variable names are the same. This help readers who would like to use pine to read his book. If you had read his works, then you will be quite familiar with my code style.
Remarks
The 24th script for Blackcat1402 John F. Ehlers Week publication.
Readme
In real life, I am a prolific inventor. I have successfully applied for more than 60 international and regional patents in the past 12 years. But in the past two years or so, I have tried to transfer my creativity to the development of trading strategies. Tradingview is the ideal platform for me. I am selecting and contributing some of the hundreds of scripts to publish in Tradingview community. Welcome everyone to interact with me to discuss these interesting pine scripts.
The scripts posted are categorized into 5 levels according to my efforts or manhours put into these works.
Level 1 : interesting script snippets or distinctive improvement from classic indicators or strategy. Level 1 scripts can usually appear in more complex indicators as a function module or element.
Level 2 : composite indicator/strategy. By selecting or combining several independent or dependent functions or sub indicators in proper way, the composite script exhibits a resonance phenomenon which can filter out noise or fake trading signal to enhance trading confidence level.
Level 3 : comprehensive indicator/strategy. They are simple trading systems based on my strategies. They are commonly containing several or all of entry signal, close signal, stop loss, take profit, re-entry, risk management, and position sizing techniques. Even some interesting fundamental and mass psychological aspects are incorporated.
Level 4 : script snippets or functions that do not disclose source code. Interesting element that can reveal market laws and work as raw material for indicators and strategies. If you find Level 1~2 scripts are helpful, Level 4 is a private version that took me far more efforts to develop.
Level 5 : indicator/strategy that do not disclose source code. private version of Level 3 script with my accumulated script processing skills or a large number of custom functions. I had a private function library built in past two years. Level 5 scripts use many of them to achieve private trading strategy.

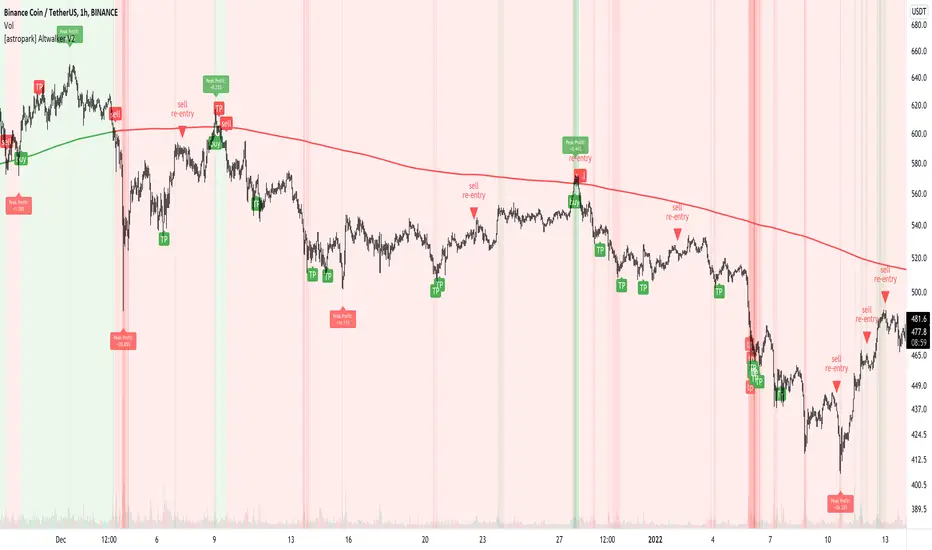
[astropark] Altwalker V2Dear Followers,
today I'm happy to share with you Altwalker V2 , an updated version of the former Altwalker for lower timeframes (from 5 minutes to 4 hours).
It is both a Swing and Scalping Strategy indicator , based on a simple trend following theory , mainly designed for Cryptocurrencies, Altcoins and of course Bitcoin.
Here you can see the Altwalker V1:
Based on Moving Average, Altwalker V2 on low timeframes dynamically identifies market resistance and support, so in which trend a cryptocurrency is during time:
green trendline and background means bullish trend , in fact it start with a "buy" signal
red trendline and background means bearish trend , in fact it start with a "sell" signal
if a series of buy and sell appears (this may happen especially in lower timeframes), this means price is in consolidation or distribution phase, so be prepared for a new trending phase coming soon, always remembering that taking profits is awesome and managing your risk by defining you position size and having a stoploss is a must in trading
To help in Taking Profits, Altwalker integrates also 2 special tools besides the trend highlighter:
Overbought and Oversold RSI Signals , which appear both as darker background (the darker the color, the more the price is in overbought/oversold) and green "ob"-"tp" / red "os"-"tp" labels (they optionally pop up only on a configurable stronger overbought/oversold condition) (you can enable/disable it optionally)
Peak Profit Tracker , which resets every time a new trade start and keeps track of price fluctuation during the trade: the message is don't be too much greedy and take profits or lock them with a stoploss in profit (you can enable/disable it optionally)
You can edit many options in order to
enable/disable showing buy/sell signals
enable/disable showing trendline
edit trendline variant (you have 2 options, by default variant 1 is selected)
enable/disable showing trend as background
enable/disable showing RSI TP signals
edit RSI length, overbought (OB) and oversold (OS) levels
enable/disable showing peak profits on each trade
The user who wants to use this strategy, especially via an automated bot, must always set a stoploss (example 150$ from entry on bitcoin ) or use a proper risk management strategy .
This is not the "Holy Grail", so use it with caution. It's highly suggested to use a proper money management .
This script will let you set all notifications you may need in order to be alerted on each triggered signals.
Here there are some examples how Altwalker V2 works on many timeframes and markets:
LINK/USDT 1h
XLM/BTC 1h
ETH/BTC 1h
ETH/USDT 1h
COMP/USDT 1h
YFI/USDT 15m
NEO/BTC 5m
VET/USDT 15m
This is a premium indicator , so send me a private message in order to get access to this script .
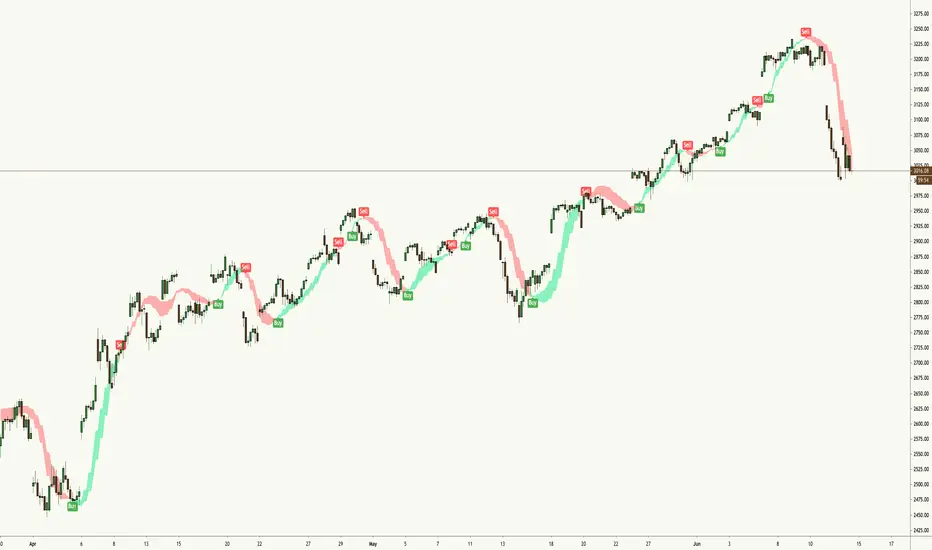
Cave StrategyDescription: This is an indicator based on morning star and evening star pattern recognition, a known technical analysis pattern. I've built on top of the original script shared by @RomanLosev and extended it into a more refined trading strategy called Caves by a trader known only as Farid. The cave long and short indicators represent buy and sell signals based on the 20 EMA trendline.
Morning Star candlestick pattern
The Morning Star candlestick pattern is a reversal pattern in technical analysis. The pattern has three candles. It forms at the bottom of a downtrend. The first candle is any long and bearish candle. The second candle is a small and indecisive candlestick. The third candle is any long and bullish candle. “Bullish” means the stock price closes above the open price. “Bearish” means the stock price closes below the open price.
During a downtrend, high pessimism causes heavy selling. The pattern’s first candle forms. It’s long and bearish. The indecision between the buyers and sellers forms the second candle. It’s a small candlestick—or a Doji. The expectation of positive stock news in the market forms the third candle. It’s long and bullish. When the volume and stock price increases, it suggests a change in trend.
Evening Star candlestick pattern
The Evening Star candlestick pattern is also a reversal pattern. The pattern has three candles. It forms at the top of an uptrend. The first candle is any long and bullish candle. The second candle is a small and indecisive candlestick. The third candle is any long and bearish candle.
During an uptrend, high optimism causes heavy buying. The first candle forms. It’s long and bullish. The indecision between the buyers and sellers forms the second candle. It’s a small candlestick—or a Doji. The expectation of negative stock news in the market forms the third candle. It’s long and bearish. When the volume increases and the price decreases, it suggests a change in trend.
These patterns are used for trend identification. The Morning Star pattern is used as a buy signal. The Evening Star is used as a sell signal. It’s advisable to use a combination of patterns and indicators to determine your trading strategy.
Legend
-- ⬆️ is a U-shaped cave, morning star, visualizing a buy/long signal
-- ⬇️ is an A-shaped cave, evening star, visualizing a sell/short signal
Features
-- ability to change ema
-- style changes
-- emoji

RedOBVOBV where you can choose a specific timeframe. Also I duplicated it, so now it could be easier to draw trendlines if you pick dots and line.
The main idea is to spot divergence between the price and OBV. Big buys or sells could be well camouflaged on the 4H 1D candles, but it's much harder to hide something on 1-5 min timeframes.

Responsive Linear Regression ChannelsThis is a linear trend indicator that can:
- automagically adjust to different chart resolutions
- snap to day/session boundaries on intraday
- totally not do the above and use ye olde good fixed lookback window
- show the regression trend and its RMSE channels
- disregard the trend and just show the period average and standard deviation lines (often acting as support and resistance)
The main idea was to allow you to quickly view linear trends for different time periods without having to calculate the required amount of bars.
By default, you will be able to quickly switch between 1-3 months, 6 months, 1 year, 2 years and 5 years of data, as well as various daily lookback periods.
Please adjust resolution settings to your liking.
Caveats:
- More data means more noise and slower calculations.
- HLC3 source is recommended, especially at resolutions above hourly.
- Trend will be slightly different if you use extended hours.
- If you use extended hours and don't have a data subscription, trend will be SUBSTANTIALLY different, especially at smaller resolutions like 1m.
- You might want to use 3.5 days per week for crypto (it's 7 days by default).
Known problems:
- If you can't see the trendlines, scroll to the left or zoom out - the origin could be outside of your viewport.
- Futures' sessions start on the previous day. We currently snap only to day boundaries, not session breaks.
- UVXY and the like that have extremely high price datapoints. The calculations will be wrong on some resolutions.
- Replay can freeze circa bar_index 244 — disable smart lookback and keep your window under 240 bars if you encounter this.
ACKNOWLEDGEMENTS:
Many thanks to alexgrover for his extremely efficient functions (used with permission)

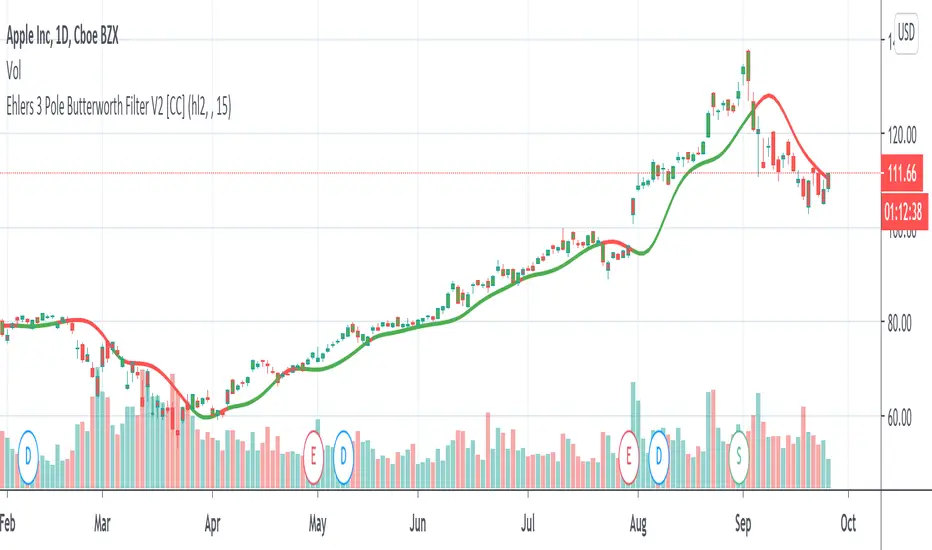
Ehlers 3 Pole Butterworth Filter V2 [CC]The 3 Pole Butterworth Filter was created by John Ehlers (Cybernetic Analysis For Stocks And Futures pgs 196-197) and this indicator is a moving average that also works well as a trendline. Buy when the indicator line turns green and sell when it turns red.
Let me know if you would like me to publish other indicators or if you want something custom done!
Noro's Trendlines IndicatorTo create the script I used the LonesomeTheBlue code. Thank him for his code.
The indicator shows trend lines. Up to three support lines (red) and up to three resistance lines (lime). There can be up to 6 lines at a time. However, most often there will be from 0 to 1 line. Trend lines may be extended to the right. For this purpose there is a checkbox in the setting. This is the way you may adjust line thickness.
For example, how to use
The indicator shows you the support line (red) and the resistance line (lime). If the line is crossed, the price may move a lot towards the breakout.
In a few days.

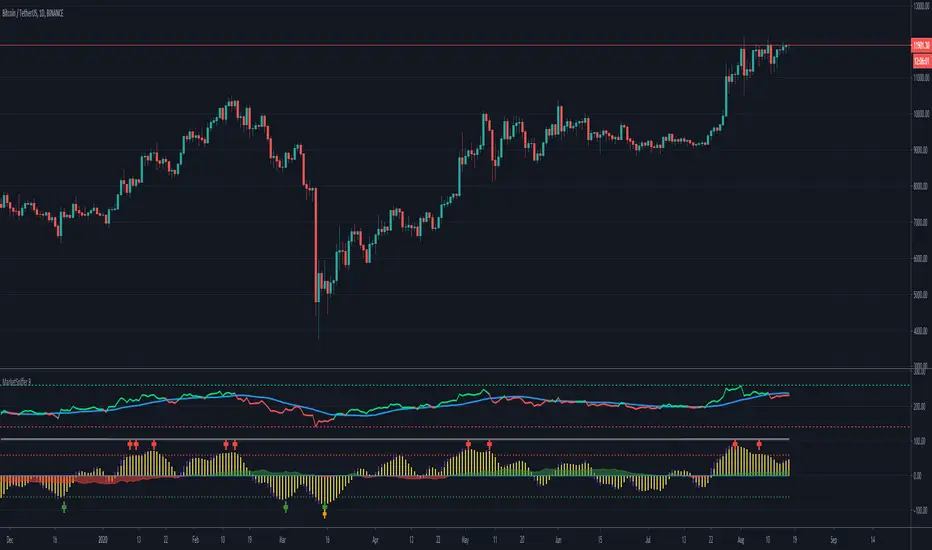
MarketSniffer BMarketSniffer B is a custom made indicator made by 2 friends that combined 2 strategies to make 1 indicator. It can detect good moments to buy and sell based on our strategy.
The indicator gives the same signals als marketsniffer A but has a diffrent way of showing it by using a histogram to make the momentum more clear when a buy / sell signal will be printed.
Marketsniffer B can be used in any market since its for a big part based on momentum. Although we recommend using it in the crypto market since it was tested and mainly made for crypto.
How to use it: MarketSniffer B can be used in many ways, own strategies can be made.
Example strategy: Lower timeframes (anything below the 1d) if the price is trading above the yellow 200 EMA, take the buy signals. If its trading below the 200 ema and you see a sell signal then sell / short
Example strategy: Higher timeframes (anything above the 1d) Any timeframe above the 1d, the 200 ema rule doesn't exist. Any buy signals should be good for taking a spot position. The sell signals therfore are NOT short signals but sell signals. Its just points to take profit from the buy signal.
Example strategy: Divergences and trendlines can be drawn on the waves as strategy. This indicator also had a RSI with EMA that can be used for this.
Its recommended to use the small timeframe signals (anything below 1d) for leverage trading. Any signals above 1day timeframe should be spot trading.
This indicator should be used in combination with MarketSniffer A
Use the link on our profile to get acces to this indicator.
sDEFI Synthetix ExchangeTradingView allows combining/summing up to a maximum of only 10 tickers in its search field. Their support staff suggested I could combine up to 40 by using Pine Script, so here it is, for a specific 'basket' of crypto tokens.
This study displays the combination of price history for Synthetix Exchange’s sDEFI index.
Tokens included in the index are COMP, MKR, KNC, SNX, ZRX, REP, LEND, REN, LRC, BNT, BAL and UMA. You will see the prices only go back as far as July 31st 2020, which is when the most recent of the compilation (UMA) started its trading history on TradingView. (The study can only display prices for days that *all* the tickers were trading.)
The price history will display as a study, below an existing chart. You will need to resize the windows, to see this study at a larger size. (Grab the window border and move it up, once you have added this study to a chart)
Unfortunately you will not be able to interact with it like a normal chart, i.e. drawing trendlines, adding moving averages, notes or annotations, etc.
May I suggest you send a support request to TradingView, asking for them to allow us to enter more than 10 (perhaps up to 40) tickers with + symbol between them, in the search field, which gives a ‘proper’ chart to analyse?
Please note that when publishing this script, I was required to choose a category from a list that does not contain a relevant category. Given that I had to choose something from the list to proceed, I used 'Support and Resistance', since chartists can see S and R levels by looking at this study.
I trust this study is useful for you sDEFI traders.

Scrip Drip v317 (by faken)This Script Is a combination of Moving Averages and Macd.
The green circles show when the pinbar is above the moving average and has a positive macd, and red circles are the opposite.
The upwards/downwards triangles are shown when a candle is on both sides of the ma line, which can indicate a break.
Make sure to watch for a confirmation candle after one of these breaks to make sure it is not a fakeout.
This works well for stocks and crypto, but the timeframes I would recommend are 2/4h for crypto and 1h or lower for stocks, as stocks have more definitive trendlines compared to crypto.
I am still developing it heavily, to find the best entry and exit points.
Thanks for support.

Two Fractals TrendlinesThis study draws a trend line for the last two Bill Williams up-fractals and down-fractals.
Trend line break signals and alerts can optionally be added.

[KY]McClellan Summation Index RSIThis script contains McClellan Summation Index(MSI) and McClellan Oscillator(MO)
(1) What is McClellan Summation Index(MSI)
McClellan Summation Index(MSI) is a breadth indicator derived the McClellan Oscillator(MO),
which is a breadth indicator based on Net Advances (advancing issues less declining issues).
The Summation Index is simply a running total of the McClellan Oscillator values.
To identify the market direction, I prefer to use the relative strength(RSI) of MSI rather than MSI itself
because MSI is a summation so it's difficult to compare with previous market patterns. So I use RSI applied MSI.
Reference: Stockcharts.com has a nice set of detailed explanation about MSI.
school.stockcharts.com
(2) How to use this script
- Add this script to your chart.
- You can choose one of two options ("MSI RSI" or "MO").
- You can also choose the market from three options ("Nasdaq", "NYSE", "Nasdaq+NYSE")
(3) "MSI RSI" or "MO"
a) "MSI RSI"
For swing trade(sevelal weeks), MSI RSI is much better to identify the broad market direction.
I backtested last several years of S&P500. The result was not symmetrical between MT bear/bull market.
For bull side, when MSI RSI curls up from the bottom(e.g. RSI 30 level), 90% of times out of them the market rallied.
For bear side, when MSI RSI rolles over to downside from the top(e.g. RSI 70 level), only 60% of times out of them the market declined.
So the market tends to hit negatively diverrgent high from advancing/declining issues perspective. Be careful to use MSI oscilator.
b) "MO"
For short term trade(intraday, 2-3 days of holding), MO is better because MSI is a summation so lags several days. MO is quick.
MO is sometimes very noisy, so you need to draw trendlines or horizontal levels to compare with the previous cases.
For beginners, I recommend to use "MSI RSI".

Fractal Series History SummaryThis script presents a summarized view of a series by drawing lines between series samples taken at power-of-two intervals from the current value.
The intent is to provide a visualization of trendlines at multiple scales, without having to untangle those that my overlap each other.
It doesn't overlay a price-chart as written; it could, but IMHO that would be redundant. It's intended to augment oscillators and other kinds of indicators that don't necessarily scale with a price chart.
The script does not attempt to provide buy or sell triggers, but rather, to provide a visualization tool and a line-drawing tech-demo.

Fibonacci EMA TrendlinesSimple EMAs based on the Fibs plus the 200 EMA - Default inputs are 8,13, 21, 55, 200. Inspired by Philakones EMAs.

Easy Loot Money MakerEasy Loot Money Maker Script
This indicator uses modified Bollinger Bands & Ichimoku Clouds to generate the best opportunities to buy & sell
Works best on lower timeframes, so if you're a day trader or scalper, this indicator is for you
I recommend using anywhere from 5 minute, 15 minute, 1 hour, to 2 hour timeframe to give you the best opportunities on entry & exit price
Obviously mix in your own technical analysis such as support, resistance, and trendlines in addition to using this indicator to make a decision on whether to buy or sell.
This chart here looking at the 1H chart of S&P500 (SPX), you can clearly see that the indicator called the top as well as these miniature swing highs and lows.
To add this indicator to your chart, simply press the 'like' button and it will be added to your favorites under the 'Indicators' tab at the top of your chart.
Please let me know if you have any questions or concerns regarding this indicator, as well as feedback on using it whilst trading.
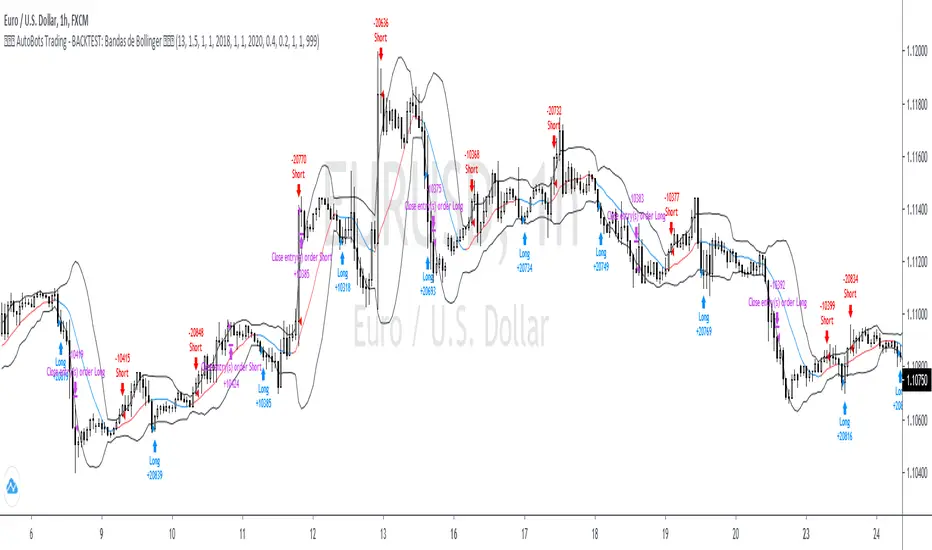
4. AutoBots Trading - BACKTEST: Bollinger BandsBACKTEST: Bollinger Bands
1. Description: a technical analysis tool defined by a set of trendlines plotted two standard deviations (positively and negatively) away from a simple moving average ( SMA ) of a security's price, but which can be adjusted to user preferences.
2. Strategy rules: defined based on the component, signal count, entry prices, open order count, position check, position averages, conditional closes and close signals.
3. Risk management: system was defined based on the choice of only long, only short or both sides. Defining the choice of take profit, stop loss and trailing stos (no repaint).
4. Symbol: EURUSD (only)
5. Suggested Timeframe: 1H
6. Parameter for optimization: 13, 1.5, side: both, tp: 0.4%, sl: 0.2%, ts: na
7. Walk forward simulation
7.1. In sample period: jan/2018-jan/2020
7.2. Out of sample period: jan/2020 - ago/2020
** For purpose educate only
Ehlers Decycler [CC]The Decycler was created by John Ehlers (Cycle Analytics For Traders pgs 40-41) and this is a moving average that has an extremely low lag even though it uses a fairly high length to calculate everything. This can also work well as a trendline. Buy when the indicator line is green and sell when it is red.
Let me know if there are other scripts you would like to see me publish or if you want something custom done!

Market Sniper - Trading/Scalping SuiteWelcome to Market Sniper.
Market sniper is meant to be a suite for trading/scalping alongside my indicators script, RSI, Stochastic and Horizontals.
It is based on over 15 Indicators/Oscillators so there is no need for convoluted charts and constantly changing charts/indicators for a better understanding of the market.
Warnings:
I can't stress this enough! This isn't a magic pill that will transform your illiterate grandmother into an expert trader! This is a very powerful tool whose function is to complement your trading/save time (and yes, with practice be your main trading tool).
This algorithm requires setting up and training to be used correctly, please do not expect to load it up and immediately be scalping the 1s charts.
This algorithm is heavy and might require constant refreshes of the browser on slower computers.
Labels overlap at the moment, working on this part at the moment. So, always zoom in before doing a trade / change the "+- signals in settings"
Candlestick patterns need tweaking, I personally have it off and use my own judgement atm.
What it includes:
Trend reversal / continuation (Macd, Stochastics, money flow , CCI , momentum, DIOSC (automatic trendlines ), SuperTrend, Moving averages, etc, etc.)
RSI divergence drive / drive counter (base code from Libertus, check his profile as he has very helpful scripts)
Bull Market expansions for longterm take profit and increasing position
Candlestick patterns
Trend reversal / Continuation
Green = Bullish reversal
Red = Bearish trend reversal
Orange = Trend continuation / strengthening
Trend Continuation/Strengthening
A warning here, trend strengthening also means that many times the indicators are overextended or close to it
------
The numbers reflect the amount of indicators that are signaling a reversal over the specified period on the settings.
For higher timeframes this setting should be on a lower value and the opposite for lower timeframes.
This works on every market and every timeframe(according to months of my own paper and real trading). Remember that each market/asset/commodity has different soft spots so tweaking, backtesting and present accuracy review should be of maximum priority.
Bull Market expansion phase
Warning:
The indicator purposely does not show any signals during bear markets. It is my opinion bear markets complexity render this tool close to useless.
It was designed to be used in higher timeframes, tough it SEEMS to have a good track record / be useful in lower timeframes.
it will ALWAYS give a fake signal at the end of a bull market because of the very nature of the code.
It is based of EMAs, RSI and Stochastic
Candlestick Patterns
Bullish candlestick patterns:
Hammer
Inverted Hammer
Dragonfly
Gravestone
Bearish candlestick pattern:
Shooting Star
Hanging Man
Gravestone
Dragonfly
RSI divergence drive
- Credit to Libertus for the base code of this section
The green triangle means there are at least 2 drives of valid divergence, yellow for 3 and red for 4+.
The script shows triangles when confirmation candle closes.
You need to know how divergence works to use this section. investopedia can easily get you there.
For cryptos I use 2-4h+ timeframes, for traditional markets I use 15min+ for forex I use it basically in every timeframe.
For questions/suggestions and access PM me in the platform itself and don't forget -> FEEDBACK IS IMPORTANT
Thank you all
