Relative Price Difference [LAVA]EDIT: Look below for updates to the script.
EDIT: After several updates to this script, I think it's safe to say it will work with all timelines. Using hand drawn trendlines, it can predict tops and bottoms with pretty good accuracy.
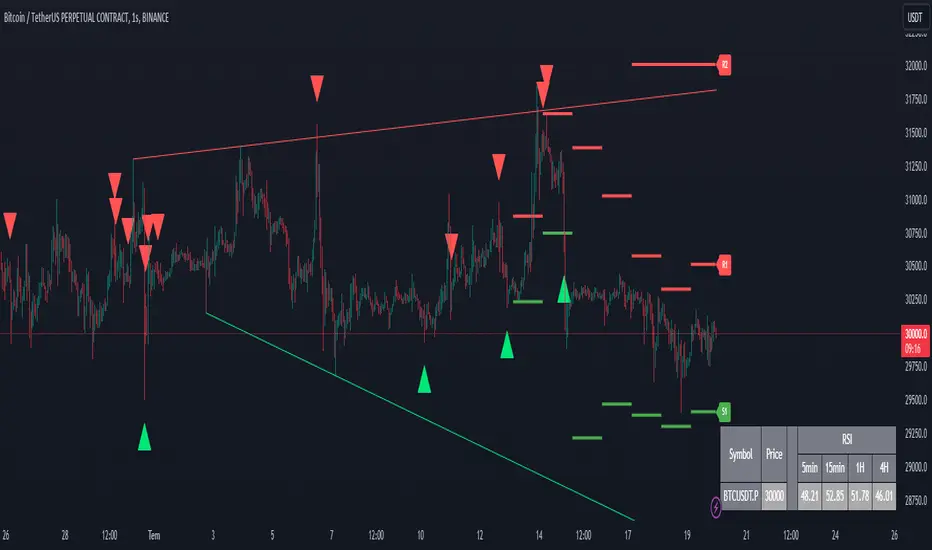
Shows a change in the relative price difference via percentage on a 0 horizontal. Added a bollinger band to help identify weak areas (orange). If orange starts showing, the current price direction is strong but can reverse harshly. If you are in a weak position, exit here. Otherwise, don't enter a trade after/during orange sessions until a full cycle (up/dn > 1% without orange) has completed. The main line indicator fluctuates according to the price difference. 1% horizontal lines are added to help identify profit taking spots or OTE zones. Ensure the 1% line is crossed completely before you decide to enter/exit. Cross points are identified with crosses if you missed your window, this is the last spot to exit, enter. This indicator doesn't work that well with small time intervals. As always, use more than one indicator to ensure your decision is right. (The colors are ugly so change them if you wish! :)
Komut dosyalarını "trendline" için ara
GRASS Purple Cloud [MMD] MTFThis Pine Script code is a trading strategy designed for use on the TradingView platform. It implements a multi-timeframe (MTF) strategy called "GRASS Purple Cloud " that utilizes various technical indicators to generate buy and sell signals. Below is a breakdown of the key components of the script:
Key Components of the Strategy
Inputs:
HTF (Higher Time Frame): Allows the user to select a higher time frame for analysis.
ATR and Supertrend Parameters: Inputs for the Average True Range (ATR) and Supertrend indicator, which are used to determine market volatility and trend direction.
Buying and Selling Pressure Thresholds: These thresholds help define conditions for entering trades based on buying and selling pressure.
Backtest Date Range: Users can specify a date range for backtesting the strategy.
HTF Logic:
The htfLogic function calculates various values based on the selected higher time frame, including buying and selling conditions, which are then used to generate signals.
Signal State Tracking:
The script tracks the state of buy and sell signals using a variable xs, which changes based on the conditions defined in the htfLogic function.
Coloring and Labels:
The bars on the chart are colored green for buy signals and red for sell signals. Additionally, labels are plotted to indicate strong buy and sell signals.
EMA Plotting:
The script includes optional plotting of Exponential Moving Averages (EMAs) for 20, 50, and 200 periods, which can help traders identify trends.
Trade Management:
The strategy includes parameters for take profit (TP) and stop loss (SL) levels, allowing for risk management. The user can specify the percentage for TP and SL, as well as the number of units to sell at each level.
Entries and Exits:
The script defines conditions for entering long and short positions based on the buy and sell signals. It also manages exits based on TP and SL levels.
Trendline Logic:
The script identifies the last two significant highs to draw a trendline, which can help visualize market structure.
TP/SL Plotting:
The script plots the TP and SL levels on the chart for visual reference.
Reset After Exit:
After a trade is closed, the script resets the relevant variables to prepare for the next trade.
Usage
To use this strategy:
Adjust the input parameters as needed for your trading preferences.
Add the strategy to a chart to visualize the signals and performance.
Considerations
As with any trading strategy, it's essential to backtest and validate the performance over historical data before using it in live trading.
Market conditions can change, and past performance is not indicative of future results. Always use risk management practices when trading.

Advanced Volatility Activator [AlgoFuego]🔵 Advanced Volatility Activator (AVA)
The Advanced Volatility Activator (AVA) is an innovative technical analysis indicator designed to help traders identify and react to market volatility.
By blending adaptive volatility metrics with a refined moving‑average algorithm, the indicator offers traders a dynamically responsive framework for trend identification.
🔸Dynamic Volatility Analysis
The indicator examines the high and low prices of each candle to evaluate market movements.
It categorizes price movements into different states (e.g., outside bars, inside bars, higher highs, lower lows) to provide insight into market conditions, then calculates price averages for bars that make a new high or low price.
This moving average serves as a baseline for volatility adjustments, aligning the tool with well-established technical indicators.
🔸 Customizable Sensitivity
Through the input, users can fine‑tune how responsive the moving average is to price fluctuations.
A higher sensitivity setting makes the moving average less responsive to rapid market changes, enabling the indicator to adapt to different market environments and trading styles.
🔸Integrated Multi-Timeframe Table
A distinctive feature of this indicator is its integrated table display, which provides a summary signal across multiple time frames.
This table serves as a quick reference guide for traders to compare market trends across different time periods.
This at‑a‑glance view empowers traders to confirm trend direction from intraday to higher‑timeframe perspectives without switching charts.
🔹 How It Works
1. Initial Setup
The indicator defines two baseline values: the current high and the current low.
These serve as reference points for all subsequent price comparisons and moving‑average calculations.
2. Volatility Smoothing
The indicator calculates the smoothed volatility range using an exponential moving average (EMA) of the absolute differences between successive prices.
This helps smooth out the erratic price movements of the simple moving average and improves the measurement of volatility.
3. Trend Probability Calculation
A Simple Moving Average (SMA) of the combined high‑low series is calculated.
That SMA is then compared against the smoothed volatility range from step 2 to estimate how likely it is that a genuine trend is forming.
4. Directional Counters
Two counters: bullish and bearish, track consecutive moves up or down.
Whichever counter increases more rapidly signals the prevailing market bias.
5. Drawing the Trend Line
Finally, the code generates a trend line that dynamically adapts to real‑time volatility.
The result is a clear, responsive visual that mirrors actual market behavior.
🔹 Visual & Table Customization
Color Coding
Upward and downward trends are easily distinguished by customizable color settings, enhancing visual clarity for decision-making.
Upward Movements
A lighter blue hue indicates an upward trend.
Downward Movements
An orange hue indicates a downward trend.
Candlestick Highlighting
The indicator plots candlesticks with the same trendline color so that the chart maintains a consistent visual theme, thus reinforcing the signal's clarity.
Table Configuration and Customization
This additional layer of information helps traders compare signals between different time horizons, which is essential for a comprehensive multi-timeframe strategy.
The code supports multiple user-defined timeframes (e.g., 15, 60, 240, and 480 minutes).
For each timeframe, the indicator queries the market data to determine if the signal is Bullish, Bearish, or No signal.
Visibility and Positioning
The table can be toggled on or off via a user input. Its position on the chart is also customizable, ranging from top-right to bottom-left, allowing flexibility based on personal chart layouts.
Color Settings
The table cells are populated with both the timeframe labels and the corresponding market signal text (e.g., "Bullish", "Bearish", "No signal"). Background colors for each signal cell change dynamically depending on the current state, making it easy for traders to assess market sentiment at a glance.
Users can adjust colors for the background, borders, and text of the table itself.
Moreover, specific colors are set to denote bullish signals (blue), bearish signals (orange), or no signal (default dark theme).
🔹 How to use
Before entering long trades, ensure that prices are above the Advanced Volatility Activator Line and the line indicates an upward movement.
🔹 Practical Benefits
Enhanced Market Awareness
By highlighting periods of low volatility, the indicator can serve as an early warning system for potential market reversals or breakouts.
The supplementary table offers a high-level overview of these signals across multiple timeframes, which aids in confirming trends or reversals.
Customizable and Versatile
Both the indicator and the table are highly customizable. Traders can fine-tune the sensitivity, adjust periods for the moving average, select color schemes, and choose their preferred timeframes, all allowing for a tool that adapts to various trading styles and market conditions.
Intuitive Visualization
The clearly defined color-coded trendline provides an immediate visual cue, making it easier for traders to interpret market trends at a glance.
Whether you are a short-term trader needing precise entry and exit points or a multi-timeframe analyst looking for broader trend confirmation, this indicator provides valuable insights on both a micro- and macro-level.
🔹 Disclosure
While this indicator is useful and ideally suited for active traders who require precise, customizable signals to navigate rapidly changing markets, it's critical to understand that past performance is not necessarily indicative of future results, and there are many more factors that go into being a profitable trader.

Slark Signal XtremeStrategy Description: Slark Signal Xtreme
The Slark Signal Xtreme is an innovative trading strategy designed to identify and capitalize on market opportunities by leveraging pivots, trend breakouts, and dynamic risk management. This strategy combines day-of-week and time filters with a ticks-based Stop Loss (SL) and Take Profit (TP) system, delivering customized signals and real-time alerts. Ideal for traders seeking a structured and highly customizable approach, Slark Signal Xtreme also incorporates advanced visual tools for efficient trade management.
Key Features:
Pivot- and Breakout-Based Signals: Utilizes pivot detection (highs/lows) combined with an ATR-based slope calculation to pinpoint trend changes and potential entry or exit points.
Dynamic Stop-Loss (SL) and Take-Profit (TP) Levels: Automatically calculates SL and TP based on the entry price and user-defined tick settings, adapting to volatility and optimizing risk management.
Time and Day Filters: Allows you to select specific days of the week and trading sessions during which signals are generated, avoiding low-liquidity periods or unwanted high volatility.
Customizable Risk Management: Lets you define the number of ticks for SL and TP, trading hours, initial capital, pyramiding, and commissions, tailoring the strategy to various risk profiles and assets.
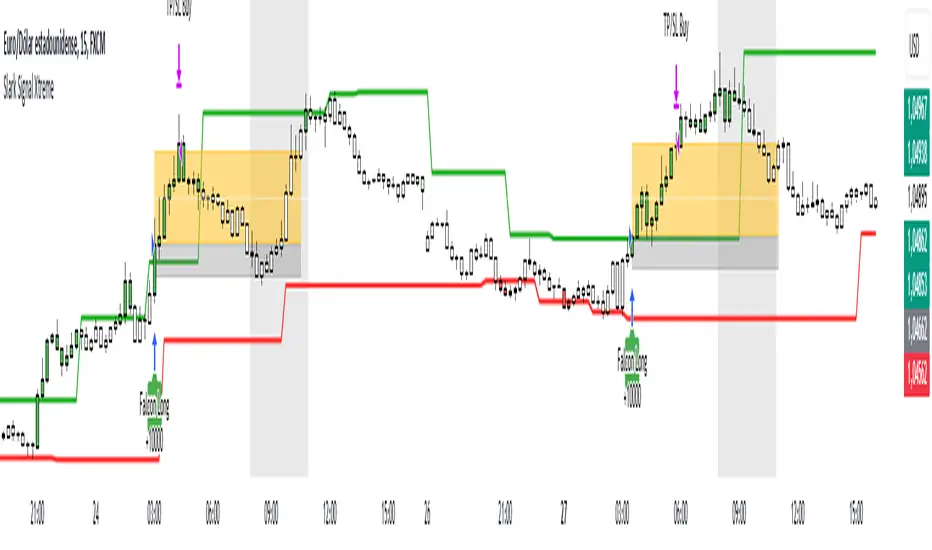
Enhanced Visualization:
- SL and TP Boxes: Displays rectangular boxes on the chart indicating SL and TP levels, streamlining trade management.
- Candle Color Changes: Candles can be colored according to price position relative to pivot lines (bullish, bearish, or neutral).
- Session Highlight: Shades the chart background during the selected trading hours, providing immediate context on when the strategy is active.
Automated Alerts: Generates customizable alerts in TradingView whenever a buy or sell signal is triggered, detailing the timing, instrument, and SL/TP levels.
How the Strategy Works:
Technical Indicator Calculations:
- Pivot High/Low and Slope: Identifies price pivot points and calculates slope (based on ATR) to measure trend strength.
- Time and Day Filters: Signals only trigger within the specified days and hours, helping avoid undesirable market conditions.
Generating Buy and Sell Signals:
- Buy Signal (Long): Activated when price breaks above a downward pivot-based trendline or meets the condition for higher pivots.
- Sell Signal (Short): Activated when price breaks below an upward pivot-based trendline or meets the condition for lower pivots.
- Operation Conditions: Signals are only generated on selected days and during chosen trading hours, avoiding periods of low liquidity or excessive volatility.
Dynamic SL and TP Calculation:
- Stop-Loss (SL) and Take-Profit (TP): Determined by the entry price ± a user-defined number of ticks.
- SL and TP Visualization: Boxes are drawn on the chart from the entry price to SL/TP levels, enabling clear visual reference for trade management.
Order Execution and Alerts:
- Order Execution: When a signal is generated, Slark Signal Xtreme automatically opens a long or short position in TradingView’s backtesting environment.
- Alerts: Customizable alerts can be set up to provide real-time notifications (via TradingView or third-party integrations), offering essential details like instrument, time, SL/TP, etc.
Trade Management and Monitoring:
- Automatic Closure: Each trade is automatically closed upon reaching its SL or TP, ensuring disciplined risk control.
- Trade Summary: TradingView’s built-in reporting tools list all trades with cumulative results, simplifying performance evaluation.
Additional Visualization:
- Candle Coloring by Trend: Candles can be colored bullish, bearish, or neutral based on the pivot-driven trend detection.
- Operational Range Highlighting: The chart background is shaded during the permitted trading hours, clarifying when the strategy is active and enhancing visibility.
---
Strategy Properties (Important)
This backtest was conducted in TradingView under the following configuration:
Initial Capital: 1000 USD
Order Size: 10,000 contracts (adjust according to the traded asset)
Commission: 0.05 USD per order
Slippage: 1 tick
Pyramiding: 1 order
Price Verification for Limit Orders: 0 ticks
Recalculate on Every Tick & On Bar Close: Enabled
Bar Magnifier for Backtesting Precision: Enabled
These properties provide a realistic view of the strategy’s performance. However, default parameters may vary depending on each user or market:
Order Size: Should be calculated according to the asset traded and your desired risk level.
Commission and Slippage: Costs can vary by market and instrument; there is no universal default that guarantees realistic results.
All users are strongly recommended to adjust these properties within the script settings to match their own trading accounts and platforms, ensuring the most accurate backtest results.
---
Backtesting Results:
- Net Profit: +28.70
- Total Trades: 397
- Winning Trades: 138
- Win Rate: 34.76%
- Profit Factor: 1.07
- Sharpe Ratio: 1.25
- Sortino Ratio: 1.45
- Average Bars per Trade: 24
- Average Profit per Trade: 1.45
These numbers provide an overview of the strategy’s historical performance, demonstrating its potential for profitability given appropriate risk management.
---
Interpretation of Results:
- The strategy can be profitable despite a relatively modest win rate, thanks to a suitable risk-reward ratio.
- A profit factor of 1.07 indicates that total profits slightly exceed total losses.
- It is essential to monitor drawdown and ensure it aligns with your personal risk tolerance.
---
Risk Warning:
Trading leveraged financial instruments carries a high level of risk and may not be suitable for all investors. Before trading, carefully consider your investment objectives, experience level, and risk tolerance. Past performance does not guarantee future results. Always perform additional testing and adjust the strategy to your specific needs.
---
What Makes This Strategy Original?
Focus on Pivots and Time/Day Filters: Rather than purely relying on momentum indicators, Slark Signal Xtreme uses pivot-based signals and scheduling filters to capture higher-liquidity, directional market moves.
Dynamic Risk Management: Ticks-based SL/TP and customizable trading sessions enable precise adaptation to various markets and trading styles.
Advanced Visualization Tools: SL/TP boxes, candle coloring, and session highlights streamline market interpretation and facilitate real-time decision-making.
Seamless Alert Integration: Although native TradingView alerts are provided, it can be integrated with third-party messaging services (Telegram, Discord, etc.) for enhanced automation.
---
Additional Considerations
Continuous Testing and Optimization: Regularly backtest and fine-tune parameters (SL, TP, time filters, etc.) to accommodate changing market conditions.
Complementary Analysis: Combine this strategy with other technical or fundamental tools to confirm signals.
Rigorous Risk Management: Ensure SL/TP levels and position sizes conform to your overall risk management plan.
Updates and Support: Future updates and improvements may be released based on community feedback. For questions or suggestions, feel free to reach out.
---
Example Configuration
Assume you want to run Slark Signal Xtreme with these settings:
Trading Days: Monday to Friday
Trading Hours: 8:00 to 11:00 (exchange or broker time)
Stop Loss (SL) in Ticks: 100
Take Profit (TP) in Ticks: 300
SL/TP Box Extension: 20 bars
Initial Capital: 1000 USD
Risk per Trade: 1% of capital
Commissions & Slippage: 0.05 USD commission, 1 tick slippage
---
Conclusion
The Slark Signal Xtreme strategy delivers a robust and adaptable solution by merging pivots, time/day filters, flexible risk parameters, and advanced visualization. Its distinctive and customizable design makes it a powerful resource for traders aiming to diversify their methods and exploit trend breakouts under specific conditions. Fully compatible with TradingView, Slark Signal Xtreme can enhance your trading toolkit and foster a more systematic approach to your operations.
---
Final Disclaimer:
Financial markets are inherently volatile and pose significant risks. This strategy should be employed as part of a comprehensive trading plan and does not guarantee positive outcomes. Always consult a qualified financial advisor before making investment decisions. The use of Slark Signal Xtreme is solely at the user’s discretion, who must evaluate personal risk tolerance and financial objectives.
Gann & Fibonacci Analysis for MSTRYes! Below is a step-by-step guide to performing Gann Analysis on MSTR in TradingView for the last year.
Step 1: Set Up the Chart
Open TradingView and search for MSTR (MicroStrategy).
Select the 1-day (D) timeframe to analyze the past year.
Set your chart to logarithmic scale (⚙ Settings → Scale → Log).
Enable grid lines for alignment (⚙ Settings → Appearance → Grid Lines).
Step 2: Identify Key Highs and Lows (Last Year)
Find the 52-week high and 52-week low for MSTR.
As of now:
52-Week High: ~$999 (March 2024).
52-Week Low: ~$280 (October 2023).
Step 3: Plot Gann Angles
Using TradingView's Gann Fan Tool:
Select "Gann Fan" (Press / and type “Gann Fan” to find it).
Start at the 52-week low (~$280, October 2023) and drag upwards.
Adjust the angles to match key levels:
1x1 (45°) → Main trendline
2x1 (26.5°) → Strong uptrend
4x1 (15°) → Weak trendline
1x2 (63.75°) → Strong resistance
Repeat the process from the 52-week high (~$999, March 2024) downward to see bearish angles.
Step 4: Apply Fibonacci & Gann Retracement Levels
Using Fibonacci Retracement:
Select "Fibonacci Retracement" tool.
Draw from 52-week high ($999) to 52-week low ($280).
Enable key Fibonacci levels:
23.6% ($816)
38.2% ($678)
50% ($640)
61.8% ($550)
78.6% ($430)
Watch for price reactions near these levels.
Using Gann Retracement Levels:
Select "Gann Box" in TradingView.
Draw from 52-week high ($999) to low ($280).
Enable key Gann retracement levels:
12.5% ($912)
25% ($850)
37.5% ($768)
50% ($640)
62.5% ($550)
75% ($480)
87.5% ($350)
Identify confluences with Gann angles and Fibonacci levels.
Step 5: Identify Significant Dates & Time Cycles
Use "Date Range" Tool in TradingView.
Mark major turning points:
High → Low: ~180 days (Half-year cycle).
Low → High: ~90 days (Quarter cycle).
Use Square-Outs (Time = Price method):
Example: If MSTR hit $500, check 500 days from key events.
Mark key anniversaries of past highs/lows for possible reversals.
Step 6: Analyze and Trade Execution
✅ If MSTR is at a Gann angle + Fibonacci level + key date → Expect a reaction.
✅ Use RSI, MACD, and Volume for extra confirmation.
✅ Set Stop-Loss at nearest Gann support/resistance.

Supertrend pro+ (Adaptive ATR) Supertrend Pro+ (Adaptive ATR) - Param Approach
By SKP
Overview
This advanced Supertrend Pro+ strategy improves on the classic Supertrend indicator by integrating an Adaptive ATR, ensuring dynamic volatility adjustments for more accurate trend detection. This strategy filters out false signals using ADX trend strength validation and volume confirmation, making it a powerful tool for trend-following traders.
Key Features
✔ Adaptive ATR Calculation - Dynamically adjusts to market volatility for more reliable Supertrend signals.
✔ ADX Trend Filter - Ensures trades occur only in strong trending markets, avoiding false breakouts.
✔ Volume Confirmation - Prevents trading in low-liquidity conditions by verifying volume strength.
✔ Multi-Timeframe Analysis - Displays Supertrend trends from different timeframes for enhanced trade confidence.
✔ Trailing Stop & Take Profit Options - Allows flexible risk management with stop-loss and profit-targeting mechanisms.
✔ Custom Alerts for Trade Signals - Alerts trigger on confirmed Supertrend buy/sell signals and potential trend shifts.
✔ Max Drawdown Protection - Automatically closes trades if equity drops beyond a set percentage, preventing excessive losses.
How It Works
Adaptive ATR Calculation
Instead of using a fixed ATR, this strategy calculates an adaptive ATR based on a longer-term ATR baseline.
If volatility increases, the ATR expands dynamically, ensuring stop-losses and Supertrend calculations adjust accordingly.
Supertrend Confirmation
Uses an enhanced Supertrend algorithm with adaptive ATR to determine trend direction.
If price crosses above the trendline, it signals a bullish reversal (Buy Signal).
If price crosses below the trendline, it signals a bearish reversal (Sell Signal).
ADX Trend Strength Filter
Trades are only taken when ADX is above the threshold, ensuring entry in strong trending markets.
Volume Confirmation
Uses a relative volume filter to ensure sufficient liquidity before entering trades.
Helps avoid false breakouts in low-volume conditions.
Risk Management
Trailing Stop Loss - Automatically moves the stop as price moves in favor of the trade.
Manual Stop Loss & Take Profit - Allows precise percentage-based exit points.
Max Drawdown Protection - Closes all trades if equity falls below a set threshold, reducing risk.
Multi-Timeframe Supertrend Table
Displays Supertrend signals across different timeframes (1 min, 5 min, 15 min, 1 hour, Daily)
Helps traders align their entries with higher timeframe trends for better accuracy.
Custom Alerts
Alerts notify when a new buy/sell signal appears.
Extra early warning alerts indicate potential trade setups before confirmation.
How to Use
📌 For trend-following traders:
Focus on entries in the direction of the higher timeframes.
Only enter when ADX is trending and volume confirms liquidity.
📌 For scalpers:
Use shorter timeframes (1m, 5m, 15m) for quick trades.
Adjust the ATR multiplier and Adaptive ATR sensitivity for tighter stops.
📌 For swing traders:
Use longer timeframes (1H, Daily) for more stable trends.
Enable trailing stop loss to lock in profits as the trend progresses.
Inputs & Customization
ATR Period & Adaptive ATR Sensitivity
Supertrend Multiplier
ADX Filter & Threshold
Volume Confirmation Settings
Stop Loss & Take Profit Options
Multi-Timeframe Supertrend Display
Custom Alerts

Higher Time Frame Fair Value Gap [ZeroHeroTrading]A fair value gap (FVG) highlights an imbalance area between market participants, and has become popular for technical analysis among price action traders.
A bullish (respectively bearish) fair value gap appears in a triple-candle pattern when there is a large candle whose previous candle’s high (respectively low) and subsequent candle’s low (respectively high) do not fully overlap the large candle. The space between these wicks is known as the fair value gap.
The following script aims at identifying higher timeframe FVG's within a lower timeframe chart. As such, it offers a unique perspective on the formation of FVG's by combining the multiple timeframe data points in the same context.
You can change the indicator settings as you see fit to achieve the best results for your use case.
Features
It draws higher timeframe bullish and bearish FVG's on the chart.
For bullish (respectively bearish) higher timeframe FVG's, it adds the buying (respectively selling) pressure as a percentage ratio of the up (respectively down) volume of the second higher timeframe bar out of the total up (respectively down) volume of the first two higher timeframe bars.
It adds a right extended trendline from the most recent lowest low (respectively highest high) to the top (respectively bottom) of the higher timeframe bullish (respectively bearish) FVG.
It detects and displays higher timeframe FVG's as early as one starts forming.
It detects and displays lower timeframe (i.e. chart's timeframe) FVG's upon confirmation.
It allows for skipping inside first bars when evaluating FVG's.
It allows for dismissing higher timeframe FVG's if there is no update for any period of the chart's timeframe. For instance, this can occur at lower timeframes during low trading activity periods such as extended hours.
Settings
Higher Time Frame FVG dropdown: Selects the higher timeframe to run the FVG detection on. Default is 15 minutes. It must be higher than, and a multiple of, the chart's timeframe.
Higher Time Frame FVG color select: Selects the color of the text to display for higher timeframe FVG's. Default is black.
Show Trend Line checkbox: Turns on/off trendline display. Default is on.
Show Lower Time Frame FVG checkbox: Turns on/off lower timeframe (i.e. chart's timeframe) FVG detection. Default is on.
Show Lower Time Frame FVG color select: Selects the color of the border for lower timeframe (i.e. chart's timeframe) FVG's. Default is white.
Include Inside Bars checkbox: Turns on/off the inclusion of inside first bars when evaluating FVG's. Default is on.
With Consistent Updates checkbox: Turns on/off consistent updates requirement. Default is on.

AuriumFlowAURIUM (GOLD-Weighted Average with Fractal Dynamics)
Aurium is a cutting-edge indicator that blends volume-weighted moving averages (VWMA), fractal geometry, and Fibonacci-inspired calculations to deliver a precise and holistic view of market trends. By dynamically adjusting to price and volume, Aurium uncovers key levels of confluence for trend reversals and continuations, making it a powerful tool for traders.
Key Features:
Dynamic Trendline (GOLD):
The central trendline is a weighted moving average based on price and volume, tuned using Fibonacci-based fast (34) and slow (144) exponential moving average lengths. This ensures the trendline adapts seamlessly to the flow of market dynamics.
Formula:
GOLD = VWMA(34) * Volume Factor + VWMA(144) * (1 - Volume Factor)
Fractal Highs and Lows:
Detects pivotal market points using a fractal lookback period (default 5, odd-numbered). Fractals identify local highs and lows over a defined window, capturing the structure of market cycles.
Trend Background Highlighting:
Bullish Zone: Price above the GOLD line with a green background.
Bearish Zone: Price below the GOLD line with a red background.
Buy and Sell Alerts:
Generates actionable signals when fractals align with GOLD. Bullish fractals confirm continuation or reversal in an uptrend, while bearish fractals validate a downtrend.
The Math Behind Aurium:
Volume-Weighted Adjustments:
By integrating volume into the calculation, Aurium dynamically emphasizes price levels with greater participation, giving traders insight into zones of institutional interest.
Formula:
VWMA = EMA(Close * Volume) / EMA(Volume)
Fractal Calculations:
Fractals are identified as local maxima (highs) or minima (lows) based on the surrounding bars, leveraging the natural symmetry in price behavior.
Fibonacci Relationships:
The 34 and 144 EMA lengths are Fibonacci numbers, offering a natural alignment with price cycles and market rhythms.
Ideal For:
Traders seeking a precise and intuitive indicator for aligning with trends and detecting reversals.
Strategies inspired by Bill Williams, with added volume and fractal-based insights.
Short-term scalpers and long-term trend-followers alike.
Unlock deeper market insights and trade with precision using Aurium!

Strength of Divergence Across Multiple Indicators (+CMF&VWMACD)Modified Version of Strength of Divergence Across Multiple Indicators by reees
Purpose:
This Pine Script indicator is designed to identify and evaluate the strength of bullish and bearish divergences across multiple technical indicators. Divergences occur when the price of an asset is moving in one direction while a technical indicator is moving in the opposite direction, potentially signaling a trend reversal.
Key Features:
1. Multiple Indicator Support: The script now analyzes divergences for the following indicators:
* RSI (Relative Strength Index)
* OBV (On-Balance Volume)
* MACD (Moving Average Convergence/Divergence)
* STOCH (Stochastic Oscillator)
* CCI (Commodity Channel Index)
* MFI (Money Flow Index)
* AO (Awesome Oscillator)
* CMF (Chaikin Money Flow) - Newly added
* VWMACD (Volume-Weighted MACD) - Newly added
2. Customizable Divergence Parameters:
* Bullish/Bearish: Enable or disable the detection of bullish and bearish divergences independently.
* Regular/Hidden: Detect both regular and hidden divergences (hidden divergences can indicate trend continuation).
* Broken Trendline Exclusion: Optionally ignore divergences where the trendline connecting price pivots is broken by an intermediate pivot.
* Pivot Lookback Periods: Adjust the number of bars used to identify valid pivot highs and lows for divergence calculations.
* Weighting: Assign different weights to regular vs. hidden divergences and to the relative change in price vs. the indicator.
3. Indicator-Specific Settings:
* Weight: Each indicator can be assigned a weight, influencing its contribution to the overall divergence strength calculation.
* Extreme Value: Define a threshold above which an indicator's divergence is considered "extreme," giving it a higher strength rating.
4. Divergence Strength Calculation:
* For each indicator, the script calculates a divergence "degree" based on the magnitude of the divergence and the user-defined weightings.
* The total divergence strength is the sum of the individual indicator divergence degrees.
* Strength is categorized as "Extreme," "Very strong," "Strong," "Moderate," "Weak," or "Very weak."
5. Visualization:
* Divergence Lines: The script draws lines on the chart connecting the price and indicator pivots that form a divergence (optional, with customizable transparency).
* Labels: Labels display the total divergence strength and a breakdown of each indicator's contribution. The size and visibility of labels are based on the strength.
6. Alerts:
* The script can generate alerts when the total divergence strength exceeds a user-defined threshold.
New Indicators (CMF and VWMACD):
* Chaikin Money Flow (CMF):
* Purpose: Measures the buying and selling pressure by analyzing the relationship between price, volume, and the accumulation/distribution line.
* Divergence: A bullish CMF divergence occurs when the price makes a lower low, but the CMF makes a higher low (suggesting increasing buying pressure). A bearish divergence is the opposite.
* Volume-Weighted MACD (VWMACD):
* Purpose: Similar to the standard MACD but uses volume-weighted moving averages instead of simple moving averages, giving more weight to periods with higher volume.
* Divergence: Divergences are interpreted similarly to the standard MACD, but the VWMACD can be more sensitive to volume changes.
How It Works (Simplified):
1. Pivot Detection: The script identifies pivot highs and lows in both price and the selected indicators using the specified lookback periods.
2. Divergence Check: For each indicator:
* It checks if a series of pivots in price and the indicator are diverging (e.g., price makes a lower low, but the indicator makes a higher low for a bullish divergence).
* It calculates the divergence degree based on the difference in price and indicator values, weightings, and whether it's a regular or hidden divergence.
3. Strength Aggregation: The script sums up the divergence degrees of all enabled indicators to get the total divergence strength.
4. Visualization and Alerts: It draws lines and labels on the chart to visualize the divergences and generates alerts if the total strength exceeds the set threshold.
Benefits:
* Comprehensive Divergence Analysis: By considering multiple indicators, the script provides a more robust assessment of potential trend reversals.
* Customization: The many adjustable parameters allow traders to fine-tune the script to their specific trading style and preferences.
* Objective Strength Evaluation: The divergence strength calculation and categorization offer a more objective way to evaluate the significance of divergences.
* Early Warning System: Divergences can often precede significant price movements, making this script a valuable tool for anticipating potential trend changes.
* Volume Confirmation: The inclusion of CMF and VWMACD add volume-based confirmation to the divergence signals, potentially increasing their reliability.
Limitations:
* Lagging Indicators: Most of the indicators used are lagging, meaning they are based on past price data. Divergences may sometimes occur after a significant price move has already begun.
* False Signals: No indicator is perfect, and divergences can sometimes produce false signals, especially in choppy or ranging markets.
* Subjectivity: While the script aims for objectivity, some settings (like weightings and extreme values) still involve a degree of subjective judgment.

Bollinger Bands Adjusted for VolatilityDescription:
The Bollinger Bands Adjusted for Volatility is an advanced technical indicator designed to combine the precision of smoothed Bollinger Bands with the adaptability of linear regression for volatility analysis. This tool offers traders a dynamic way to visualize market trends while accounting for recent price movements and fluctuations in volatility.
Core Functionality:
Exponential Moving Average (EMA):
The indicator begins by calculating an Exponential Moving Average (EMA) over a user-defined period. This serves as the foundational trendline, smoothing out short-term fluctuations to highlight the overall trend.
Linear Regression Smoothing:
To account for price trends with greater precision, a Linear Regression line is calculated over a specified period.
The linear regression output is further smoothed using an EMA, ensuring a responsive yet stable representation of the price trend.
Standard Deviation and Volatility:
The indicator computes the standard deviation of the closing prices over the EMA period, dynamically capturing market volatility.
This measure of volatility is then integrated into the calculation of the upper and lower bands.
Smoothed Bollinger Bands:
The upper and lower bands are constructed by adjusting the smoothed linear regression line with the standard deviation, scaled by a user-defined multiplier.
This approach adapts to changing market conditions, offering a more nuanced view compared to traditional Bollinger Bands.
Visual Components:
EMA Line (Blue): A stable trendline that reflects the underlying market direction.
Upper Band (Red): Represents the upper boundary, adjusted for volatility and smoothed by linear regression.
Lower Band (Green): Marks the lower boundary, providing a measure of support based on volatility.
Band Fill (Shaded Area): A dynamic fill between the upper and lower bands for enhanced visualization of the price range.
Advanced Concepts:
Volatility-Responsive Bands:
By integrating the standard deviation into the bands and smoothing with linear regression, the indicator reacts effectively to market dynamics, widening during high volatility and contracting during low volatility.
Trend Adaptation:
The smoothed linear regression ensures that the bands align closely with the prevailing market trend, reducing noise and improving accuracy.
Applications:
Trend Identification:
Use the EMA and the central smoothed linear regression to identify the primary trend.
Observe price interaction with the upper and lower bands for potential trend continuations or reversals.
Volatility-Based Strategies:
Monitor band expansions and contractions to gauge shifts in market volatility.
Trade breakouts or reversals when the price breaches the bands under extreme conditions.
Support and Resistance:
The upper and lower bands act as dynamic support and resistance levels, adapting to the current market environment.
Disclaimer:
This indicator is provided for informational and educational purposes only. It does not constitute financial advice. Users should exercise caution and perform their own analysis when making trading decisions.

Buy vs Sell VolumeHow It Works:
BuyVol: Estimates buying volume by calculating the proportion of volume attributed to the upward price movement within each bar.
SellVol: Estimates selling volume by calculating the proportion of volume attributed to the downward price movement within each bar.
Customization:
length: You can adjust the length input parameter to change the period over which the average is calculated.
Visualization:
The buy trendline is plotted in Green and represents the average net buying vs. selling volume over the specified period.
The sell trendline is plotted in Red and represents the average net selling vs. buying volume over the specified period.
Note: This script provides an approximation and should be used in conjunction with other analysis tools to make informed trading decisions.

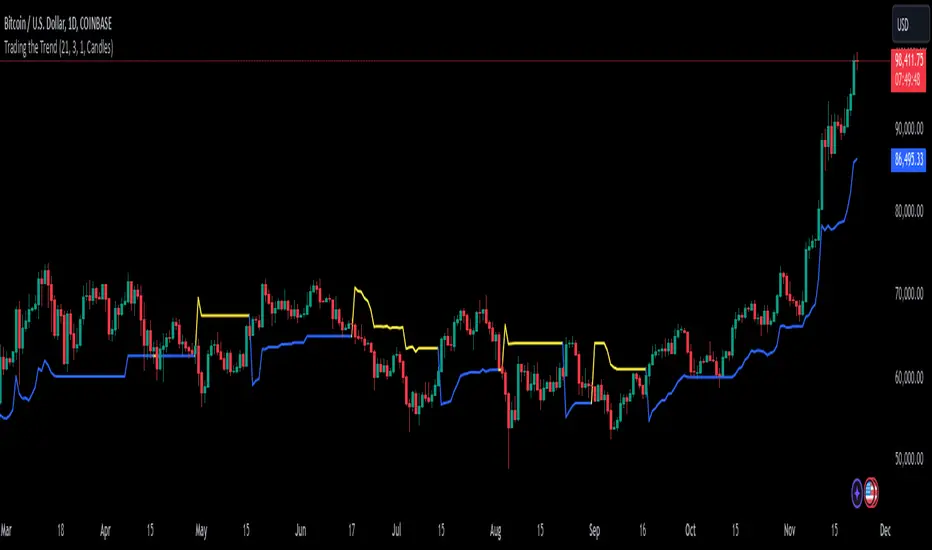
Trading the TrendTrading the Trend Indicator by Andrew Abraham (TASC, 1998)
The Trading the Trend indicator, developed by Andrew Abraham, combines volatility and trend-following principles to identify market direction. It uses a 21-period weighted average of the True Range (ATR) to measure volatility and define uptrends and downtrends.
Calculation: The True Range (highest high minus lowest low) is smoothed using a 21-period weighted moving average. This forms the basis for the trend filter, setting dynamic thresholds for trend identification.
Uptrend: Higher highs are confirmed when price stays above the upper threshold, signaling long opportunities.
Downtrend: Lower lows are identified when price stays below the lower threshold, favoring short positions.
This system emphasizes trading only in the direction of the prevailing trend, filtering out market noise and focusing on sustained price movements.
The trendline changes her color. When there is an uptrend the trendline is blue and when the trend is downward the trendline is yellow.
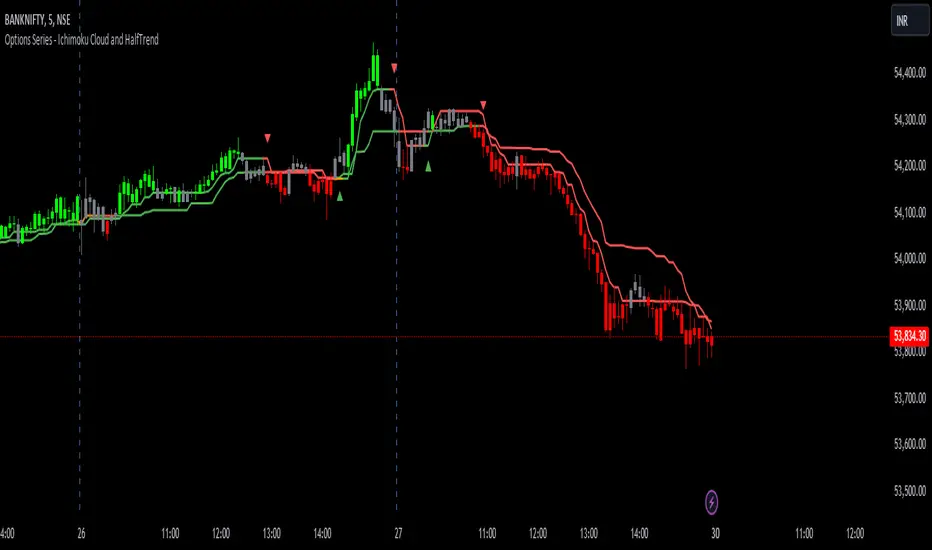
Options Series - Ichimoku Cloud and HalfTrend
The provided script combines two powerful technical indicators, Ichimoku Cloud and HalfTrend, to create a hybrid trading tool. Here's an analysis of the key components and how they work together:
Ichimoku Cloud and HalfTrend
⭐ 1. Indicator Title and Settings:
The script sets the title as "Options Series - Ichimoku Cloud and HalfTrend" and uses the overlay=true option to display the indicators directly on the price chart.
⭐ 2. Color Definitions:
Several colors are defined for later use:
Green and Red for different types of candles and signals.
Fluorescent Colors for highlighting significant trends or changes in market conditions.
⭐ 3. Ichimoku Cloud Setup:
The Ichimoku Cloud is a comprehensive indicator used to identify support, resistance, and trend direction. Here’s how the script configures it:
Conversion Periods, Base Periods, Lagging Span 2 Periods, and Displacement are customizable via input options, giving flexibility to adjust Ichimoku settings based on different market conditions.
The function donchian(len) calculates the Donchian Channel average, which is used to define the Conversion Line and Base Line. The crossover of these lines is crucial in determining bullish or bearish trends.
Color Logic for Kijun Cross: If the Conversion Line is above the Base Line, the trend is bullish (green color), while a bearish trend is indicated by red. A neutral condition is marked with orange.
⭐ 4. HalfTrend Indicator Setup:
The HalfTrend indicator detects trend reversals based on high/low price deviations from a moving average:
Amplitude and Channel Deviation inputs allow users to control the sensitivity of the indicator.
showArrows and showChannels toggle the display of buy/sell arrows and trend channels.
maxLowPrice and minHighPrice variables are initialized to track significant high/low points during the trend, used to confirm trend reversals.
⭐ 5. ATR and Trend Calculations:
The Average True Range (ATR) is used to calculate the volatility-based channels. The script calculates atr2 and uses this to create atrHigh and atrLow for plotting the channel.
The trend detection logic is as follows:
When the trend is upward, the script seeks confirmation by comparing the high moving average with previous lows, signaling a continuation of the uptrend if it holds.
Conversely, a downtrend is confirmed when the low moving average exceeds previous highs.
⭐ 6. Customized Candle Coloring:
A custom color scheme is applied to candles based on a combination of trend direction and Ichimoku Cloud signals:
GreenFluorescent for strong bullish conditions where price is above the HalfTrend line, and the Conversion Line is above the Base Line.
RedFluorescent for strong bearish conditions, with price below the HalfTrend line and Conversion Line below the Base Line.
Gray for neutral or indecisive conditions.
⭐ 7. Plots and Shapes:
The script plots various elements:
HalfTrend Line: The main trendline is plotted in either green (buy) or red (sell), with adjustable line width.
Ichimoku Base Line: This is plotted with the dynamic color based on crossovers.
Buy/Sell Arrows: These are drawn on the chart when valid buy/sell conditions are met.
Custom Candles: The script overrides default chart candles with custom-colored candles based on the previously discussed logic.
⭐ 8. Improvements:
Optimization: Parameters like the amplitude, channel deviation, and Ichimoku periods can be fine-tuned based on backtesting results to maximize performance for specific assets or timeframes.
Alerts: The script could be enhanced by adding alert conditions for real-time buy/sell notifications, leveraging alertcondition() in Pine Script.
In summary, this script merges two trend-following techniques for a multi-faceted view of the market, using visual cues and trendline logic to provide a robust trading tool.
🚀 Conclusion:
Trend-Following System: The combination of Ichimoku Cloud and HalfTrend provides a comprehensive view of both long-term trends (via Ichimoku) and shorter-term reversals (via HalfTrend).
Visual Signals: The script includes clear visual signals (arrows and custom-colored candles) to help traders quickly spot buy/sell opportunities.
Dynamic Customization: Through user inputs, this indicator can be tailored to different market conditions, making it versatile.
Linear Regression InterceptLinear Regression Intercept (LRI) is a statistical method used to forecast future values based on past data. Financial markets frequently employ it to identify the underlying trend and determine when prices are overextended. Linear regression utilizes the least squares method to create a trendline by minimizing the distance between observed price data and the line. The LRI indicator calculates the intercept of this trendline for each data point, providing insights into price trends and potential trading opportunities.
Calculation and Interpretation of the LRI
The linear regression intercept is calculated using the following formula:
LRI = Y - (b * X)
Where Y represents the dependent variable (price), b is the slope of the regression line, and X is the independent variable (time). To determine the slope b, you can use the formula:
b = Σ / Σ(X - X_mean)^2
Once you have computed the LRI, it can be interpreted as the point at which the regression line intersects the Y-axis (price) when the independent variable (time) is zero. A positive LRI value indicates an upward trend, while a negative value suggests a downward trend. Traders can adjust the parameters of the LRI by modifying the period over which the linear regression is computed, which can impact the indicator’s sensitivity to recent price changes.
How to Use the LRI in Trading
To effectively use the LRI in trading, traders should consider the following:
Understanding the signals generated by the technical indicator: A rising LRI suggests an upward trend, whereas a falling LRI indicates a downward trend. Traders may use this information to help determine the market’s direction and identify reversals.
Combining the technical indicator with other indicators: The LRI can be used in conjunction with other technical indicators, such as moving averages, the Relative Strength Index (RSI), or traditional linear regression lines, to obtain a more comprehensive view of the market. In the case of traditional linear regression lines, the LRI helps traders identify the starting point of the trend, providing additional context to the overall trend direction.
Using the technical indicator for entry and exit signals: When the LRI crosses above or below a specific threshold, traders may consider it a potential entry or exit point. For example, if the LRI crosses above zero, it might signal a possible buying opportunity.
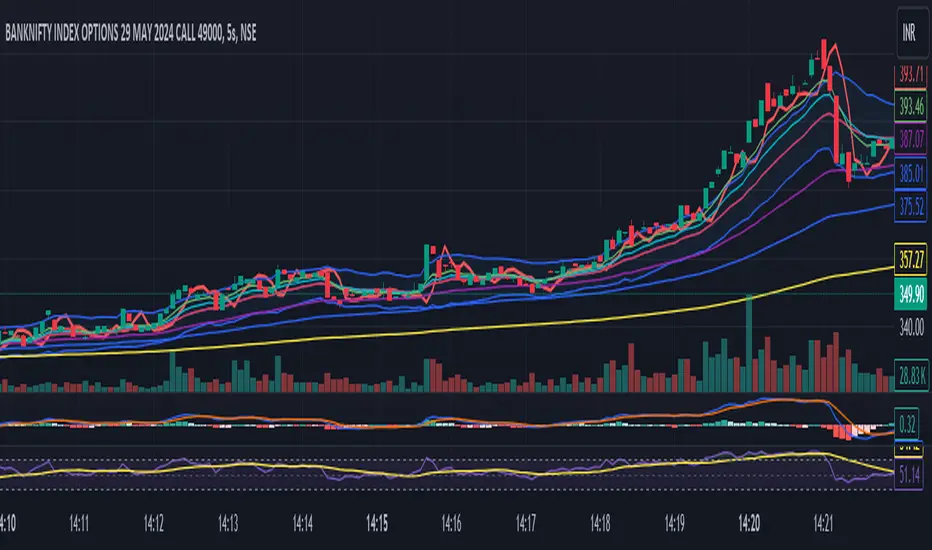
Pro Signal by AutobotPurpose: This custom TradingView indicator is designed to generate buy and sell signals while combining volume analysis, trend following, and volatility considerations. It aims to increase the reliability of signals and potentially reduce trades taken in choppy, ranging markets.
Key Components:
Volume Delta and Delta Volume: The script measures positive and negative changes in volume, using thresholds to identify significant volume surges.
MACD: The classic Moving Average Convergence Divergence indicator is incorporated to help confirm the overall trend direction and look for potential reversals.
Trendline (SMA): A simple moving average trendline helps visualize the dominant price direction and acts as a support/resistance level for trade decisions.
ATR Range Filter: The Average True Range is used to identify periods of low volatility. Trade signals are suppressed during these periods to reduce whipsaws typical in ranging markets.
How to Use:
Apply to Chart: Add the indicator to your desired chart in TradingView.
Customize: Adjust the input parameters for MACD lengths, trendline length, volume thresholds, and ATR settings to match your trading style and the asset being analyzed.
Signal Key: You can input any letters or number as you wish but make sure that you also apply this same Signal Key to your Autobot Trading.
TradingView Alerts: Configure alerts to receive notifications when buy/sell signals occur. These alerts can include potential trade direction and symbol information.
Important Notes:
Not a Standalone System: This indicator is best used as one tool within a broader trading strategy. Combine it with other technical indicators, fundamental analysis, and sound risk management practices.
Backtest and Optimize: Thoroughly backtest the indicator on historical data and experiment with different settings to determine its effectiveness on your chosen assets and timeframes.
Let me know if you'd like any specific sections elaborated on or if you have further customization ideas!

GKD-M Stepped Baseline Optimizer [Loxx]The Giga Kaleidoscope GKD-M Stepped Baseline Optimizer is a Metamorphosis module included in the "Giga Kaleidoscope Modularized Trading System."
█ Introduction
The GKD-M Stepped Baseline Optimizer is an advanced component of the Giga Kaleidoscope Modularized Trading System (GKD), designed to enhance trading strategy development by dynamically optimizing Baseline moving averages. This tool allows traders to evaluate over 65 moving averages, adjusting them across multiple periods to identify which settings yield the highest win rates for their trading strategies. The optimizer systematically tests these moving averages across specified timeframes and intervals, offering insights into net profit, total closed trades, win percentages, and other critical metrics for both long and short positions. Traders can define the initial period and incrementally adjust this value to explore a wide range of periods, thus fine-tuning their strategies with precision. What sets the GKD-M Stepped Baseline Optimizer apart is its unique capability to adapt the baseline moving average according to the highest win rates identified during backtesting, at each trading candle. This win-rate adaptive approach ensures that the trading system is always aligned with the most effective period settings for the selected moving average, enhancing the system's overall performance. Moreover, the 'stepped' aspect of this optimizer introduces a filtering process based ons, significantly reducing market noise and ensuring that identified trends are both significant and reliable. This feature is critical for traders looking to mitigate the risks associated with volatile market conditions and to capitalize on genuine market movements.In essence, the GKD-M Stepped Baseline Optimizer is tailored for traders who utilize the GKD trading system, offering a sophisticated tool to refine their baseline indicators dynamically, ensuring that their trading strategies are continuously optimized for maximum efficacy.
**the backtest data rendered to the chart above uses $5 commission per trade and 10% equity per trade with $1 million initial capital. Each backtest result for each ticker assumes these same inputs. The results are NOT cumulative, they are separate and isolated per ticker and trading side, long or short**
█ Core Features
Stepped Baseline for Noise Reduction
One of the hallmark features of the GKD-M Stepped Baseline Optimizer is its stepped baseline capability. This advanced functionality employs volatility filters to refine the selection of moving averages, significantly reducing market noise. The optimizer ensures that only substantial and reliable trends are considered, eliminating the false signals often caused by minor price fluctuations. This stepped approach to baseline optimization is critical for traders aiming to develop strategies that are both resilient and responsive to genuine market movements.
Dynamic Win Rate Adaptive Capability
Another cornerstone feature is the optimizer’s dynamic win rate adaptive capability. This unique aspect allows the optimizer to adjust the moving average period settings in real-time, based on the highest win rates derived from backtesting over a predefined range. At every trading candle, the optimizer evaluates a comprehensive set of backtesting data to ascertain the optimal period settings for the moving average in use. To perform the backtesting, the trader selects an initial period input (default is 60) and a skip value that increments the initial period input up to seven times. For instance, if a skip value of 5 is chosen, the Baseline Optimizer will run the backtest for the selected moving average on periods such as 60, 65, 70, 75, and so on, up to 90. If the user selects an initial period input of 45 and a skip value of 2, the Baseline Optimizer will conduct backtests for the chosen moving average on periods like 45, 47, 49, 51, and so forth, up to 57. The GKD-M Stepped Baseline Optimizer then exports the baseline with the highest cumulative win rate per candle to any baseline-enabled GKD backtest. This ensures that the baseline indicator remains continually aligned with the most efficacious parameters, dynamically adapting to changing market conditions.
Comprehensive Moving Averages Evaluation
The optimizer’s ability to test over 65 different moving averages across multiple periods stands as a testament to its comprehensive analytical capability. Traders have the flexibility to explore a wide array of moving averages, from traditional ones like the Simple Moving Average (SMA) and Exponential Moving Average (EMA) to more complex types such as the Hull Moving Average (HMA) and Adaptive Moving Average (AMA). This extensive evaluation allows traders to pinpoint the moving average that best aligns with their trading strategy and market conditions, further enhancing the system’s adaptability and effectiveness.
Volatility Filtering and Ticker Volatility Types
Incorporating a wide range of volatility types, including the option to utilize external volatility tickers like the VIX for filtering, adds another layer of sophistication to the optimizer. This feature allows traders to calibrate their baseline according to externals, providing an additional dimension of customization. Whether using standard deviation, ATR, or external volatility indices, traders can fine-tune their strategies to be responsive to the broader market sentiment and volatility trends.
█ Key Inputs
Baseline Settings
• Baseline Source: Determines the price data (Open, High, Low, Close) used for moving average calculations.
• Baseline Period: The starting period for moving average calculation.
• Backtest Skip: Incremental steps for period adjustments in the optimization process.
• Baseline Filter Type: Selection from over 65 moving averages for baseline calculation.
Volatility and Filter Settings
• Price Filter Type & Moving Average Filter Type: Defines thement applied to the price or the moving average, enhancing filter specificity.
• Filter Options: Allows users to select the application area of the volatility filter (price, moving average, or both).
• Filter Multiplier & Period: Configures the intensity and temporal scope of the filter, fine-tuning sensitivity to market volatility.
Backtest Configuration
• Window Period: Specifies the length of the backtesting window in days.
• Backtest Type: Chooses between a fixed window or cumulative data approach for backtesting.
• Initial Capital, Order Size, & Type: Sets the financial parameters for backtesting, including starting equity and the scale of trades.
• Commission per Order: Accounts for trading costs within backtest profitability calculations.
Date and Time Range
• From/Thru Year/Month/Day: Defines the historical period for strategy testing.
• Entry Time: Specifies the time frame during which trades can be initiated, crucial for strategies sensitive to market timing.
Volatility Measurements for Goldie Locks Volatility Qualifiers
• Mean Type & Period: Chooses the moving average type and period for volatility assessment.
• Inner/Outer Volatility Qualifier Multipliers: Adjusts the boundaries for volatility-based trade qualification.
• Activate Qualifier Boundaries: Enables or disables the upper and lower volatility qualifiers.
Advanced Volatility Inputs
• Volatility Ticker Selection & Trading Days: Incorporates external volatility indices (e.g., VIX) into the strategy, adjusting for market volatility.
• Static Percent, MAD Internal Filter Period, etc.: Provides fixed or adaptive volatility thresholds for filtering.
UI Customization
• Baseline Width & Table Display Options: Customizes the visual representation of the baseline and the display of optimization results.
• Table Header/Content Color & Text Size: Enhances readability and user interface aesthetics.
Export Options
• Export Data: Selects the specific metric to be exported from the script, such as net profit or average profit per trade.
Moving Average Specific Parameters
Specific inputs tailored to the characteristics of selected moving averages (e.g., Fractal Adjusted (FRAMA), Least Squares Moving Average (LSMA), T3, etc.), allowing users to fine-tune the behavior of these averages based on unique formula requirements.
█ Indicator UI
• Long and Short Baselines: The optimizer differentiates trends through two distinct baselines: a green line for long (uptrend) baselines and a red line for short (downtrend) baselines. These baselines alternate activation based on the current trend direction as determined by the moving average plus length combination for the candle in view.
Ambiguity in market direction, when an uptrend and downtrend are concurrently indicated, is visually represented by yellow lines.
• Stepping Mechanism for Trend Visualization: Adjusting the source input and the moving average output based on volatility, the indicator exhibits a stepped appearance on the chart. This mechanism ensures that only substantial market movements, surpassing a specified volatility threshold, are recognized as trend changes.
Stepping Activated
• Goldilocks Zone: Beyond the long and short baselines, the Goldilocks zone introduces a distinct moving average that closely follows the selected price or source input, aiming to strike the perfect balance between not too much and not too little market movement for trading. The upper limit of the Goldilocks zone indicates a market stretch too far for advantageous trading (overextension), while the lower limit suggests inadequate market movement for entry (underextension). Trading within the Goldilocks zone is deemed optimal, as it signifies sufficient but not excessive volatility for entering trades, aligning with either the long or short baseline recommendations. Moreover, the mean of the Goldilocks zone serves as a critical indicator, offering a median reference point that aligns closely with the market's current state. This mean is pivotal for traders, as it represents a 'just right' condition for market entry, embodying the essence of the Goldilocks principle in financial trading strategies.
• Signal Indicators and Entry Points: The chart includes with green or red dots to signify valid price points within the Goldilocks zone, indicative of conducive trading conditions. Furthermore, small directional arrows at the chart's bottom highlight potential long or short entry points, validated by the Goldilocks zone's parameters.
• Data Table: A table presenting real-time statistics from the current candle backward through the chosen range offers insights into win rates and other relevant data, aiding in informed decision-making. This table adapts with each new candle, highlighting the most favorable win rates for both long and short positions.
█ Optimizing Strategy with Backtesting
Optimizing a trading strategy with backtesting involves rigorously testing the strategy on historical data to evaluate its performance and robustness before applying it in live markets. The GKD-M Stepped Baseline Optimizer incorporates advanced backtesting capabilities, offering both cumulative and rolling window types of backtests. Here's how each backtest type operates and the insights they provide for refining trading strategies:
Cumulative Backtest
• Overview: A cumulative backtest evaluates a strategy's performance over a continuous period without resetting the strategy parameters or the simulated trading capital at the beginning of each new period.
• Utility: This type is useful for understanding a strategy's long-term viability, assessing how it adapts to different market conditions over an extended timeframe.
• Interpreting Statistics: Cumulative backtest results often focus on overall return, drawdowns, win rate, and the Sharpe ratio. A strategy with consistent returns, manageable drawdowns, a high win rate, and a favorable Sharpe ratio is considered robust.
Rolling Window Backtest
• Overview: Unlike the cumulative approach, a rolling window backtest divides the historical data into smaller, overlapping or non-overlapping periods (windows), running the strategy separately on each. After each window, the strategy parameters and simulated trading capital are reset.
• Utility: This method is invaluable for assessing a strategy's consistency and adaptability to various market phases. It helps identify if the strategy's performance is dependent on specific market conditions.
• Interpreting Statistics: For rolling window backtests, consistency is key. Look for similar performance metrics (returns, drawdowns, win rate) across different windows. Variability in performance indicates sensitivity to market conditions, suggesting the need for strategy adjustments.
Strategy Refinement Through Backtest Statistics
• Net Profit and Loss: Measures the strategy’s overall effectiveness. Consistent profitability across different market conditions is a positive indicator.
• Win Rate and Profit Factor: High win rates and profit factors indicate a strategy's efficiency in capturing gains over losses.
• Average Profit per Trade: Understanding the strategy's ability to generate profit on a per-trade basis can highlight its operational efficiency.
• Average Number of Bars in Trade: This metric helps understand the strategy's market exposure and timing efficiency.
█ Exporting Data and Integration with GKD Backtests
The GKD-M Stepped Baseline Optimizer seamlessly integrates with the broader GKD trading system, allowing traders to export the optimization data and leverage it within the various GKD backtest modules. This feature allows users to forward the GKD-M Stepped Baseline Optimizer adaptive signals to a GKD backtest to be used as a Baseline component in a GKD trading system.
█ Moving Averages included in the Stepped Baseline Optimizer
The GKD-M Stepped Baseline Optimizer incorporates an extensive array of over 65 moving averages, each with unique characteristics and implications for trading strategy development. This comprehensive suite enables traders to conduct nuanced analysis and optimization, ensuring the selection of the most effective moving average for Baseline input into their GKD trading system.
Adaptive Moving Average - AMA
ADXvma - Average Directional Volatility Moving Average
Ahrens Moving Average
Alexander Moving Average - ALXMA
Coral
Deviation Scaled Moving Average - DSMA
Donchian
Double Exponential Moving Average - DEMA
Double Smoothed Exponential Moving Average - DSEMA
Double Smoothed FEMA - DSFEMA
Double Smoothed Range Weighted EMA - DSRWEMA
Double Smoothed Wilders EMA - DSWEMA
Double Weighted Moving Average - DWMA
Ehlers Optimal Tracking Filter - EOTF
Exponential Moving Average - EMA
Fast Exponential Moving Average - FEMA
Fractal Adaptive Moving Average - FRAMA
Generalized DEMA - GDEMA
Generalized Double DEMA - GDDEMA
Geometric Mean Moving Average
Hull Moving Average (Type 1) - HMA1
Hull Moving Average (Type 2) - HMA2
Hull Moving Average (Type 3) - HMA3
Hull Moving Average (Type 4) - HMA4
IE/2 - Early T3 by Tim Tilson
Integral of Linear Regression Slope - ILRS
Instantaneous Trendline
Kalman Filter
Kaufman Adaptive Moving Average - KAMA
Laguerre Filter
Leader Exponential Moving Average
Linear Regression Value - LSMA (Least Squares Moving Average)
Linear Weighted Moving Average - LWMA
McGinley Dynamic
McNicholl EMA
Non-Lag Moving Average
Ocean NMA Moving Average - ONMAMA
One More Moving Average - OMA
Parabolic Weighted Moving Average
Probability Density Function Moving Average - PDFMA
Quadratic Regression Moving Average - QRMA
Range Filter
Range Weighted EMA - RWEMA
Recursive Moving Trendline
Regularized EMA - REMA
Simple Decycler - SDEC
Simple Loxx Moving Average - SLMA
Simple Moving Average - SMA
Sine Weighted Moving Average
Smoothed LWMA - SLWMA
Smoothed Moving Average - SMMA
Smoother
Super Smoother
T3
Tether Lines
Three-pole Ehlers Butterworth
Three-pole Ehlers Smoother
Triangular Moving Average - TMA
Triangle Moving Average Generalized
Triple Exponential Moving Average - TEMA
Two-pole Ehlers Butterworth
Two-pole Ehlers smoother
Ultimate Smoother
Variable Index Dynamic Average - VIDYA
Variable Moving Average - VMA
Volume Weighted EMA - VEMA
Volume Weighted Moving Average - VWMA
Zero-Lag DEMA - Zero Lag Double Exponential Moving Average
Zero-Lag Moving Average
Zero Lag TEMA - Zero Lag Triple Exponential Moving Average
█ Volatility Types and Filtering
The GKD-M Stepped Baseline Optimizer features a comprehensive selection of over 15 volatility types, each tailored to capture different aspects of market behavior and risk.
Volatility Ticker Selection: Enables direct incorporation of external volatility indicators like VIX and EUVIX into the script for market sentiment analysis, signal filtering enhancement, and real-time risk management adjustments.
Standard Deviation of Logarithmic Returns: Quantifies asset volatility using the standard deviation applied to logarithmic returns, capturing symmetric price movements and financial returns' compound nature.
Exponential Weighted Moving Average (EWMA) for Volatility: Focuses on recent market information by applying exponentially decreasing weights to squared logarithmic returns, offering a dynamic view of market volatility.
Roger-Satchell Volatility Measure: Estimates asset volatility by analyzing the high, low, open, and close prices, providing a nuanced view of intraday volatility and market dynamics.
Close-to-Close Volatility Measure: Calculates volatility based on the closing prices of stocks, offering a streamlined but limited perspective on market behavior.
Parkinson Volatility Measure: Enhances volatility estimation by including high and low prices of the trading day, capturing a more accurate reflection of intraday market movements.
Garman-Klass Volatility Measure: Incorporates open, high, low, and close prices for a comprehensive daily volatility measure, capturing significant price movements and market activity.
Yang-Zhang Volatility Measure: Offers an efficient estimation of stock market volatility by combining overnight and intraday price movements, capturing opening jumps and overall market dynamics.
Garman-Klass-Yang-Zhang Volatility Measure: Merges the benefits of Garman-Klass and Yang-Zhang measures, providing a fuller picture of market volatility including opening market reactions.
Pseudo GARCH(2,2) Volatility Model: Mimics a GARCH(2,2) process using exponential moving averages of squared returns, highlighting volatility shocks and their future impact.
ER-Adaptive Average True Range (ATR): Adjusts the ATR period length based on market efficiency, offering a volatility measure that adapts to changing market conditions.
Adaptive Deviation: Dynamically adjusts its calculation period to offer a nuanced measure of volatility that responds to the market's intrinsic rhythms.
Median Absolute Deviation (MAD): Provides a robust measure of statistical variability, focusing on deviations from the median price, offering resilience against outliers.
Mean Absolute Deviation (MAD): Measures the average magnitude of deviations from the mean price, facilitating a straightforward understanding of volatility.
ATR (Average True Range): Finds the average of true ranges over a specified period, indicating the expected price movement and market volatility.
True Range Double (TRD): Offers a nuanced view of volatility by considering a broader range of price movements, identifying significant market sentiment shifts.

GKD-B Multi-Ticker Stepped Baseline [Loxx]Giga Kaleidoscope GKD-B Multi-Ticker Stepped Baseline is a Baseline module included in Loxx's "Giga Kaleidoscope Modularized Trading System".
This version of the GKD-B Baseline is designed specifically to support traders who wish to conduct GKD-BT Multi-Ticker Backtests with multiple tickers. This functionality is exclusive to the GKD-BT Multi-Ticker Backtests.
Traders have the capability to apply a filter to the selected moving average, leveraging various volatility metrics to enhance trend identification. This feature is tailored for traders favoring a gradual and consistent approach, enabling them to discern more sustainable trends. The system permits filtering for both the input data and the moving average results, requiring price movements to exceed a specific threshold—defined as multiples of the volatility—before acknowledging a trend change. This mechanism effectively reduces false signals caused by market noise and lateral movements. A distinctive aspect of this tool is its ability to adjust both price and moving average data based on volatility indicators like VIX, EUVIX, BVIV, and EVIV, among others. Understanding the time frame over which a volatility index is measured is crucial; for instance, VIX is measured on an annual basis, whereas BVIV and EVIV are based on a 30-day period. To accurately convert these measurements to a daily scale, users must input the correct "days per year" value: 252 for VIX and 30 for BVIV and EVIV. Future updates will introduce additional functionality to extend analysis across various time frames, but currently, this feature is solely available for daily time frame analysis.
█ GKD-B Multi-Ticker Stepped Baseline includes 65+ different moving averages:
Adaptive Moving Average - AMA
ADXvma - Average Directional Volatility Moving Average
Ahrens Moving Average
Alexander Moving Average - ALXMA
Deviation Scaled Moving Average - DSMA
Donchian
Double Exponential Moving Average - DEMA
Double Smoothed Exponential Moving Average - DSEMA
Double Smoothed FEMA - DSFEMA
Double Smoothed Range Weighted EMA - DSRWEMA
Double Smoothed Wilders EMA - DSWEMA
Double Weighted Moving Average - DWMA
Ehlers Optimal Tracking Filter - EOTF
Exponential Moving Average - EMA
Fast Exponential Moving Average - FEMA
Fractal Adaptive Moving Average - FRAMA
Generalized DEMA - GDEMA
Generalized Double DEMA - GDDEMA
Hull Moving Average (Type 1) - HMA1
Hull Moving Average (Type 2) - HMA2
Hull Moving Average (Type 3) - HMA3
Hull Moving Average (Type 4) - HMA4
IE /2 - Early T3 by Tim Tilson
Integral of Linear Regression Slope - ILRS
Kaufman Adaptive Moving Average - KAMA
Laguerre Filter
Leader Exponential Moving Average
Linear Regression Value - LSMA ( Least Squares Moving Average )
Linear Weighted Moving Average - LWMA
McGinley Dynamic
McNicholl EMA
Non-Lag Moving Average
Ocean NMA Moving Average - ONMAMA
One More Moving Average - OMA
Parabolic Weighted Moving Average
Probability Density Function Moving Average - PDFMA
Quadratic Regression Moving Average - QRMA
Regularized EMA - REMA
Range Weighted EMA - RWEMA
Recursive Moving Trendline
Simple Decycler - SDEC
Simple Jurik Moving Average - SJMA
Simple Moving Average - SMA
Sine Weighted Moving Average
Smoothed LWMA - SLWMA
Smoothed Moving Average - SMMA
Smoother
Super Smoother
T3
Three-pole Ehlers Butterworth
Three-pole Ehlers Smoother
Triangular Moving Average - TMA
Triple Exponential Moving Average - TEMA
Two-pole Ehlers Butterworth
Two-pole Ehlers smoother
Variable Index Dynamic Average - VIDYA
Variable Moving Average - VMA
Volume Weighted EMA - VEMA
Volume Weighted Moving Average - VWMA
Zero-Lag DEMA - Zero Lag Exponential Moving Average
Zero-Lag Moving Average
Zero Lag TEMA - Zero Lag Triple Exponential Moving Average
Geometric Mean Moving Average
Coral
Tether Lines
Range Filter
Triangle Moving Average Generalized
Ultinate Smoother
Adaptive Moving Average - AMA
The Adaptive Moving Average (AMA) is a moving average that changes its sensitivity to price moves depending on the calculated volatility. It becomes more sensitive during periods when the price is moving smoothly in a certain direction and becomes less sensitive when the price is volatile.
ADXvma - Average Directional Volatility Moving Average
Linnsoft's ADXvma formula is a volatility-based moving average, with the volatility being determined by the value of the ADX indicator.
The ADXvma has the SMA in Chande's CMO replaced with an EMA , it then uses a few more layers of EMA smoothing before the "Volatility Index" is calculated.
A side effect is, those additional layers slow down the ADXvma when you compare it to Chande's Variable Index Dynamic Average VIDYA .
The ADXVMA provides support during uptrends and resistance during downtrends and will stay flat for longer, but will create some of the most accurate market signals when it decides to move.
Ahrens Moving Average
Richard D. Ahrens's Moving Average promises "Smoother Data" that isn't influenced by the occasional price spike. It works by using the Open and the Close in his formula so that the only time the Ahrens Moving Average will change is when the candlestick is either making new highs or new lows.
Alexander Moving Average - ALXMA
This Moving Average uses an elaborate smoothing formula and utilizes a 7 period Moving Average. It corresponds to fitting a second-order polynomial to seven consecutive observations. This moving average is rarely used in trading but is interesting as this Moving Average has been applied to diffusion indexes that tend to be very volatile.
Deviation Scaled Moving Average - DSMA
The Deviation-Scaled Moving Average is a data smoothing technique that acts like an exponential moving average with a dynamic smoothing coefficient. The smoothing coefficient is automatically updated based on the magnitude of price changes. In the Deviation-Scaled Moving Average, the standard deviation from the mean is chosen to be the measure of this magnitude. The resulting indicator provides substantial smoothing of the data even when price changes are small while quickly adapting to these changes.
Donchian
Donchian Channels are three lines generated by moving average calculations that comprise an indicator formed by upper and lower bands around a midrange or median band. The upper band marks the highest price of a security over N periods while the lower band marks the lowest price of a security over N periods.
Double Exponential Moving Average - DEMA
The Double Exponential Moving Average ( DEMA ) combines a smoothed EMA and a single EMA to provide a low-lag indicator. It's primary purpose is to reduce the amount of "lagging entry" opportunities, and like all Moving Averages, the DEMA confirms uptrends whenever price crosses on top of it and closes above it, and confirms downtrends when the price crosses under it and closes below it - but with significantly less lag.
Double Smoothed Exponential Moving Average - DSEMA
The Double Smoothed Exponential Moving Average is a lot less laggy compared to a traditional EMA . It's also considered a leading indicator compared to the EMA , and is best utilized whenever smoothness and speed of reaction to market changes are required.
Double Smoothed FEMA - DSFEMA
Same as the Double Exponential Moving Average (DEMA), but uses a faster version of EMA for its calculation.
Double Smoothed Range Weighted EMA - DSRWEMA
Range weighted exponential moving average (EMA) is, unlike the "regular" range weighted average calculated in a different way. Even though the basis - the range weighting - is the same, the way how it is calculated is completely different. By definition this type of EMA is calculated as a ratio of EMA of price*weight / EMA of weight. And the results are very different and the two should be considered as completely different types of averages. The higher than EMA to price changes responsiveness when the ranges increase remains in this EMA too and in those cases this EMA is clearly leading the "regular" EMA. This version includes double smoothing.
Double Smoothed Wilders EMA - DSWEMA
Welles Wilder was frequently using one "special" case of EMA (Exponential Moving Average) that is due to that fact (that he used it) sometimes called Wilder's EMA. This version is adding double smoothing to Wilder's EMA in order to make it "faster" (it is more responsive to market prices than the original) and is still keeping very smooth values.
Double Weighted Moving Average - DWMA
Double weighted moving average is an LWMA (Linear Weighted Moving Average). Instead of doing one cycle for calculating the LWMA, the indicator is made to cycle the loop 2 times. That produces a smoother values than the original LWMA
Ehlers Optimal Tracking Filter - EOTF
The Elher's Optimum Tracking Filter quickly adjusts rapid shifts in the price and yet is relatively smooth when the price has a sideways action. The operation of this filter is similar to Kaufman’s Adaptive Moving
Average
Exponential Moving Average - EMA
The EMA places more significance on recent data points and moves closer to price than the SMA ( Simple Moving Average ). It reacts faster to volatility due to its emphasis on recent data and is known for its ability to give greater weight to recent and more relevant data. The EMA is therefore seen as an enhancement over the SMA .
Fast Exponential Moving Average - FEMA
An Exponential Moving Average with a short look-back period.
Fractal Adaptive Moving Average - FRAMA
The Fractal Adaptive Moving Average by John Ehlers is an intelligent adaptive Moving Average which takes the importance of price changes into account and follows price closely enough to display significant moves whilst remaining flat if price ranges. The FRAMA does this by dynamically adjusting the look-back period based on the market's fractal geometry.
Generalized DEMA - GDEMA
The double exponential moving average (DEMA), was developed by Patrick Mulloy in an attempt to reduce the amount of lag time found in traditional moving averages. It was first introduced in the February 1994 issue of the magazine Technical Analysis of Stocks & Commodities in Mulloy's article "Smoothing Data with Faster Moving Averages.". Instead of using fixed multiplication factor in the final DEMA formula, the generalized version allows you to change it. By varying the "volume factor" form 0 to 1 you apply different multiplications and thus producing DEMA with different "speed" - the higher the volume factor is the "faster" the DEMA will be (but also the slope of it will be less smooth). The volume factor is limited in the calculation to 1 since any volume factor that is larger than 1 is increasing the overshooting to the extent that some volume factors usage makes the indicator unusable.
Generalized Double DEMA - GDDEMA
The double exponential moving average (DEMA), was developed by Patrick Mulloy in an attempt to reduce the amount of lag time found in traditional moving averages. It was first introduced in the February 1994 issue of the magazine Technical Analysis of Stocks & Commodities in Mulloy's article "Smoothing Data with Faster Moving Averages''. This is an extension of the Generalized DEMA using Tim Tillsons (the inventor of T3) idea, and is using GDEMA of GDEMA for calculation (which is the "middle step" of T3 calculation). Since there are no versions showing that middle step, this version covers that too. The result is smoother than Generalized DEMA, but is less smooth than T3 - one has to do some experimenting in order to find the optimal way to use it, but in any case, since it is "faster" than the T3 (Tim Tillson T3) and still smooth, it looks like a good compromise between speed and smoothness.
Hull Moving Average (Type 1) - HMA1
Alan Hull's HMA makes use of weighted moving averages to prioritize recent values and greatly reduce lag whilst maintaining the smoothness of a traditional Moving Average. For this reason, it's seen as a well-suited Moving Average for identifying entry points. This version uses SMA for smoothing.
Hull Moving Average (Type 2) - HMA2
Alan Hull's HMA makes use of weighted moving averages to prioritize recent values and greatly reduce lag whilst maintaining the smoothness of a traditional Moving Average. For this reason, it's seen as a well-suited Moving Average for identifying entry points. This version uses EMA for smoothing.
Hull Moving Average (Type 3) - HMA3
Alan Hull's HMA makes use of weighted moving averages to prioritize recent values and greatly reduce lag whilst maintaining the smoothness of a traditional Moving Average. For this reason, it's seen as a well-suited Moving Average for identifying entry points. This version uses LWMA for smoothing.
Hull Moving Average (Type 4) - HMA4
Alan Hull's HMA makes use of weighted moving averages to prioritize recent values and greatly reduce lag whilst maintaining the smoothness of a traditional Moving Average. For this reason, it's seen as a well-suited Moving Average for identifying entry points. This version uses SMMA for smoothing.
IE /2 - Early T3 by Tim Tilson and T3 new
The T3 moving average is a type of technical indicator used in financial analysis to identify trends in price movements. It is similar to the Exponential Moving Average (EMA) and the Double Exponential Moving Average (DEMA), but uses a different smoothing algorithm.
The T3 moving average is calculated using a series of exponential moving averages that are designed to filter out noise and smooth the data. The resulting smoothed data is then weighted with a non-linear function to produce a final output that is more responsive to changes in trend direction.
The T3 moving average can be customized by adjusting the length of the moving average, as well as the weighting function used to smooth the data. It is commonly used in conjunction with other technical indicators as part of a larger trading strategy.
Integral of Linear Regression Slope - ILRS
A Moving Average where the slope of a linear regression line is simply integrated as it is fitted in a moving window of length N (natural numbers in maths) across the data. The derivative of ILRS is the linear regression slope. ILRS is not the same as a SMA ( Simple Moving Average ) of length N, which is actually the midpoint of the linear regression line as it moves across the data.
Kaufman Adaptive Moving Average - KAMA
Developed by Perry Kaufman, Kaufman's Adaptive Moving Average (KAMA) is a moving average designed to account for market noise or volatility. KAMA will closely follow prices when the price swings are relatively small and the noise is low.
Laguerre Filter
The Laguerre Filter is a smoothing filter which is based on Laguerre polynomials. The filter requires the current price, three prior prices, a user defined factor called Alpha to fill its calculation.
Adjusting the Alpha coefficient is used to increase or decrease its lag and its smoothness.
Leader Exponential Moving Average
The Leader EMA was created by Giorgos E. Siligardos who created a Moving Average which was able to eliminate lag altogether whilst maintaining some smoothness. It was first described during his research paper "MACD Leader" where he applied this to the MACD to improve its signals and remove its lagging issue. This filter uses his leading MACD's "modified EMA" and can be used as a zero lag filter.
Linear Regression Value - LSMA ( Least Squares Moving Average )
LSMA as a Moving Average is based on plotting the end point of the linear regression line. It compares the current value to the prior value and a determination is made of a possible trend, eg. the linear regression line is pointing up or down.
Linear Weighted Moving Average - LWMA
LWMA reacts to price quicker than the SMA and EMA . Although it's similar to the Simple Moving Average , the difference is that a weight coefficient is multiplied to the price which means the most recent price has the highest weighting, and each prior price has progressively less weight. The weights drop in a linear fashion.
McGinley Dynamic
John McGinley created this Moving Average to track prices better than traditional Moving Averages. It does this by incorporating an automatic adjustment factor into its formula, which speeds (or slows) the indicator in trending, or ranging, markets.
McNicholl EMA
Dennis McNicholl developed this Moving Average to use as his center line for his "Better Bollinger Bands" indicator and was successful because it responded better to volatility changes over the standard SMA and managed to avoid common whipsaws.
Non-lag moving average
The Non Lag Moving average follows price closely and gives very quick signals as well as early signals of price change. As a standalone Moving Average, it should not be used on its own, but as an additional confluence tool for early signals.
Ocean NMA Moving Average - ONMAMA
Created by Jim Sloman, the NMA is a moving average that automatically adjusts to volatility without being programmed to do so. For more info, read his guide "Ocean Theory, an Introduction"
One More Moving Average (OMA)
The One More Moving Average (OMA) is a technical indicator that calculates a series of Jurik-style moving averages in order to reduce noise and provide smoother price data. It uses six exponential moving averages to generate the final value, with the length of the moving averages determined by an adaptive algorithm that adjusts to the current market conditions. The algorithm calculates the average period by comparing the signal to noise ratio and using this value to determine the length of the moving averages. The resulting values are used to generate the final value of the OMA, which can be used to identify trends and potential changes in trend direction.
Parabolic Weighted Moving Average
The Parabolic Weighted Moving Average is a variation of the Linear Weighted Moving Average . The Linear Weighted Moving Average calculates the average by assigning different weights to each element in its calculation. The Parabolic Weighted Moving Average is a variation that allows weights to be changed to form a parabolic curve. It is done simply by using the Power parameter of this indicator.
Probability Density Function Moving Average - PDFMA
Probability density function based MA is a sort of weighted moving average that uses probability density function to calculate the weights. By its nature it is similar to a lot of digital filters.
Quadratic Regression Moving Average - QRMA
A quadratic regression is the process of finding the equation of the parabola that best fits a set of data. This moving average is an obscure concept that was posted to Forex forums in around 2008.
Regularized EMA - REMA
The regularized exponential moving average (REMA) by Chris Satchwell is a variation on the EMA (see Exponential Moving Average) designed to be smoother but not introduce too much extra lag.
Range Weighted EMA - RWEMA
This indicator is a variation of the range weighted EMA. The variation comes from a possible need to make that indicator a bit less "noisy" when it comes to slope changes. The method used for calculating this variation is the method described by Lee Leibfarth in his article "Trading With An Adaptive Price Zone".
Recursive Moving Trendline
Dennis Meyers's Recursive Moving Trendline uses a recursive (repeated application of a rule) polynomial fit, a technique that uses a small number of past values estimations of price and today's price to predict tomorrow's price.
Simple Decycler - SDEC
The Ehlers Simple Decycler study is a virtually zero-lag technical indicator proposed by John F. Ehlers. The original idea behind this study (and several others created by John F. Ehlers) is that market data can be considered a continuum of cycle periods with different cycle amplitudes. Thus, trending periods can be considered segments of longer cycles, or, in other words, low-frequency segments. Applying the right filter might help identify these segments.
Simple Loxx Moving Average - SLMA
A three stage moving average combining an adaptive EMA, a Kalman Filter, and a Kauffman adaptive filter.
Simple Moving Average - SMA
The SMA calculates the average of a range of prices by adding recent prices and then dividing that figure by the number of time periods in the calculation average. It is the most basic Moving Average which is seen as a reliable tool for starting off with Moving Average studies. As reliable as it may be, the basic moving average will work better when it's enhanced into an EMA .
Sine Weighted Moving Average
The Sine Weighted Moving Average assigns the most weight at the middle of the data set. It does this by weighting from the first half of a Sine Wave Cycle and the most weighting is given to the data in the middle of that data set. The Sine WMA closely resembles the TMA (Triangular Moving Average).
Smoothed LWMA - SLWMA
A smoothed version of the LWMA
Smoothed Moving Average - SMMA
The Smoothed Moving Average is similar to the Simple Moving Average ( SMA ), but aims to reduce noise rather than reduce lag. SMMA takes all prices into account and uses a long lookback period. Due to this, it's seen as an accurate yet laggy Moving Average.
Smoother
The Smoother filter is a faster-reacting smoothing technique which generates considerably less lag than the SMMA ( Smoothed Moving Average ). It gives earlier signals but can also create false signals due to its earlier reactions. This filter is sometimes wrongly mistaken for the superior Jurik Smoothing algorithm.
Super Smoother
The Super Smoother filter uses John Ehlers’s “Super Smoother” which consists of a Two pole Butterworth filter combined with a 2-bar SMA ( Simple Moving Average ) that suppresses the 22050 Hz Nyquist frequency: A characteristic of a sampler, which converts a continuous function or signal into a discrete sequence.
Three-pole Ehlers Butterworth
The 3 pole Ehlers Butterworth (as well as the Two pole Butterworth) are both superior alternatives to the EMA and SMA . They aim at producing less lag whilst maintaining accuracy. The 2 pole filter will give you a better approximation for price, whereas the 3 pole filter has superior smoothing.
Three-pole Ehlers smoother
The 3 pole Ehlers smoother works almost as close to price as the above mentioned 3 Pole Ehlers Butterworth. It acts as a strong baseline for signals but removes some noise. Side by side, it hardly differs from the Three Pole Ehlers Butterworth but when examined closely, it has better overshoot reduction compared to the 3 pole Ehlers Butterworth.
Triangular Moving Average - TMA
The TMA is similar to the EMA but uses a different weighting scheme. Exponential and weighted Moving Averages will assign weight to the most recent price data. Simple moving averages will assign the weight equally across all the price data. With a TMA (Triangular Moving Average), it is double smoother (averaged twice) so the majority of the weight is assigned to the middle portion of the data.
Triple Exponential Moving Average - TEMA
The TEMA uses multiple EMA calculations as well as subtracting lag to create a tool which can be used for scalping pullbacks. As it follows price closely, its signals are considered very noisy and should only be used in extremely fast-paced trading conditions.
Two-pole Ehlers Butterworth
The 2 pole Ehlers Butterworth (as well as the three pole Butterworth mentioned above) is another filter that cuts out the noise and follows the price closely. The 2 pole is seen as a faster, leading filter over the 3 pole and follows price a bit more closely. Analysts will utilize both a 2 pole and a 3 pole Butterworth on the same chart using the same period, but having both on chart allows its crosses to be traded.
Two-pole Ehlers smoother
A smoother version of the Two pole Ehlers Butterworth. This filter is the faster version out of the 3 pole Ehlers Butterworth. It does a decent job at cutting out market noise whilst emphasizing a closer following to price over the 3 pole Ehlers .
Variable Index Dynamic Average - VIDYA
Variable Index Dynamic Average Technical Indicator ( VIDYA ) was developed by Tushar Chande. It is an original method of calculating the Exponential Moving Average ( EMA ) with the dynamically changing period of averaging.
Variable Moving Average - VMA
The Variable Moving Average (VMA) is a study that uses an Exponential Moving Average being able to automatically adjust its smoothing factor according to the market volatility.
Volume Weighted EMA - VEMA
An EMA that uses a volume and price weighted calculation instead of the standard price input.
Volume Weighted Moving Average - VWMA
A Volume Weighted Moving Average is a moving average where more weight is given to bars with heavy volume than with light volume. Thus the value of the moving average will be closer to where most trading actually happened than it otherwise would be without being volume weighted.
Zero-Lag DEMA - Zero Lag Double Exponential Moving Average
John Ehlers's Zero Lag DEMA's aim is to eliminate the inherent lag associated with all trend following indicators which average a price over time. Because this is a Double Exponential Moving Average with Zero Lag, it has a tendency to overshoot and create a lot of false signals for swing trading. It can however be used for quick scalping or as a secondary indicator for confluence.
Zero-Lag Moving Average
The Zero Lag Moving Average is described by its creator, John Ehlers , as a Moving Average with absolutely no delay. And it's for this reason that this filter will cause a lot of abrupt signals which will not be ideal for medium to long-term traders. This filter is designed to follow price as close as possible whilst de-lagging data instead of basing it on regular data. The way this is done is by attempting to remove the cumulative effect of the Moving Average.
Zero-Lag TEMA - Zero Lag Triple Exponential Moving Average
Just like the Zero Lag DEMA , this filter will give you the fastest signals out of all the Zero Lag Moving Averages. This is useful for scalping but dangerous for medium to long-term traders, especially during market Volatility and news events. Having no lag, this filter also has no smoothing in its signals and can cause some very bizarre behavior when applied to certain indicators.
█ Volatility Goldie Locks Zone
This volatility filter is the standard first pass filter that is used for all NNFX systems despite the additional volatility/volume filter used in step 5. For this filter, price must fall into a range of maximum and minimum values calculated using multiples of volatility. Unlike the standard NNFX systems, this version of volatility filtering is separated from the core Baseline and uses it's own moving average with Loxx's Exotic Source Types.
█ Volatility Types included
The GKD system utilizes volatility-based take profits and stop losses. Each take profit and stop loss is calculated as a multiple of volatility. You can change the values of the multipliers in the settings as well.
This module includes 17 types of volatility:
Close-to-Close
Parkinson
Garman-Klass
Rogers-Satchell
Yang-Zhang
Garman-Klass-Yang-Zhang
Exponential Weighted Moving Average
Standard Deviation of Log Returns
Pseudo GARCH(2,2)
Average True Range
True Range Double
Standard Deviation
Adaptive Deviation
Median Absolute Deviation
Efficiency-Ratio Adaptive ATR
Mean Absolute Deviation
Static Percent
Various volatility estimators and indicators that investors and traders can use to measure the dispersion or volatility of a financial instrument's price. Each estimator has its strengths and weaknesses, and the choice of estimator should depend on the specific needs and circumstances of the user.
Volatility Ticker Selection
Import volatility tickers like VIX, EUVIX, BVIV, and EVIV.
Close-to-Close
Close-to-Close volatility is a classic and widely used volatility measure, sometimes referred to as historical volatility.
Volatility is an indicator of the speed of a stock price change. A stock with high volatility is one where the price changes rapidly and with a larger amplitude. The more volatile a stock is, the riskier it is.
Close-to-close historical volatility is calculated using only a stock's closing prices. It is the simplest volatility estimator. However, in many cases, it is not precise enough. Stock prices could jump significantly during a trading session and return to the opening value at the end. That means that a considerable amount of price information is not taken into account by close-to-close volatility.
Despite its drawbacks, Close-to-Close volatility is still useful in cases where the instrument doesn't have intraday prices. For example, mutual funds calculate their net asset values daily or weekly, and thus their prices are not suitable for more sophisticated volatility estimators.
Parkinson
Parkinson volatility is a volatility measure that uses the stock’s high and low price of the day.
The main difference between regular volatility and Parkinson volatility is that the latter uses high and low prices for a day, rather than only the closing price. This is useful as close-to-close prices could show little difference while large price movements could have occurred during the day. Thus, Parkinson's volatility is considered more precise and requires less data for calculation than close-to-close volatility.
One drawback of this estimator is that it doesn't take into account price movements after the market closes. Hence, it systematically undervalues volatility. This drawback is addressed in the Garman-Klass volatility estimator.
Garman-Klass
Garman-Klass is a volatility estimator that incorporates open, low, high, and close prices of a security.
Garman-Klass volatility extends Parkinson's volatility by taking into account the opening and closing prices. As markets are most active during the opening and closing of a trading session, it makes volatility estimation more accurate.
Garman and Klass also assumed that the process of price change follows a continuous diffusion process (Geometric Brownian motion). However, this assumption has several drawbacks. The method is not robust for opening jumps in price and trend movements.
Despite its drawbacks, the Garman-Klass estimator is still more effective than the basic formula since it takes into account not only the price at the beginning and end of the time interval but also intraday price extremes.
Researchers Rogers and Satchell have proposed a more efficient method for assessing historical volatility that takes into account price trends. See Rogers-Satchell Volatility for more detail.
Rogers-Satchell
Rogers-Satchell is an estimator for measuring the volatility of securities with an average return not equal to zero.
Unlike Parkinson and Garman-Klass estimators, Rogers-Satchell incorporates a drift term (mean return not equal to zero). As a result, it provides better volatility estimation when the underlying is trending.
The main disadvantage of this method is that it does not take into account price movements between trading sessions. This leads to an underestimation of volatility since price jumps periodically occur in the market precisely at the moments between sessions.
A more comprehensive estimator that also considers the gaps between sessions was developed based on the Rogers-Satchel formula in the 2000s by Yang-Zhang. See Yang Zhang Volatility for more detail.
Yang-Zhang
Yang Zhang is a historical volatility estimator that handles both opening jumps and the drift and has a minimum estimation error.
Yang-Zhang volatility can be thought of as a combination of the overnight (close-to-open volatility) and a weighted average of the Rogers-Satchell volatility and the day’s open-to-close volatility. It is considered to be 14 times more efficient than the close-to-close estimator.
Garman-Klass-Yang-Zhang
Garman-Klass-Yang-Zhang (GKYZ) volatility estimator incorporates the returns of open, high, low, and closing prices in its calculation.
GKYZ volatility estimator takes into account overnight jumps but not the trend, i.e., it assumes that the underlying asset follows a Geometric Brownian Motion (GBM) process with zero drift. Therefore, the GKYZ volatility estimator tends to overestimate the volatility when the drift is different from zero. However, for a GBM process, this estimator is eight times more efficient than the close-to-close volatility estimator.
Exponential Weighted Moving Average
The Exponentially Weighted Moving Average (EWMA) is a quantitative or statistical measure used to model or describe a time series. The EWMA is widely used in finance, with the main applications being technical analysis and volatility modeling.
The moving average is designed such that older observations are given lower weights. The weights decrease exponentially as the data point gets older – hence the name exponentially weighted.
The only decision a user of the EWMA must make is the parameter lambda. The parameter decides how important the current observation is in the calculation of the EWMA. The higher the value of lambda, the more closely the EWMA tracks the original time series.
Standard Deviation of Log Returns
This is the simplest calculation of volatility. It's the standard deviation of ln(close/close(1)).
Pseudo GARCH(2,2)
This is calculated using a short- and long-run mean of variance multiplied by ?.
avg(var;M) + (1 ? ?) avg(var;N) = 2?var/(M+1-(M-1)L) + 2(1-?)var/(M+1-(M-1)L)
Solving for ? can be done by minimizing the mean squared error of estimation; that is, regressing L^-1var - avg(var; N) against avg(var; M) - avg(var; N) and using the resulting beta estimate as ?.
Average True Range
The average true range (ATR) is a technical analysis indicator, introduced by market technician J. Welles Wilder Jr. in his book New Concepts in Technical Trading Systems, that measures market volatility by decomposing the entire range of an asset price for that period.
The true range indicator is taken as the greatest of the following: current high less the current low; the absolute value of the current high less the previous close; and the absolute value of the current low less the previous close. The ATR is then a moving average, generally using 14 days, of the true ranges.
True Range Double
A special case of ATR that attempts to correct for volatility skew.
Standard Deviation
Standard deviation is a statistic that measures the dispersion of a dataset relative to its mean and is calculated as the square root of the variance. The standard deviation is calculated as the square root of variance by determining each data point's deviation relative to the mean. If the data points are further from the mean, there is a higher deviation within the data set; thus, the more spread out the data, the higher the standard deviation.
Adaptive Deviation
By definition, the Standard Deviation (STD, also represented by the Greek letter sigma ? or the Latin letter s) is a measure that is used to quantify the amount of variation or dispersion of a set of data values. In technical analysis, we usually use it to measure the level of current volatility.
Standard Deviation is based on Simple Moving Average calculation for mean value. This version of standard deviation uses the properties of EMA to calculate what can be called a new type of deviation, and since it is based on EMA, we can call it EMA deviation. Additionally, Perry Kaufman's efficiency ratio is used to make it adaptive (since all EMA type calculations are nearly perfect for adapting).
The difference when compared to the standard is significant--not just because of EMA usage, but the efficiency ratio makes it a "bit more logical" in very volatile market conditions.
Median Absolute Deviation
The median absolute deviation is a measure of statistical dispersion. Moreover, the MAD is a robust statistic, being more resilient to outliers in a data set than the standard deviation. In the standard deviation, the distances from the mean are squared, so large deviations are weighted more heavily, and thus outliers can heavily influence it. In the MAD, the deviations of a small number of outliers are irrelevant.
Because the MAD is a more robust estimator of scale than the sample variance or standard deviation, it works better with distributions without a mean or variance, such as the Cauchy distribution.
For this indicator, a manual recreation of the quantile function in Pine Script is used. This is so users have a full inside view into how this is calculated.
Efficiency-Ratio Adaptive ATR
Average True Range (ATR) is a widely used indicator for many occasions in technical analysis. It is calculated as the RMA of the true range. This version adds a "twist": it uses Perry Kaufman's Efficiency Ratio to calculate adaptive true range.
Mean Absolute Deviation
The mean absolute deviation (MAD) is a measure of variability that indicates the average distance between observations and their mean. MAD uses the original units of the data, which simplifies interpretation. Larger values signify that the data points spread out further from the average. Conversely, lower values correspond to data points bunching closer to it. The mean absolute deviation is also known as the mean deviation and average absolute deviation.
This definition of the mean absolute deviation sounds similar to the standard deviation (SD). While both measure variability, they have different calculations. In recent years, some proponents of MAD have suggested that it replace the SD as the primary measure because it is a simpler concept that better fits real life.
█ Giga Kaleidoscope Modularized Trading System
Core components of an NNFX algorithmic trading strategy
The NNFX algorithm is built on the principles of trend, momentum, and volatility. There are six core components in the NNFX trading algorithm:
1. Volatility - price volatility; e.g., Average True Range, True Range Double, Close-to-Close, etc.
2. Baseline - a moving average to identify price trend
3. Confirmation 1 - a technical indicator used to identify trends
4. Confirmation 2 - a technical indicator used to identify trends
5. Continuation - a technical indicator used to identify trends
6. Volatility/Volume - a technical indicator used to identify volatility/volume breakouts/breakdown
7. Exit - a technical indicator used to determine when a trend is exhausted
8. Metamorphosis - a technical indicator that produces a compound signal from the combination of other GKD indicators*
*(not part of the NNFX algorithm)
What is Volatility in the NNFX trading system?
In the NNFX (No Nonsense Forex) trading system, ATR (Average True Range) is typically used to measure the volatility of an asset. It is used as a part of the system to help determine the appropriate stop loss and take profit levels for a trade. ATR is calculated by taking the average of the true range values over a specified period.
True range is calculated as the maximum of the following values:
-Current high minus the current low
-Absolute value of the current high minus the previous close
-Absolute value of the current low minus the previous close
ATR is a dynamic indicator that changes with changes in volatility. As volatility increases, the value of ATR increases, and as volatility decreases, the value of ATR decreases. By using ATR in NNFX system, traders can adjust their stop loss and take profit levels according to the volatility of the asset being traded. This helps to ensure that the trade is given enough room to move, while also minimizing potential losses.
Other types of volatility include True Range Double (TRD), Close-to-Close, and Garman-Klass
What is a Baseline indicator?
The baseline is essentially a moving average, and is used to determine the overall direction of the market.
The baseline in the NNFX system is used to filter out trades that are not in line with the long-term trend of the market. The baseline is plotted on the chart along with other indicators, such as the Moving Average (MA), the Relative Strength Index (RSI), and the Average True Range (ATR).
Trades are only taken when the price is in the same direction as the baseline. For example, if the baseline is sloping upwards, only long trades are taken, and if the baseline is sloping downwards, only short trades are taken. This approach helps to ensure that trades are in line with the overall trend of the market, and reduces the risk of entering trades that are likely to fail.
By using a baseline in the NNFX system, traders can have a clear reference point for determining the overall trend of the market, and can make more informed trading decisions. The baseline helps to filter out noise and false signals, and ensures that trades are taken in the direction of the long-term trend.
What is a Confirmation indicator?
Confirmation indicators are technical indicators that are used to confirm the signals generated by primary indicators. Primary indicators are the core indicators used in the NNFX system, such as the Average True Range (ATR), the Moving Average (MA), and the Relative Strength Index (RSI).
The purpose of the confirmation indicators is to reduce false signals and improve the accuracy of the trading system. They are designed to confirm the signals generated by the primary indicators by providing additional information about the strength and direction of the trend.
Some examples of confirmation indicators that may be used in the NNFX system include the Bollinger Bands, the MACD (Moving Average Convergence Divergence), and the MACD Oscillator. These indicators can provide information about the volatility, momentum, and trend strength of the market, and can be used to confirm the signals generated by the primary indicators.
In the NNFX system, confirmation indicators are used in combination with primary indicators and other filters to create a trading system that is robust and reliable. By using multiple indicators to confirm trading signals, the system aims to reduce the risk of false signals and improve the overall profitability of the trades.
What is a Continuation indicator?
In the NNFX (No Nonsense Forex) trading system, a continuation indicator is a technical indicator that is used to confirm a current trend and predict that the trend is likely to continue in the same direction. A continuation indicator is typically used in conjunction with other indicators in the system, such as a baseline indicator, to provide a comprehensive trading strategy.
What is a Volatility/Volume indicator?
Volume indicators, such as the On Balance Volume (OBV), the Chaikin Money Flow (CMF), or the Volume Price Trend (VPT), are used to measure the amount of buying and selling activity in a market. They are based on the trading volume of the market, and can provide information about the strength of the trend. In the NNFX system, volume indicators are used to confirm trading signals generated by the Moving Average and the Relative Strength Index. Volatility indicators include Average Direction Index, Waddah Attar, and Volatility Ratio. In the NNFX trading system, volatility is a proxy for volume and vice versa.
By using volume indicators as confirmation tools, the NNFX trading system aims to reduce the risk of false signals and improve the overall profitability of trades. These indicators can provide additional information about the market that is not captured by the primary indicators, and can help traders to make more informed trading decisions. In addition, volume indicators can be used to identify potential changes in market trends and to confirm the strength of price movements.
What is an Exit indicator?
The exit indicator is used in conjunction with other indicators in the system, such as the Moving Average (MA), the Relative Strength Index (RSI), and the Average True Range (ATR), to provide a comprehensive trading strategy.
The exit indicator in the NNFX system can be any technical indicator that is deemed effective at identifying optimal exit points. Examples of exit indicators that are commonly used include the Parabolic SAR, and the Average Directional Index (ADX).
The purpose of the exit indicator is to identify when a trend is likely to reverse or when the market conditions have changed, signaling the need to exit a trade. By using an exit indicator, traders can manage their risk and prevent significant losses.
In the NNFX system, the exit indicator is used in conjunction with a stop loss and a take profit order to maximize profits and minimize losses. The stop loss order is used to limit the amount of loss that can be incurred if the trade goes against the trader, while the take profit order is used to lock in profits when the trade is moving in the trader's favor.
Overall, the use of an exit indicator in the NNFX trading system is an important component of a comprehensive trading strategy. It allows traders to manage their risk effectively and improve the profitability of their trades by exiting at the right time.
What is an Metamorphosis indicator?
The concept of a metamorphosis indicator involves the integration of two or more GKD indicators to generate a compound signal. This is achieved by evaluating the accuracy of each indicator and selecting the signal from the indicator with the highest accuracy. As an illustration, let's consider a scenario where we calculate the accuracy of 10 indicators and choose the signal from the indicator that demonstrates the highest accuracy.
The resulting output from the metamorphosis indicator can then be utilized in a GKD-BT backtest by occupying a slot that aligns with the purpose of the metamorphosis indicator. The slot can be a GKD-B, GKD-C, or GKD-E slot, depending on the specific requirements and objectives of the indicator. This allows for seamless integration and utilization of the compound signal within the GKD-BT framework.
How does Loxx's GKD (Giga Kaleidoscope Modularized Trading System) implement the NNFX algorithm outlined above?
Loxx's GKD v2.0 system has five types of modules (indicators/strategies). These modules are:
1. GKD-BT - Backtesting module (Volatility, Number 1 in the NNFX algorithm)
2. GKD-B - Baseline module (Baseline and Volatility/Volume, Numbers 1 and 2 in the NNFX algorithm)
3. GKD-C - Confirmation 1/2 and Continuation module (Confirmation 1/2 and Continuation, Numbers 3, 4, and 5 in the NNFX algorithm)
4. GKD-V - Volatility/Volume module (Confirmation 1/2, Number 6 in the NNFX algorithm)
5. GKD-E - Exit module (Exit, Number 7 in the NNFX algorithm)
6. GKD-M - Metamorphosis module (Metamorphosis, Number 8 in the NNFX algorithm, but not part of the NNFX algorithm)
(additional module types will added in future releases)
Each module interacts with every module by passing data to A backtest module wherein the various components of the GKD system are combined to create a trading signal.
That is, the Baseline indicator passes its data to Volatility/Volume. The Volatility/Volume indicator passes its values to the Confirmation 1 indicator. The Confirmation 1 indicator passes its values to the Confirmation 2 indicator. The Confirmation 2 indicator passes its values to the Continuation indicator. The Continuation indicator passes its values to the Exit indicator, and finally, the Exit indicator passes its values to the Backtest strategy.
This chaining of indicators requires that each module conform to Loxx's GKD protocol, therefore allowing for the testing of every possible combination of technical indicators that make up the six components of the NNFX algorithm.
What does the application of the GKD trading system look like?
Example trading system:
Backtest: Multi-Ticker CC Backtest
Baseline: Hull Moving Average
Volatility/Volume: Hurst Exponent
Confirmation 1: Advance Trend Pressure as shown on the chart above
Confirmation 2: uf2018
Continuation: Coppock Curve
Exit: Rex Oscillator
Metamorphosis: Baseline Optimizer
Each GKD indicator is denoted with a module identifier of either: GKD-BT, GKD-B, GKD-C, GKD-V, GKD-M, or GKD-E. This allows traders to understand to which module each indicator belongs and where each indicator fits into the GKD system.
█ Giga Kaleidoscope Modularized Trading System Signals
Standard Entry
1. GKD-C Confirmation gives signal
2. Baseline agrees
3. Price inside Goldie Locks Zone Minimum
4. Price inside Goldie Locks Zone Maximum
5. Confirmation 2 agrees
6. Volatility/Volume agrees
1-Candle Standard Entry
1a. GKD-C Confirmation gives signal
2a. Baseline agrees
3a. Price inside Goldie Locks Zone Minimum
4a. Price inside Goldie Locks Zone Maximum
Next Candle
1b. Price retraced
2b. Baseline agrees
3b. Confirmation 1 agrees
4b. Confirmation 2 agrees
5b. Volatility/Volume agrees
Baseline Entry
1. GKD-B Baseline gives signal
2. Confirmation 1 agrees
3. Price inside Goldie Locks Zone Minimum
4. Price inside Goldie Locks Zone Maximum
5. Confirmation 2 agrees
6. Volatility/Volume agrees
7. Confirmation 1 signal was less than 'Maximum Allowable PSBC Bars Back' prior
1-Candle Baseline Entry
1a. GKD-B Baseline gives signal
2a. Confirmation 1 agrees
3a. Price inside Goldie Locks Zone Minimum
4a. Price inside Goldie Locks Zone Maximum
5a. Confirmation 1 signal was less than 'Maximum Allowable PSBC Bars Back' prior
Next Candle
1b. Price retraced
2b. Baseline agrees
3b. Confirmation 1 agrees
4b. Confirmation 2 agrees
5b. Volatility/Volume agrees
Volatility/Volume Entry
1. GKD-V Volatility/Volume gives signal
2. Confirmation 1 agrees
3. Price inside Goldie Locks Zone Minimum
4. Price inside Goldie Locks Zone Maximum
5. Confirmation 2 agrees
6. Baseline agrees
7. Confirmation 1 signal was less than 7 candles prior
1-Candle Volatility/Volume Entry
1a. GKD-V Volatility/Volume gives signal
2a. Confirmation 1 agrees
3a. Price inside Goldie Locks Zone Minimum
4a. Price inside Goldie Locks Zone Maximum
5a. Confirmation 1 signal was less than 'Maximum Allowable PSVVC Bars Back' prior
Next Candle
1b. Price retraced
2b. Volatility/Volume agrees
3b. Confirmation 1 agrees
4b. Confirmation 2 agrees
5b. Baseline agrees
Confirmation 2 Entry
1. GKD-C Confirmation 2 gives signal
2. Confirmation 1 agrees
3. Price inside Goldie Locks Zone Minimum
4. Price inside Goldie Locks Zone Maximum
5. Volatility/Volume agrees
6. Baseline agrees
7. Confirmation 1 signal was less than 7 candles prior
1-Candle Confirmation 2 Entry
1a. GKD-C Confirmation 2 gives signal
2a. Confirmation 1 agrees
3a. Price inside Goldie Locks Zone Minimum
4a. Price inside Goldie Locks Zone Maximum
5a. Confirmation 1 signal was less than 'Maximum Allowable PSC2C Bars Back' prior
Next Candle
1b. Price retraced
2b. Confirmation 2 agrees
3b. Confirmation 1 agrees
4b. Volatility/Volume agrees
5b. Baseline agrees
PullBack Entry
1a. GKD-B Baseline gives signal
2a. Confirmation 1 agrees
3a. Price is beyond 1.0x Volatility of Baseline
Next Candle
1b. Price inside Goldie Locks Zone Minimum
2b. Price inside Goldie Locks Zone Maximum
3b. Confirmation 1 agrees
4b. Confirmation 2 agrees
5b. Volatility/Volume agrees
Continuation Entry
1. Standard Entry, 1-Candle Standard Entry, Baseline Entry, 1-Candle Baseline Entry, Volatility/Volume Entry, 1-Candle Volatility/Volume Entry, Confirmation 2 Entry, 1-Candle Confirmation 2 Entry, or Pullback entry triggered previously
2. Baseline hasn't crossed since entry signal trigger
4. Confirmation 1 agrees
5. Baseline agrees
6. Confirmation 2 agrees

BTC Valuation
The BTC Valuation indicator
is a powerful tool designed to assist traders and analysts in evaluating the current state of Bitcoin's market valuation. By leveraging key moving averages and a logarithmic trendline, this indicator offers valuable insights into potential buying or selling opportunities based on historical price value.
Key Features:
200MA/P (200-day Moving Average to Price Ratio):
Provides a perspective on Bitcoin's long-term trend by comparing the current price to its 200-day Simple Moving Average (SMA).
A positive value suggests potential undervaluation, while a negative value may indicate overvaluation.
50MA/P (50-day Moving Average to Price Ratio):
Focuses on short-term trends, offering insights into the relationship between Bitcoin's current price and its 50-day SMA.
Helps traders identify potential bullish or bearish trends in the near term.
LTL/P (Logarithmic TrendLine to Price Ratio):
Incorporates a logarithmic trendline, considering Bitcoin's historical age in days.
Assists in evaluating whether the current price aligns with the long-term logarithmic trend, signaling potential overvaluation or undervaluation.
How to Use:
Z Score Indicator Integration:
The BTC Valuation indicator leverages the Z Score Indicator to score the ratios in a statistical way.
Statistical scoring provides a standardized measure of how far each ratio deviates from the mean, aiding in a more nuanced and objective evaluation.
Z Score Indicator
This BTC Valuation indicator provides a comprehensive view of Bitcoin's valuation dynamics, allowing traders to make informed decisions.
While indicators like BTC Valuation provide valuable insights, it's crucial to remember that no indicator guarantees market predictions.
Traders should use indicators as part of a comprehensive strategy and consider multiple factors before making trading decisions.
Historical performance is not indicative of future results. Exercise caution and continually refine your approach based on market dynamics.

MA / Connectable [Azullian]Streamline trend analysis with the Moving Average indicator. Filter out market noise, aiding in the clear identification of market directions for dynamic strategy development.
This connectable moving average indicator is part of an indicator system designed to help test, visualize and build strategy configurations without coding. Like all connectable indicators , it interacts through the TradingView input source, which serves as a signal connector to link indicators to each other. All connectable indicators send signal weight to the next node in the system until it reaches either a connectable signal monitor, signal filter and/or strategy.
█ UNIFORM SETTINGS AND A WAY OF WORK
Although connectable indicators may have specific weight scoring conditions, they all aim to follow a standardized general approach to weight scoring settings, as outlined below.
■ Connectable indicators - Settings
• 🗲 Energy: Energy applies an ATR multiplier to the plotted shapes on the chart. A higher value plots shapes farther away from the candle, enhancing visibility.
• ☼ Brightness: Brightness determines the opacity of the shape plotted on the chart, aiding visibility. Indicator weight also influences opacity.
• → Input: Use the input setting to specify a data source for the indicator. Here you can connect the indicator to other indicators.
• ⌥ Flow: Determine where you want to receive signals from:
○ Both: Weights from this indicator and the connected indicator will apply
○ Indicator only: Only weights from this indicator will apply
○ Input only: Only weights from the connected indicator will apply
• ⥅ Weight multiplier: Multiply all weights in the entire indicator by a given factor, useful for quickly testing different indicators in a granular setup.
• ⥇ Threshold: Set a threshold to indicate the minimum amount of weight it should receive to pass it through to the next indicator.
• ⥱ Limiter: Set a hard limit to the maximum amount of weight that can be fed through the indicator.
■ Connectable indicators - Weight scoring settings
▢ Weight scoring conditions
• SM – Signal mode: Enable specific conditions for weight scoring
○ Start: A new trend starting will score
○ End: A trend ending will score
○ Zone: Continuous scoring for each candle between the start and the end.
• SP – Signal period: Defines a range of candles within which a signal can score.
• SC - Signal count: Specifies the number of bars to retrospectively examine and score.
○ Single: Score for a single occurrence
○ All occurrences: Score for all occurrences
○ Single + Threshold: Score for single occurrences within the signal period (SP)
○ Every + Threshold: Score for all occurrences within the signal period (SP)
▢ Weight scoring direction
• ES: Enter Short weight
• XL: Exit long weight
• EL: Enter Long weight
• XS: Exit Short weight
▢ Weight scoring values
• Weights can hold either positive or negative scores. Positive weights enhance a particular trading direction, while negative weights diminish it.
█ MA - INDICATOR SETTINGS
■ Main settings
• Enable/Disable Indicator: Toggle the entire indicator on or off.
• T - Type: Choose a type of moving average. (ALMA, EMA, HMA, RMA, SMA, SWMA, VWMA, WMA)
• L - Length: Set a period on which the moving average is calculated.
• F - Filter: Set a conditional filter for scoring:
○ Line direction: Score bullish when the trend line is going up, score bearish when the trendline is going down.
○ Line candle position: Score bullish when the candles are above the current trendline, score bearish when the candles are below the current trendline
○ Any: Score if any of the previously mentioned conditions are true
○ All: Score if all of the previously mentioned conditions are true
• S - Source: Choose an alternative data source for the Moving average calculation.
• T - Timeframe: Select an alternative timeframe for the Moving average calculation.
• C - Candletype: Choose a candletype for the alternative source.
■ Scoring functionality
• For each moving average you'll be able to score Bullish, Bearish or Neutral for each of the conditions as mentioned in the filter above.
█ PLOTTING
• Standard: Symbols (EL, XS, ES, XL) Moving average lines are plotted with bearish, bullish and neutral zones, in the visuals section you can enable plotting by weight which will only show the parts of the moving average line to which weight is addressed.
• Conditional Settings: A larger icon appears if global conditions are met. For instance, with a Threshold(⥇) of 12, Signal Period (SP) of 3, and Scoring Condition (SC) set to "EVERY", a moving average signaling over two times in 3 candles (scoring 6 each) triggers a larger icon.
█ USAGE OF CONNECTABLE INDICATORS
■ Connectable chaining mechanism
Connectable indicators can be connected directly to the signal monitor, signal filter or strategy , or they can be daisy chained to each other while the last indicator in the chain connects to the signal monitor, signal filter or strategy. When using a signal filter you can chain the filter to the strategy input to make your chain complete.
• Direct chaining: Connect an indicator directly to the signal monitor, signal filter or strategy through the provided inputs (→).
• Daisy chaining: Connect indicators using the indicator input (→). The first in a daisy chain should have a flow (⌥) set to 'Indicator only'. Subsequent indicators use 'Both' to pass the previous weight. The final indicator connects to the signal monitor, signal filter, or strategy.
■ Set up this indicator with a signal filter and strategy
The indicator provides visual cues based on signal conditions. However, its weight system is best utilized when paired with a connectable signal filter, signal monitor, or strategy .
Let's connect the MA to a connectable signal filter and a strategy :
1. Load all relevant indicators
• Load MA / Connectable
• Load Signal filter / Connectable
• Load Strategy / Connectable
2. Signal Filter: Connect the MA to the Signal Filter
• Open the signal filter settings
• Choose one of the three input dropdowns (1→, 2→, 3→) and choose : MA / Connectable: Signal Connector
• Toggle the enable box before the connected input to enable the incoming signal
3. Signal Filter: Update the filter signals settings if needed
• The default settings of the filter enable EL (Enter Long), XL (Exit Long), ES (Enter Short) and XS (Exit Short).
4. Signal Filter: Update the weight threshold settings if needed
• All connectable indicators load by default with a score of 6 for each direction (EL, XL, ES, XS)
• By default, weight threshold (TH) is set at 5. This allows each occurrence to score, as the default score in each connectable indicator is 1 point above the threshold. Adjust to your liking.
5. Strategy: Connect the strategy to the signal filter in the strategy settings
• Select a strategy input → and select the Signal filter: Signal connector
6. Strategy: Enable filter compatible directions
• Set the signal mode of the strategy to a compatible direction with the signal filter.
Now that everything is connected, you'll notice green spikes in the signal filter representing long signals, and red spikes indicating short signals. Trades will also appear on the chart, complemented by a performance overview. Your journey is just beginning: delve into different scoring mechanisms, merge diverse connectable indicators, and craft unique chains. Instantly test your results and discover the potential of your configurations. Dive deep and enjoy the process!
█ BENEFITS
• Adaptable Modular Design: Arrange indicators in diverse structures via direct or daisy chaining, allowing tailored configurations to align with your analysis approach.
• Streamlined Backtesting: Simplify the iterative process of testing and adjusting combinations, facilitating a smoother exploration of potential setups.
• Intuitive Interface: Navigate TradingView with added ease. Integrate desired indicators, adjust settings, and establish alerts without delving into complex code.
• Signal Weight Precision: Leverage granular weight allocation among signals, offering a deeper layer of customization in strategy formulation.
• Advanced Signal Filtering: Define entry and exit conditions with more clarity, granting an added layer of strategy precision.
• Clear Visual Feedback: Distinct visual signals and cues enhance the readability of charts, promoting informed decision-making.
• Standardized Defaults: Indicators are equipped with universally recognized preset settings, ensuring consistency in initial setups across different types like momentum or volatility.
• Reliability: Our indicators are meticulously developed to prevent repainting. We strictly adhere to TradingView's coding conventions, ensuring our code is both performant and clean.
█ COMPATIBLE INDICATORS
Each indicator that incorporates our open-source 'azLibConnector' library and adheres to our conventions can be effortlessly integrated and used as detailed above.
For clarity and recognition within the TradingView platform, we append the suffix ' / Connectable' to every compatible indicator.
█ COMMON MISTAKES, CLARIFICATIONS AND TIPS
• Removing an indicator from a chain: Deleting a linked indicator and confirming the "remove study tree" alert will also remove all underlying indicators in the object tree. Before removing one, disconnect the adjacent indicators and move it to the object stack's bottom.
• Point systems: The azLibConnector provides 500 points for each direction (EL: Enter long, XL: Exit long, ES: Enter short, XS: Exit short) Remember this cap when devising a point structure.
• Flow misconfiguration: In daisy chains the first indicator should always have a flow (⌥) setting of 'indicator only' while other indicator should have a flow (⌥) setting of 'both'.
• Hide attributes: As connectable indicators send through quite some information you'll notice all the arguments are taking up some screenwidth and cause some visual clutter. You can disable arguments in Chart Settings / Status line.
• Layout and abbreviations: To maintain a consistent structure, we use abbreviations for each input. While this may initially seem complex, you'll quickly become familiar with them. Each abbreviation is also explained in the inline tooltips.
• Inputs: Connecting a connectable indicator directly to the strategy delivers the raw signal without a weight threshold, meaning every signal will trigger a trade.
█ A NOTE OF GRATITUDE
Through years of exploring TradingView and Pine Script, we've drawn immense inspiration from the community's knowledge and innovation. Thank you for being a constant source of motivation and insight.
█ RISK DISCLAIMER
Azullian's content, tools, scripts, articles, and educational offerings are presented purely for educational and informational uses. Please be aware that past performance should not be considered a predictor of future results.

MA + MACD alert TrendsThis is a strategy/combination of warning indicators using 6MA+MACD.
The strategy details are as follows: This is a simple warning strategy created so that we don't have to monitor the candlestick chart too often.
Note: This isn't an entry strategy; it's a signaling strategy for upcoming trends. For maximum efficiency, we should incorporate more formulas into the command. In the case below, I use Fibonacci to enter the command.
This strategy setting works for a 15-minute time frame, but it can still work for different time frames.
It has been working well with Gold and USOIL for the last two years, as well as with currency pairs like EURUSD and many others.
Components:
EMA100 + EMA200 + MA400 + MA800
MACD (timeframe greater than 1 timeframe)
Fibonacci retreat.
Uptrend alert:
Candles on both EMAs (100-200) + 2 SMAs (400-800)
In the previous 80 candles:
EMA100 cross up to EMA200
At the same time, the MACD cross up 0.
The uptrend warning will trigger when EMA6 cuts down to MA10. That's when the price creates the top and we'll wait for the market to go back to the Fibonacci threshold of 0.618 and start buying (or wait for markets to break up the trendline to buy).
Downtrend alert:
Candles are below both EMAs ( 100-200 ) + 2 SMAs ( 400-800 )
In the previous 80 candles:
EMA100 cross down to EMA200
At the same time, the MACD cross down zero.
The downtrend warning will trigger when EMA6 cuts to MA10. That's when the price creates a bottom and we'll wait for the market to go back to the Fibonacci threshold of 0.618 and start selling (or wait for the market to break down the trendline to sell).
Recommended RR: 1:1
If you have any questions please let me know!

NET on Variety Moving Averages [Loxx]NET (Noise Elimination Technology) on Variety Moving Averages is a moving average indicator that applies John Ehlers' NET (Noise Elimination Technology) to your choice of 36 different moving averages.
█ What is NET (Noise Elimination Technology)?
Noise Elimination Technology (NET) is a method introduced by John Ehlers to enhance the clarity of technical indicators by removing noise without resorting to filtering. Here's a more detailed explanation:
Purpose of Technical Indicators: Technical indicators aim to provide insights into market inefficiencies, assisting traders in making informed decisions. However, many indicators are inherently noisy due to their reliance on a limited amount of data.
Traditional Noise Removal: Noise in indicators is typically removed using smoothing filters. While these filters can reduce noise, they introduce lag, leading to potentially delayed trading decisions which can be costly.
NET's Approach: NET offers a solution to this problem by using the nonlinearity of a rank-ordered Kendall correlation. Instead of filtering, NET clarifies indicators by focusing on their main direction and stripping out noise components.
Kendall Correlation: This is a statistical method that compares the ranked order of two sets of random variables. These pairs of ranked variables can be either concordant or discordant. In the context of NET:
The "y" variable represents a straight line with a positive slope.
The "x" variable is the output of the technical indicator.
When applied, the Kendall correlation in this configuration removes noise components that don't align with the primary direction of the indicator.
NET's Mechanism:
The "y" variable (a straight line with a positive slope) and the "x" variable (indicator output) are used in the Kendall correlation.
This correlation essentially removes noise components not aligned with the main direction of the indicator in a nonlinear manner.
The effectiveness of NET lies in its ability to reduce noise without introducing lag.
Flexibility: NET is designed to be versatile and can be applied to various technical indicators. It doesn't necessarily replace traditional smoothing filters but can complement them to provide a clearer visual representation of the indicator's behavior.
In essence, NET offers a novel approach to refining technical indicators by removing noise using the principles of Kendall correlation, without the drawbacks associated with traditional smoothing filters.
█ Moving Average Types
ADXvma - Average Directional Volatility Moving Average
Ahrens Moving Average
Alexander Moving Average - ALXMA
Double Exponential Moving Average - DEMA
Double Smoothed Exponential Moving Average - DSEMA
Exponential Moving Average - EMA
Fast Exponential Moving Average - FEMA
Fractal Adaptive Moving Average - FRAMA
Hull Moving Average - HMA
IE/2 - Early T3 by Tim Tilson
Integral of Linear Regression Slope - ILRS
Instantaneous Trendline
Laguerre Filter
Leader Exponential Moving Average
Linear Regression Value - LSMA (Least Squares Moving Average)
Linear Weighted Moving Average - LWMA
McGinley Dynamic
McNicholl EMA
Non-Lag Moving Average
Parabolic Weighted Moving Average
Recursive Moving Trendline
Simple Moving Average - SMA
Sine Weighted Moving Average
Smoothed Moving Average - SMMA
Smoother
Super Smoother
Three-pole Ehlers Butterworth
Three-pole Ehlers Smoother
Triangular Moving Average - TMA
Triple Exponential Moving Average - TEMA
Two-pole Ehlers Butterworth
Two-pole Ehlers smoother
Volume Weighted EMA - VEMA
Zero-Lag DEMA - Zero Lag Double Exponential Moving Average
Zero-Lag Moving Average
Zero Lag TEMA - Zero Lag Triple Exponential Moving Average
█ Included
Bar coloring
Alerts
Channels fill
Loxx's Expanded Source Types
█ Libraries included
loxxmas - moving averages used in Loxx's indis & strats
loxxexpandedsourcetypes

Tri-State SupertrendTri-State Supertrend: Buy, Sell, Range
( Credits: Based on "Pivot Point Supertrend" by LonesomeTheBlue.)
Tri-State Supertrend incorporates a range filter into a supertrend algorithm.
So in addition to the Buy and Sell states, we now also have a Range state.
This avoids the typical "whipsaw" problem: During a range, a standard supertrend algorithm will fire Buy and Sell signals in rapid succession. These signals are all false signals as they lead to losing positions when acted on.
In this case, a tri-state supertrend will go into Range mode and stay in this mode until price exits the range and a new trend begins.
I used Pivot Point Supertrend by LonesomeTheBlue as a starting point for this script because I believe LonesomeTheBlue's version is superior to the classic Supertrend algorithm.
This indicator has two additional parameters over Pivot Point Supertrend:
A flag to turn the range filter on or off
A range size threshold in percent
With that last parameter, you can define what a range is. The best value will depend on the asset you are trading.
Also, there are two new display options.
"Show (non-) trendline for ranges" - determines whether to draw the "trendline" inside of a range. Seeing as there is no trend in a range, this is usually just visual noise.
"Show suppressed signals" - allows you to see the Buy/Sell signals that were skipped by the range filter.
How to use Tri-State Supertrend in a strategy
You can use the Buy and Sell signals to enter positions as you would with a normal supertrend. Adding stop loss, trailing stop etc. is of course encouraged and very helpful. But what to do when the Range signal appears?
I currently run a strategy on LDO based on Tri-State Supertrend which appears to be profitable. (It will quite likely be open sourced at some point, but it is not released yet.)
In that strategy, I experimented with different actions being taken when the Range state is entered:
Continue: Just keep last position open during the range
Close: Close the last position when entering range
Reversal: During the range, execute the OPPOSITE of each signal (sell on "buy", buy on "sell")
In the backtest, it transpired that "Continue" was the most profitable option for this strategy.
How ranges are detected
The mechanism is pretty simple: During each Buy or Sell trend, we record price movement, specifically, the furthest move in the trend direction that was encountered (expressed as a percentage).
When a new signal is issued, the algorithm checks whether this value (for the last trend) is below the range size set by the user. If yes, we enter Range mode.
The same logic is used to exit Range mode. This check is performed on every bar in a range, so we can enter a buy or sell as early as possible.
I found that this simple logic works astonishingly well in practice.
Pros/cons of the range filter
A range filter is an incredibly useful addition to a supertrend and will most likely boost your profits.
You will see at most one false signal at the beginning of each range (because it takes a bit of time to detect the range); after that, no more false signals will appear over the range's entire duration. So this is a huge advantage.
There is essentially only one small price you have to pay:
When a range ends, the first Buy/Sell signal you get will be delayed over the regular supertrend's signal. This is, again, because the algorithm needs some time to detect that the range has ended. If you select a range size of, say, 1%, you will essentially lose 1% of profit in each range because of this delay.
In practice, it is very likely that the benefits of a range filter outweigh its cost. Ranges can last quite some time, equating to many false signals that the range filter will completely eliminate (all except for the first one, as explained above).
You have to do your own tests though :)

CoinFxPro Range indicator V 1.0This indicator has a structure that combines daily and weekly pivot levels, moving averages, and strength index-linked oscillators. The purpose of the indicator is designed to analyze price movements and identify potential trend reversals. Daily pivot levels are helpful in identifying critical support and resistance zones, while moving averages and oscillators indicate overbought or oversold situations in the price.
It is very simple to use and simple in appearance.
Triangular Signals appearing on the chart screen come when the price touches the daily or weekly support and resistance levels.
If you want the signals to be received less or more healthy, I added the filtering feature. In this way, you can filter the incoming signals through the volume or volatility filter, so that less signals are received.
On the other hand, the 4 timeframe rsi values of the price for daily use of the indicator are also given in the table.
You can change the RSI timeframes as you wish.
In this way, it is seen more clearly whether the signal is healthy and provides convenience while trading.
Evaluation of incoming signals;
First of all, when the signal occurs, pay attention to whether the RSI values that occur in the timeframe you trade and in other timeframes are overbought (red) or oversold (green).
When the signal comes, I buy or sell, especially if the RSI values in the 5 minutes, 15 minutes and 1 hour time periods are overbought or oversold.
If you wish, you can try a different strategy for yourself.
After the healthiest of the signals on the chart comes, the RSI values are also at overbought or oversold levels in 5-15 minutes and 1 hour timeframes and if there is a Trendline line above or below the price, it is out of that region.
A healthy buying or selling transaction can be made.
It should be noted that since risk = return, high risk means high return. High risk must be taken for high returns. Therefore, I recommend that you do not exceed 10% of your capital as margin when trading with leverage.
When trading, I always recommend trading with additional confirmation from a different indicator.
I also added a filtering feature to the indicator to block market structure related variables. Those who want to use can also use filtering.
I have added the automatic trendline for ease of trading. You can increase or decrease the number of trend lines as you wish.
I just published the indicator for daily use.