BTC 5 min SHBHilalimSB A Wedding Gift 🌙
What is HilalimSB🌙?
First of all, as mentioned in the title, HilalimSB is a wedding gift.
HilalimSB - Revealing the Secrets of the Trend
HilalimSB is a powerful indicator designed to help investors analyze market trends and optimize trading strategies. Designed to uncover the secrets at the heart of the trend, HilalimSB stands out with its unique features and impressive algorithm.
Hilalim Algorithm and Fixed ATR Value:
HilalimSB is equipped with a special algorithm called "Hilalim" to detect market trends. This algorithm can delve into the depths of price movements to determine the direction of the trend and provide users with the ability to predict future price movements. Additionally, HilalimSB uses its own fixed Average True Range (ATR) value. ATR is an indicator that measures price movement volatility and is often used to determine the strength of a trend. The fixed ATR value of HilalimSB has been tested over long periods and its reliability has been proven. This allows users to interpret the signals provided by the indicator more reliably.
ATR Calculation Steps
1.True Range Calculation:
+ The True Range (TR) is the greatest of the following three values:
1. Current high minus current low
2. Current high minus previous close (absolute value)
3. Current low minus previous close (absolute value)
2.Average True Range (ATR) Calculation:
-The initial ATR value is calculated as the average of the TR values over a specified period
(typically 14 periods).
-For subsequent periods, the ATR is calculated using the following formula:
ATRt=(ATRt−1×(n−1)+TRt)/n
Where:
+ ATRt is the ATR for the current period,
+ ATRt−1 is the ATR for the previous period,
+ TRt is the True Range for the current period,
+ n is the number of periods.
Pine Script to Calculate ATR with User-Defined Length and Multiplier
Here is the Pine Script code for calculating the ATR with user-defined X length and Y multiplier:
//@version=5
indicator("Custom ATR", overlay=false)
// User-defined inputs
X = input.int(14, minval=1, title="ATR Period (X)")
Y = input.float(1.0, title="ATR Multiplier (Y)")
// True Range calculation
TR1 = high - low
TR2 = math.abs(high - close )
TR3 = math.abs(low - close )
TR = math.max(TR1, math.max(TR2, TR3))
// ATR calculation
ATR = ta.rma(TR, X)
// Apply multiplier
customATR = ATR * Y
// Plot the ATR value
plot(customATR, title="Custom ATR", color=color.blue, linewidth=2)
This code can be added as a new Pine Script indicator in TradingView, allowing users to calculate and display the ATR on the chart according to their specified parameters.
HilalimSB's Distinction from Other ATR Indicators
HilalimSB emerges with its unique Average True Range (ATR) value, presenting itself to users. Equipped with a proprietary ATR algorithm, this indicator is released in a non-editable form for users. After meticulous testing across various instruments with predetermined period and multiplier values, it is made available for use.
ATR is acknowledged as a critical calculation tool in the financial sector. The ATR calculation process of HilalimSB is conducted as a result of various research efforts and concrete data-based computations. Therefore, the HilalimSB indicator is published with its proprietary ATR values, unavailable for modification.
The ATR period and multiplier values provided by HilalimSB constitute the fundamental logic of a trading strategy. This unique feature aids investors in making informed decisions.
Visual Aesthetics and Clear Charts:
HilalimSB provides a user-friendly interface with clear and impressive graphics. Trend changes are highlighted with vibrant colors and are visually easy to understand. You can choose colors based on eye comfort, allowing you to personalize your trading screen for a more enjoyable experience. While offering a flexible approach tailored to users' needs, HilalimSB also promises an aesthetic and professional experience.
Strong Signals and Buy/Sell Indicators:
After completing test operations, HilalimSB produces data at various time intervals. However, we would like to emphasize to users that based on our studies, it provides the best signals in 1-hour chart data. HilalimSB produces strong signals to identify trend reversals. Buy or sell points are clearly indicated, allowing users to develop and implement trading strategies based on these signals.
For example, let's imagine you wanted to open a position on BTC on 2023.11.02. You are aware that you need to calculate which of the buying or selling transactions would be more profitable. You need support from various indicators to open a position. Based on the analysis and calculations it has made from the data it contains, HilalimSB would have detected that the graph is more suitable for a selling position, and by producing a sell signal at the most ideal selling point at 08:00 on 2023.11.02 (UTC+3 Istanbul), it would have informed you of the direction the graph would follow, allowing you to benefit positively from a 2.56% decline.
Technology and Innovation:
HilalimSB aims to enhance the trading experience using the latest technology. With its innovative approach, it enables users to discover market opportunities and support their decisions. Thus, investors can make more informed and successful trades. Real-Time Data Analysis: HilalimSB analyzes market data in real-time and identifies updated trends instantly. This allows users to make more informed trading decisions by staying informed of the latest market developments. Continuous Update and Improvement: HilalimSB is constantly updated and improved. New features are added and existing ones are enhanced based on user feedback and market changes. Thus, HilalimSB always aims to provide the latest technology and the best user experience.
Social Order and Intrinsic Motivation:
Negative trends such as widespread illegal gambling and uncontrolled risk-taking can have adverse financial effects on society. The primary goal of HilalimSB is to counteract these negative trends by guiding and encouraging users with data-driven analysis and calculable investment systems. This allows investors to trade more consciously and safely.
What is BTC 5 min ☆SHB Strategy🌙?
BTC 5 min ☆SHB Strategy is a strategy supported by the HilalimSB algorithm created by the creator of HilalimSB. It automatically opens trades based on the data it receives, maintaining trades with its uniquely defined take profit and stop loss levels, and automatically closes trades when necessary. It stands out in the TradingView world with its unique take profit and stop loss markings. BTC 5 min ☆SHB Strategy is close to users' initiatives and is a strategy suitable for 5-minute trades and scalp operations developed on BTC.
What does the BTC 5 min ☆SHB Strategy target?
The primary goal of BTC 5 min ☆SHB Strategy is to close trades made by traders in short timeframes as profitably as possible and to determine the most effective trading points in low time periods, considering the commission rates of various brokerage firms. BTC 5 min ☆SHB Strategy is one of the rare profitable strategies released in short timeframes, with its useful interface, in addition to existing strategies in the markets. After extensive backtesting over a long period and achieving above-average success, BTC 5 min ☆SHB Strategy was decided to be released. Following the completion of test procedures under market conditions, it was presented to users with the unique visual effects of ☆SB.
BTC 5 min ☆SHB Strategy and Heikin Ashi
BTC 5 min ☆SHB Strategy produces data in Heikin-Ashi chart types, but since Heikin-Ashi chart types have their own calculation method, BTC 5 min ☆SHB Strategy has been published in a way that cannot produce data in this chart type due to BTC 5 min ☆SHB Strategy's ideology of appealing to all types of users, and any confusion that may arise is prevented in this way. Heikin-Ashi chart types, especially in short time intervals, carry significant risks considering the unique calculation methods involved. Thus, the possibility of being misled by the coder and causing financial losses has been completely eliminated. After the necessary conditions determined by the creator of BTC 5 min ☆SHB are met, BTC 5 min ☆SHB Heikin-Ashi will be shared exclusively with invited users only, upon request, to users who request an invitation.
Key Features:
+HilalimSHB Algorithm: This algorithm uses a dynamic ATR-based trend-following mechanism to identify the current market trend. The strategy detects trend reversals and takes positions accordingly.
+Heikin Ashi Compatibility: The strategy is optimized to work only with standard candlestick charts and automatically deactivates when Heikin Ashi charts are in use, preventing false signals.
+Advanced Chart Enhancements: The strategy offers clear graphical markers for buy/sell signals. Candlesticks are automatically colored based on trend direction, making market trends easier to follow.
Strategy Parameters:
+Take Profit (%): Defines the target price level for closing a position and automates profit-taking. The fixed value is set at 2%.
+Stop Loss (%): Specifies the stop-loss level to limit losses. The fixed value is set at 3%.
The shared image is a 5-minute chart of BTCUSDC.P with a fixed take profit value of 2% and a fixed stop loss value of 3%. The trades are opened with a commission rate of 0.063% set for the USDT trading pair on Binance.🌙
"scalp" için komut dosyalarını ara

TradeTale 1 Min Nifty/Banknifty/Crypto F&O ScalperThis script explains how 'MACD' along with Avg of Simple Moving Averages can be used to catch trend.
Simple Moving Average (MA):-
A simple moving average (SMA) is used in technical analysis, used to help smooth out price data by creating a constantly updated average price. A rising moving average indicates that the security is in an uptrend, while a declining moving average indicates a downtrend. here in this indicator we have used average of various SMA's.
Moving Average Convergence/Divergence (MACD):-
MACD is a technical indicator to identify price trends, measure trend momentum, and identify market entry points for bullish or bearish trend. Moving average convergence/divergence (MACD) is a trend-following momentum indicator that shows the relationship between two exponential moving averages (EMAs) of a security’s price. MACD traditional default settings is 26/12/9. Where MACD line is calculated by subtracting the 26 period exponential moving average (EMA) from the 12 period EMA and the signal line is a 9 period EMA of the MACD line. But in this indicator we have used modified values of MACD.
Logic of this indicator:-
Long signals when MACD is in Uptrend and is above Avg of SMA's. (also other calculations are used)
Short signals when MACD is in Downtrend and is below Avg of SMA's. (also other calculations are used)
How to Use:-
Long: when Long appears + Bullish Candles + price above Avg SMA Line. (Bullish Entry/ Bear Exit)
Short: when Short appears + Bearish Candles + price below Avg SMA Line. (Bearish Entry/ Bull Exit)
Chart Timeframe:-
Scalping on 1 Minute Chart. But this Indicator works on all timeframes.
Traders should set stop loss and take profit levels as per risk reward ratio.
Note:
- Hide the actual candles for better view from chart setting.
- User can also adjust the sensitivity of the indicator from the setting. Default value is "3"
Like other technical indicators, This indicator also is not a holy grail. It can only assist you in building a good strategy. You can only succeed with proper position sizing, risk management and following correct trading Psychology (No overtrade, No greed, No revenge trade etc).
THIS INDICATOR IS FOR EDUCATIONAL PURPOSE AND PAPER TRADING ONLY. YOU MAY PAPER TRADE TO GAIN CONFIDENCE AND BUILD FURTHER ON THESE. PLEASE CONSULT YOUR FINANCIAL ADVISOR BEFORE INVESTING. WE ARE NOT SEBI REGISTERED.
Hope you all like it
happy learning.

RN3 Ichimoku PVSRA Scalper IndicatorThis indicator will place long (buy) and short (sell) orders using the Ichimoku Tenkan Kijun Cross strategy. When in a trade position, it will create take profit levels using Fibonacci against the highest high or lowest low of the past 2 days. You can define your own level and set your own stop loss just in case.
Senkou Span will act as your main bias.
if the price under the cloud so the bias will be bearish. You may want to focus on selling(short) on this direction.
if the price above the cloud so bias will be bullish, You may want to focus on buying(long) on this direction.
This is for scalping, but it possible to do swing.
Suggested Symbols : Forex / Crypto / Commodities
Timeframe for Entry : Less than 1D TF
Additional controls include:
PVSRA Candle
M Pivot
VWAP
B1: Yesterday High B2: Yesterday Low
C1: Today High C2: Today Low.
Here's the way you can utilize the script.
First look at the Yesterday high, and Yesteday Low.
You need to consider that would be the symbols can travel into.
If today high has broke yesteray high, there's possibly the price will can keep higher and will create new high. Likewise if today lowest broke yesterday low, there's possibly the price can keep dropping and create new low.
VWAP : You can use this to determine if the price is fair or not, the more it's trading away away the vwap this will determine if it's overbought, or oversold.
PVSRA :
using 10 Periods, it's determine the volume.
Blue(Bullish) and Pink(Bearish) the 150% more Volume from previous bar.
Green(Bullish) and Red(Bearish) the 200% more Volume from previous bar.

[AlbaTherium] MTF External Ranges Analysis - ERA-Orion for SMC MTF External Ranges Analysis - ERA - Orion for Smart Money Concepts
Introduction:
The MTF External Ranges Analysis - ERA - Orion offers enhanced insights into multi-timeframe external structure points, swing structure points, POIs (Points of Interest), and order blocks (OB) . By incorporating this enhancement, your multi-timeframe analysis are streamlined, simplifying the process and reducing chart workload, no need for manual chart drawing anymore, stay focus on Low Time Frame and get High Time Frame insights in one single Time frame.
This identification process remains effective even when focusing on Lower Time Frames (LTF), providing detailed insights without sacrificing the broader market perspective.
The MTF External Ranges Analysis - ERA – Orion is specifically designed to be used in conjunction with OptiStruct™ Premium for Smart Money Concepts . This strategic combination enhances the workflow of identifying optimal entry points. OptiStruct acts as the analysis tool for Lower Time Frames (LTF), zeroing in on immediate interest areas, while Orion expands this analysis to Higher Time Frames (HTF), providing a broader view of market trends and importants key levels . The integration of Orion with OptiStruct seamlessly merges LTF and HTF analyses, ensuring a thorough understanding of market dynamics for informed and strategic decision-making. This toolkit in one package assembly is pivotal for traders relying on Smart Money Concepts, offering unmatched clarity and actionable insights to navigate the markets effectively.
This tool offers an advanced smart money technical analysis to improve your trading experience. It introduces four key concepts:
Main Features:
Entries Enhancements
Inducements HTF
High/Low Markings HTF
Multiple Timeframes and Confluences on Extreme, Dec and SMT Order Blocks
By integrating these concepts into one, traders can identify high-probability zones across multiple timeframes and develop a thorough understanding of market dynamics. These confluence zones enhance order block skills and potential, establishing them as essential pillars in smart money trading strategies and enabling traders to make more informed decisions.
Settings Overview:
HTF Settings Enable HTF Analysis
Select timeframe {Select or 4H Chart}
Labels Alignment for Lines and Boxes
Inside bar ranges HTF
Break of Structure /Change of Character HTF
Inducements HTF
High/Low Markings HTF
High/Low Sweeps HTF
Extreme Order Blocks HTF
Decisional Order Blocks HTF
Smart Money Traps HTF
IDM Demands and Supplies HTF
Historical Order Blocks HTF
OB Mitigation HTF {touch/ extended}
Understanding the Features:
Chapter 1: Entries Enhancements
In this chapter, we delve into strategies to refine trading entries, focusing on the multi-timeframe analysis of extreme or decisional order blocks in the High Time Frame timeframe as a key point of interest. We highlight the significance of transitioning to the Low Time Frame chart for observing pivotal shifts in market behavior. By examining these concepts, traders can gain deeper insights into market dynamics and make more informed entries decisions at critical junctures.
Practical Example:
We had an Order Block Extreme on the 1-hour timeframe, and currently, we are on the recommended chart for trade entry, which is the 5-minute timeframe. We are patiently waiting to observe a 5-minute ChoCh in the market to enter a buying position since it's an OB Extreme Demand on the 1-hour timeframe. Here, it's crucial and important to focus on the entry timeframe rather than checking what's happening in the higher timeframe. The indicator facilitates this task as it provides us with real-time perspective and visibility of everything happening in the higher timeframe.
Chapter 2: Inducements HTF
It is important and useful to be aware of the various liquidity points across the different timeframes we use; sometimes, a reliable entry point in the Lower Time Frame (LTF) may be surrounded by inducements. Consequently, this point becomes unreliable, and prior to the arrival of this functionality, such anomalies could not be detected, especially when focusing on the market in the LTF. From now on, there will be no more such issues.
Practical Example:
Suppose we identify an Order Block Extreme on the 5M timeframe, indicating a potential entry level. However, when we switch to the 5M timeframe to look for an entry point, we observe an accumulation of inducements around this Order Block coming from a higher timeframe, whether it's M15 or H1. This suggests a potential weakness in the entry point and significant market liquidity, which will act as a trap zone. Before the introduction of this feature, we might have missed this crucial observation, but now we can detect these anomalies and adjust our strategy accordingly.
The only practical way to see theses confluences is to use this Indicator, see the example below
Chapter 03: High/Low – Bos - ChoCh Markings HTF
The High/Low Markings HTF feature in the MTF External Ranges Analysis - ERA - Orion provides a comprehensive view into the market's heartbeat across different timeframes, right from within the convenience of the Lower Time Frame (LTF). It meticulously highlights pivotal shifts, allowing traders to seamlessly discern market sentiment and anticipate potential price reversals without needing to toggle between multiple charts. This innovation ensures that critical market movements and sentiment across various timeframes are visible and actionable from a single, focused LTF perspective, enhancing decision-making and strategic planning in trading activities.
Understanding High/Low Markings in HTF Analysis
High/Low Markings in High Time Frame (HTF) analysis mark the market's extremities within a given period, pinpointing potential areas for reversals or continuation and delineating crucial support and resistance levels. These markings are not arbitrary but represent significant market responses, serving as essential indicators for traders and analysts to gauge market momentum and sentiment.
The Role of HTF in Market Analysis
HTF analysis extends a comprehensive view over market movements, distinguishing between ephemeral fluctuations and substantial trend shifts. By scrutinizing these high and low points across wider time frames, analysts can unravel the underlying market momentum, enabling more strategic, informed trading decisions.
Identifying High/Low Markings
Identifying these crucial points entails detailed chart analysis over extended durations—daily, weekly, or monthly. The search focuses on the utmost highs and lows within these periods, which are more than mere points on a chart. They are significant market levels that have historically elicited robust market reactions, serving as key indicators for future market behavior.
Real-world Example:
Chapter 04: Multiple Timeframes and Confluences on Extreme, Dec and SMT Order Blocks Across HTF
The Orion indicator serves as a bridge between the multiple dimensions of the market, enabling a unified and strategic interpretation of potential movements. It's an indispensable tool for those seeking to capitalize on major opportunity zones, where the convergence of diverse perspectives creates ideal conditions for significant market movements.
Designed to navigate through the data of different timeframes and market analysis, Orion provides a clear and consolidated view of major points of interest. With this indicator, traders can not only spot opportunity zones where consensus is strongest but also adjust their strategies based on the dynamic interaction of various market participants, all while remaining within the Lower Time Frame (LTF).
Conclusion:
MTF External Ranges Analysis - ERA - Orion for Smart Money Concepts as “ The Orion ” indicator captures consensus among scalpers, day traders , swing traders, and investors, turning key areas into major opportunities. It allows for precise identification of areas of interest by analyzing the convergence of actions from various market participants. In short, Orion is crucial for detecting and leveraging the most promising points of convergence in the market.
This identification occurs even while focusing on Lower Time Frames (LTF), allowing for detailed insights without losing the broader market perspective.
This document provides an extensive overview of MTF External Ranges Analysis - ERA - Orion , emphasizing its importance in comprehending market dynamics and utilizing essential smart money concepts trading principles.

EMA Scalp Alerts by Sabir KhanThis TradingView indicator, developed by Sabir Khan, is designed for scalping strategies based on Exponential Moving Averages (EMAs). The indicator visually represents three EMAs with customizable parameters and provides alerts for potential trading signals.
Key Features:
Fast EMA: User-configurable fast EMA with default period set to 21.
Slow EMA: User-configurable slow EMA with default period set to 55.
Third EMA: User-configurable third EMA with default period set to 200.
Line Width: Adjustable line width for the fast and third EMAs, allowing customization for better visibility.
Color Customization: Choose colors for each EMA to suit your chart preferences.
Alerts: Automatic alerts for potential trading signals:
Long Signal: Triggered when the fast EMA crosses above the slow EMA.
Short Signal: Triggered when the fast EMA crosses below the slow EMA.
All EMAs Crossover: Triggered when all three EMAs cross over, indicating a potentially strong trend.
Usage:
Users can observe the visual representation of the three EMAs on the chart.
Alerts are generated for potential long, short, or strong trend signals based on EMA crossovers.
The indicator's parameters, including EMA periods, line widths, and colors, are customizable to fit individual preferences.
Alert Message Format:
The alert message provides essential information about the detected signal, including the signal type (Long, Short, None), the involved symbol, timeframe, open, close, high, low, and whether a strong crossover is detected.
Note: This indicator is particularly suitable for traders employing scalp trading strategies focusing on short-term market movements.
*Disclaimer: Trading involves risk, and users should conduct their own research and analysis before making any trading decisions based on this indicator.*

Cosmic GravityCosmic Gravity draws dynamic non-repainting trendlines and helps
⭐ know when to scalp
⭐ predict the position and timing of the next major reversal
⭐ predict sudden changes in volatility
⭐ recognize if the trend is bearish or bullish
👀 HOW IT WORKS
Cosmic Gravity draws a dynamic channel consisting of a basis line and several support and resistance levels for low/medium/high volatility situations, as defined by the Inner Channel and 2 Outer Channel plots respectively. The script achieves this by reducing a large number of select moving averages, their multiples, and other trend levels into a single basis line and deriving the remaining plots off of it using ATR and probability-constant multiples. The basis line color is determined by its smoothed vector similar to how our Cosmic Vector indicator paints its plot. The aim of this indicator is to provide a consistent and generic price context that works out-of-the-box; accordingly a single static average period is used throughout and the settings have been stripped to the bare minimum with no need to ever update them.
📗 HOW TO USE IT
Cosmic Gravity's channel levels are meant to be used as a guide for entering and exiting positions and setting stop-loss and take profit levels. The indicator is deemed effective for any particular timeframe as long as the price stays within the maximum bounds of the indicator's plots. For this reason it is recommended to use Cosmic Gravity in a multi-chart layout where each chart has a different timeframe. The 5 primary strategies are:
long when the price reverses off of an Outer Channel support level and short when the price reverses off of an Outer Channel resistance level
long when the price crosses above the basis line after being below it for a prolonged period and vice-versa (short when the price trend moves below the basis line)
long when the basis line color turns blue after being pink for a prolonged period and visa-versa (short when the basis line color turns pink)
long/short in the direction the price takes when it goes outside the Magnetic Gravity channel when this channel is in a tight squeeze
scalp as the price bounces between the Inner Channel levels (do this only while the price is contained inside the Inner Channel )
🔔 SMART ALERTS
Get notified at the most critical times with a single alert. Simply select Cosmic Gravity - Any alert() function call as the condition when creating an alert and you will be tipped-off on bar-close as follows:
RR↘ (price close crossed below Outer Channel R6 plot)
RR↗ (price high crossed above Outer Channel R6 plot)
R└ (price low entered R channel from above)
R┘ (price high exited R channel from above)
R┐ (price high exited R channel from below)
R┌ (price high entered R channel from below)
B↘ (price high crossed below Basis plot)
B↗ (price low crossed above Basis plot)
B╮ ( Basis vector turned negative)
B╯ ( Basis vector turned positive)
S└ (price low entered S channel from above)
S┘ (price low exited S channel from above)
S┐ (price low exited S channel from below)
S┌ (price high entered S channel from below)
SS↘ (price low crossed below Outer Channel S6 plot)
SS↗ (price close crossed above Outer Channel S6 plot)
For example, an alert such as Cosmic Gravity 6H R┐ B↘ means that during the last 6-hour bar the price exited the R channel from below and also crossed below the basis line.
🚩 DISCLAIMER
The information we create and publish here is not prohibited, doesn't constitute investment advice, and isn't created solely for qualified investors.

Stochastic Rsi+Ema - Auto Buy Scalper Scirpt v.0.3Simple concept for a scalping script, written for 5 minute candles, optimized for BTC.
1st script I've created from scratch, somewhat from scratch. Also part of the goal of this one is to hold coin as often as possible, whenever it's sideways or not dropping significantly.
Designed to buy on the stochastic bottoms (K>D and rising, and <17)
Then and sell after 1 of 3 conditions;
a. After the price goes back up at least 1 % and then 1-2 period ema reversal
b. After the rsi reversal (is dropping) and K

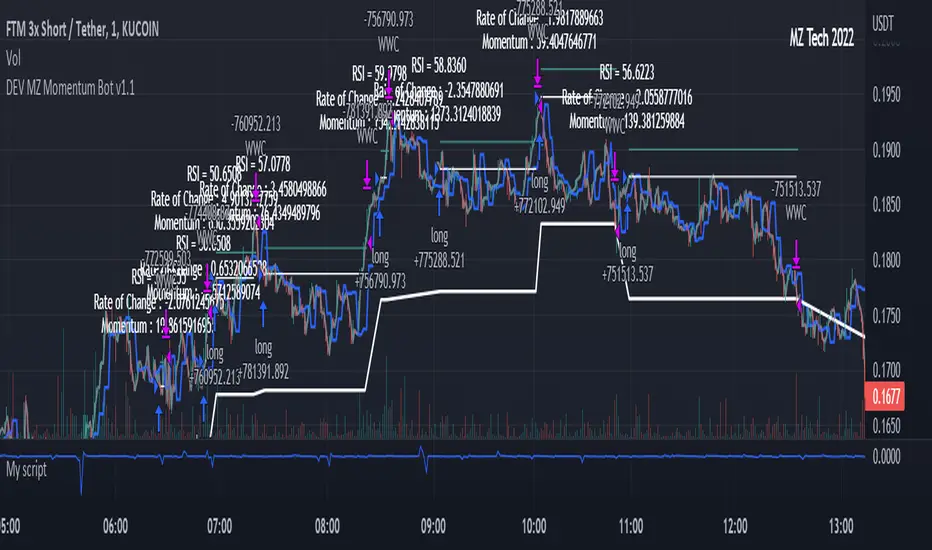
MZ Momentum Non Repainting HTF HFT Scalper BotThis is an original script meant to be a high frequency trader that works on higher time frame calculations. I came up with the idea that using calculus I can figure out the actual rate of change and momentum with different calculations than the momentum indicator that is provided by trading view. Once momentum is shifted on a small time frame, it will provide an entry signal. The script is meant to be used on an algorithmic trading system for scalping purposes. It should be run on a one minute time frame.
Set it up on a one minute chart - setup your bot on a one minute interval.
Find the source of your data. You can use any time frame, open, close. high, low, olc4. Open is pretty much guaranteed to not have any repainting issues - although all the other calcs use a custom isbarconfirmed security repaint calculation.
Set your rate of change period - typically I use a one minute time frame for this as well - but set my length fairly long (30-40).
Then set your period for momentum calculation. This will sample the rate of change data to figure out your momentum. I typically try a setting of 6-8. If that doesn't work, try setting it about the same as the rate of change period and add or subtract a few from there.
Unfortunately due to various plotting constraints in Pinescript, you cannot plot the rate of change and momentum and price in the same.
Set your trigger point. I try values -30, -20, -10, 0, 1. Then finesse to get an earlier entry signal. You should account for a slight delay from the signal to the actual entry. Your backtest should test well, but please note that does not gaurantee results. In my findings, I have seen that there is a slight minimal delay between signal to entry and that can make the difference whether your trade is profitable or not.
Use the show data to show you additional data when you are backtesting. This can allow you to try to filter out results or market conditions that do not work. I typically work with the RSI and use the 30 minute and 15 minute RSIs. I make sure that it is trading within a certain band - about 40-75. You can try the inverse and only buy during really low RSI's as well.
Use the enter and close messages to setup your webhook messages. But I recommend to allow the algo trading platform to close the trade for you based on their calcs since that platform knows the actual price level and when it has become profitable.
Filters have been setup for
Moving Average Variants - any time frame, any length.
RSI - Any time frame, any length,
Future Plans: ATR Filter so you can filter out low volatility periods.
Send me a message with any suggestions.
Kam+ ScalpingThis study project is a Scalping trading Tool that incorporates the majority of the indicators needed to analyse and scalp Trends for 1min, 5min or 15min charts. Incorporated within this tool are the following indicators:
1. Major industry (Banks) recognised important SMAs
3SMA
2. Kijun Sen+ for entry
3. Atr Stop Loss For Stop Loss Entry/Exit.
Hint:- Use With Rsi Time Frame 15 min Custom, And Volume Flow Indicator For Trade Conformation

MACD Indicator for 5 Min ScalpThis Indicator merges the 1 min MACD with BollingerBands to dedect a bigger than avarage tick on the Macd for the 5 min Scalping Strategy
You can change the length of the bollinger bands for the upper and lower channel individually so that you can get better signals
if a tick is bigger than avarage it will be colored, else it would be gray
this is the same indicator i used to get entrys in my 5 min scalping statagy, but i wouldnt just go in a trade when there is a bigger than usual tick. You have to look at other things to

Profitable Contrarian scalpingUses the 5 period and 10 period VMWAs that have been smoothed with a 5 period SMA of the close price. Normally, a short crossover long formation signals a buy signal, but as scalpers know, the 1 minute chart moves so fast and with so much volatility that lagging indicators get wrecked by the market. According, this strategy operates under the assumption that by the time this lagging indicator makes a signal, the price is ready to reverse. Losses are taken swiftly in the case of a continuation pattern. This indicator averages a 55-65% profitable rate and is almost always a positive P/L on the 1 minute chart of the most commonly traded assets.
Of course, there may be validity for this indicator outside the 1 minute chart, but I have found such success to be very limited. Accordingly, use this indicator on SPY, TQQQ, TSLA, AMZN, and major cryptos on the 1 min chart.

AlphaScalp [Backtest, No RealTime]AlphaScalp tries to find volatility moves and profits from the small pullbacks.
Even though the performance of this script in a fair amount of cases will beat HODL it is not the purpose. AlphaScalp aims for a high accuracy and profitfactor to ensure a more or less stable profit taking.
The properties like " MA Length " and the " Short - " or " Long line % " tweaks the risk by increasing or lowering the requirements for a buy (Long or Short). Close/Exit of each order is then handled by TP, SL or volatility stop.
For high volatility assets it is recommended to use the " Sell LONG on Volatility DOWN " and " Sell SHORT on Volatility UP " to ensure a TA approach for StopLoss. Normal SL is also possible to set but is not recommended on high volatility assets since you quickly can be stopped out by wicks.
AlphaScalp works best on high volatility assets with a solid liquidity and volume - but it will also work on stocks and low volatility assets.
AlphaScalp is designed for scalping and is thereby recommended to use between 5M-1H.
This version is free for your to backtest on all assets - but be aware that alerts on RealTime bars are disabled - meaning you can add alerts but they will not trigger in real time. To ensure you have the latest backtesting results, you need to have the script added to your chart, save your chart and the refresh the page.
Enjoy and please let me know if you have any questions

Intraday FOREX london scalperThis forex System is only for ECN Broker Account.
Pairs: Major with spread < 0.0001 (EUR/USD).
Setup:
Wait for the market to make to 60 minute from the open.
If the market is near the intraday high be prepared to go short
If the market is near an intraday low for the same time period, then be prepared to go long.
Rules for entry
For sell setups: Enter on sell stop 1 pip from low of the last 15 min bar.
For buy setups: Enter in buy stop 1 pip from high of the last 15-minute bars.
Rules for exit
Take profit: Close out positions on 6 pips profit..
Stop Loss: Close out on 5 pips loss or if trade takes more than 1 minute.

Security. Scalp Adviser by Antony SavacheGreat script for quick deals. Buy and after 5 minutes sell with a target yield of 0.3%
Works on the principle of getting out of the pit. The pit is determined thanks to the rsi on the 15-minute time frame, the exit is determined by the rsi on the 1-minute timeframe. You can play with the rci values in the settings
Banknifty & Nifty50 ScalperWhy this indicator?
There are full time traders who watch their screens during live market and make good amount of money by actively managing their positions.
There are full time employees also who want to trade but can not do so because they can not monitor their active positions while they are at job.
This indicator helps you execute your trades through third party platforms by generating Buy/Sell messages in a broker-compliant format.
You just need to "Enter Your API Key” in indicator settings and the indicator will generate pop-up messages which can be captured with Google Chrome extension and passed on to your third party platform for execution.
How this indicator works?
The indicator generates trades with 03 type of formulas:
1. It calculates Zeta Force values for Bank Nifty & Nifty based upon our proprietary formula. On reaching certain threshold limits, these values trigger Buy/Sell signals.
2. It calculates 5 type of moving averages along with change in volume and deviation from mean price and when the threshold limit set is crossed, Buy/Sell signals are generated.
3. On 1 min. Time frame, it generates scalping trades when there is sudden spurt in price and volume.
Additionally, indicator also generates automatic Support/Resistance lines based upon pivot points + behaviour of price at certain levels (whether price repeatedly bounces off or sails through a certain area).
What are other features of the indicator
A label displayed at the last bar gives you following information:
(a) Value of India VIX
(b) jump in India VIX (compared to yesterday’s close)
(c) Zeta Fore value (current candle)
(d) V+ and V- which stand for number of bank nifty stocks trading above or below their respective VWAP
(e) Zeta TP, an oscillator whose value varies from -100 to +100
On what stocks or Indices it can be used?
As described above, it specifically tracks volume and price of Bank Nifty & Nifty50 (Indian indices). Hence, it is suitable for both these indices and should not be used on anything else.
Also, when this indicator formulae were back-tested using a strategy, 5 min and 15 min time frames produced best-results.
Support/Resistance lines and over-sold, over-bought indication can be used together to exit your open positions.

CRYPTOPRODear traders,
Welcome to CRYPTOPRO indicator. Only for crypto markets! This is an invite only script, please PM me to request permission for testing and access.
This indicator is developed as a scalping, intraday or swingtrade strategy.
Been working on indicators for years now, now back to trading again and made the best possible indicator for different timeframes.
The indicator uses market data, multiple timeframe ma/rsi charts and price action for determining a long or short strategy.
The indicator does not repaint!
I have made the indicator as easy as possible to use with added background colors.
How to use:
- Long strategy: when background turns to green after bar closing.
- Short strategy: when background turns to red after bar closing.
Alerts:
- Alerts are included in the indicator and are very simple to use.
- Alert "buy" for long strategy (green background)
- Alert "sell" for short strategy (red background)
- The alerts can also be used for automated trading/bot trading.
Time Frames :
- Can be used for all different timeframes.
Chart candles:
- Indicator is to be used with standard prince candles.
Note:
- Trading and financial markets are always risky and unpredictable.
- All trades made based on this indicator and his results are always your own responsibility.
- As an author i will not be held responsible for any of your trading profit or loss. Always be cautious when trading.
Charts can be applied to all TV supported crypto charts.
If you find the indicator usefull share your support and feedback in the comments.
Any questions PM me for more info.Thank you!
DISCLAIMER:
No sharing, copying, reselling, or any other forms of use are authorized for our scripts / strategy, and the information published with them.
This script / strategy is strictly for individual use.
This is not financial or investment advice. Investments are always made at your own risk and are based on your personal judgement.
NYTRADE is not responsible for any losses you may incur. Please trade wisely.

LSMA Wave RiderThe LSMA Wave Rider uses Least Squares Moving Average to make a fast oscillator ideal for scalping lower timeframe charts. Upper and lower bands contract during pullback and expand as it "booms". The perfect entry is the first crossover after bands expand. This is a great tool for entering trades.
The above image shows two examples of perfect entries:
1. The upper and lower bands contract getting tighter as it pulls back.
2. The upper and lower bands then begin to expand as it gets ready to fly.
3. The oscillator crosses over showing entry point.
* Please note that this strategy may not work during major downtrends. *
Oscillator 2 is used to detect diversions. Reduce the number to pick up shorter diversions and increase to 200 to pickup larger diversions.

ES Scalper ver.1.0The strategy is scalping around my mathematical defined S/R on m1 timeframe. The secret sauce here is the formula, other parts of the strategy is quite simple. There is a hard SL to eliminate big losses, though it's 100% win rate on ES. There is no soft SL on this script, so use it with your own risk. The strategy trades two contracts per signal and the pyramid is 2. Change it to whatever you want.
The strategy works well on 1-min ES and GBPAUD but it doesn't mean it will on other assets. Trailing points, trailing offset and timeframe are three parts that you can play with. Do notice that the performance of the backtest doesn't represent the performance of live trading. I don't charge for any price on this script, so you could just give me a DM or an Email if you want to use it.

MAC Trader V2.0 [VK]This script is based on a very simple and affective strategy. Usable for scalp, Trend, Swing, positional Trading. Works on all types of markets(Crypto, Stocks, Commodity, Forex, etc) and symbols.
About The Indicator :
The three lines(Grey upper, Red Mid, Grey Lower) moving with the price direction is Moving average channel (MAC) Which is used to determine the Market Direction. Buy/Sell signals are plotted on RSI Oversold/overbought Which is used For Entries. Small Red Line plotted below the Buy/Sell Signals is Stop loss and The Dotted lines in Green, Grey and Red are the take profit lines.
How to use :
Buy When Buy Signal, Sell When Sell Signal (Entry only After Candle Close). Use The red line below/above signals for Stop Loss. Green Red dotted lines to take profit targets, move your stops above/below as targets hits.
Functions :
Moving Average Channel (MAC) For Direction
RSI for entries
ATR for stops
Support/Resistance Lines to Take Profits
Color candles When Price Above/Below MAC
Additional Feature :
Chop Signals for Scalping/continuation/Mid Entries - This feature can be turned on in the indicator settings Which will plot B/S signals for entries.
TIP : Use MAC input 34,48 for low volatile markets (Indices, Gold , etc)
Welbis buy/sells only 15min /5 scalper trade market trend onlythis script is for scalping when you see green cross and price is above the green line you only look to buy. when you see red cross and price is under red line you only look to sell

Bitcoin (BTC) Scalp / Short-term Short IndicatorThe purpose of this scalping Indicator is to help identifying Sell signals for short term trades on Bitcoin (Spot, Features, etc.) .
This script is working with more indicators and everything is balanced by hard work on (back)testing.
Result for users is a simple signal to SELL.
You can use it as easy indicator in your graph or create alerts.
I have the best results on 1min graph, with leverage and stop-loss feature.
This is my own version of scalping Sell Script / Indicator, which is a combination of few indicators, for example RSI , BB and price levels (actual and average) and works on standard candles.
SELL signal paints above the candle and you can set your target / trailing / stop-loss in the settings and check how it works in Strategy Tester.
Settings of this Indicator:
Take Profit
Stop Loss
Trailing Stop Loss
Trailing Stop Loss Offset
Initial Capital
Base Currency
Order size
Pyramiding
Commissions
Slippage
Average price lines (colors and visibility)
Plot background
These signals can be often observed at the beginning of a strong move, but there is a significant probability that these price levels will be revisited at a later point in time again.
Therefore these are interesting levels to place limit orders.
A Sell signal is defined as the last up candle before a sequence of down candles.
In my trading settings I have more but small positions, one safety limit order (for price averaging = better entry - easier close in profit) and stop-loss.
Sometimes trailing-profit feature have very nice profits.
Settings depends on your own money-management and free capital.
Don't ignore UP / DOWN trend. For UP trend I have an Indicator too (check my profile).
In addition to the upper/lower limits of each line, also average value is marked as this is an interesting area for price interaction and better view.
PM me to obtain access, more informations or support.
NOTICE: By requesting access to this script you acknowledge that you have read and understood that this is for research purposes only and I am not responsible for any financial losses you may incur by using this script.

Bitcoin (BTC) Scalp / Short-term Long IndicatorThe purpose of this scalping Indicator is to help identifying Buy signals for short term trades on Bitcoin (Spot, Features, etc.) .
This script is working with more indicators and everything is balanced by hard work on (back)testing.
Result for users is a simple signal to BUY .
You can use it as easy indicator in your graph or create alerts.
I have the best results on 1min graph, with leverage and stop-loss feature.
This is my own version of scalping Buy Script / Indicator, which is a combination of few indicators, for example RSI, BB and price levels (actual and average) and works on standard candles .
LONG signal paints below the candle and you can set your target / trailing / stop-loss in the settings and check how it works in Strategy Tester .
Settings of this Indicator:
Take Profit
Stop Loss
Trailing Stop Loss
Trailing Stop Loss Offset
Initial Capital
Base Currency
Order size
Pyramiding
Commissions
Slippage
Average price lines (colors and visibility)
Plot background
These signals can be often observed at the beginning of a strong move, but there is a significant probability that these price levels will be revisited at a later point in time again.
Therefore these are interesting levels to place limit orders.
A Buy signal is defined as the last down candle before a sequence of up candles.
In my trading settings I have more but small positions, one safety limit order (for price averaging = better entry - easier close in profit) and stop-loss.
Sometimes trailing-profit feature have very nice profits.
Settings depends on your own money-management and free capital.
In addition to the upper/lower limits of each line, also average value is marked as this is an interesting area for price interaction and better view.
PM me to obtain access, more informations or support.
NOTICE: By requesting access to this script you acknowledge that you have read and understood that this is for research purposes only and I am not responsible for any financial losses you may incur by using this script.

BANK NIFTY | SCALP PROThis indicator is specifically designed for trading Bank Nifty (NSE) for intraday scalping
Today we live in a age of Day trading (~90% trades at the exchange are intra day trades ). This requires set of much sophisticated tools & techniques to analyze the charts.
Description :
This indicator is based on Price Action Theory, Volume Profiles and Moneyflow Analytics. It also incorporates important parameters of the underlying assets such as Banking stocks & key benchmark banking metrics. It shows the bias of the index at any given point of time.
USP: It reacts to changes in price & other critical parameters very fast identifying the best scalping opportunities
How to use ?
Timeframe : Time duration for each bar (Input to given to the indicator by user)
Notations used in the indicator:
B- Signal for Buy
S- Signal for Sell
CS- Close Shorts
CL- Close Longs
BookLong- Book all Longs
BookShort- Book all Shorts
Critical Pivot: This is the thick line which changes color green to maroon to grey. It gives an idea of bias in the market. Green color is for Bullish bias, Maroon for Bearish bias & Grey for Neutral
Swing High: The dynamic green line at the end of the charts
Swing Low : The dynamic red line at the end of the charts
Major uses of the Indicator:
1. Understanding the direction of Bank Nifty and understands levels for entry / exits --- B & S signals
2. Understanding SL levels in order to prevent loss during unforeseen events ------------- Break of the critical pivot( green/maroon line )
3. Understanding Trailing SL levels to hold on to the winners --------------------------------- Break of the Green/Red Line
Ideal Timeframes for this Indicator :
1.Scalping ( 3 min / 5 min/15 mins )
Disclaimer: This script/strategy is for educational purpose and individual use only. The author of this script/strategy will not accept any liability for loss or damage as a result of reliance on the information contained in the charts. Please be fully informed regarding the risks associated with trading the financial markets.
This is a premium indicator
If you want access to this indicator, please message me (Links/Email in description below )
