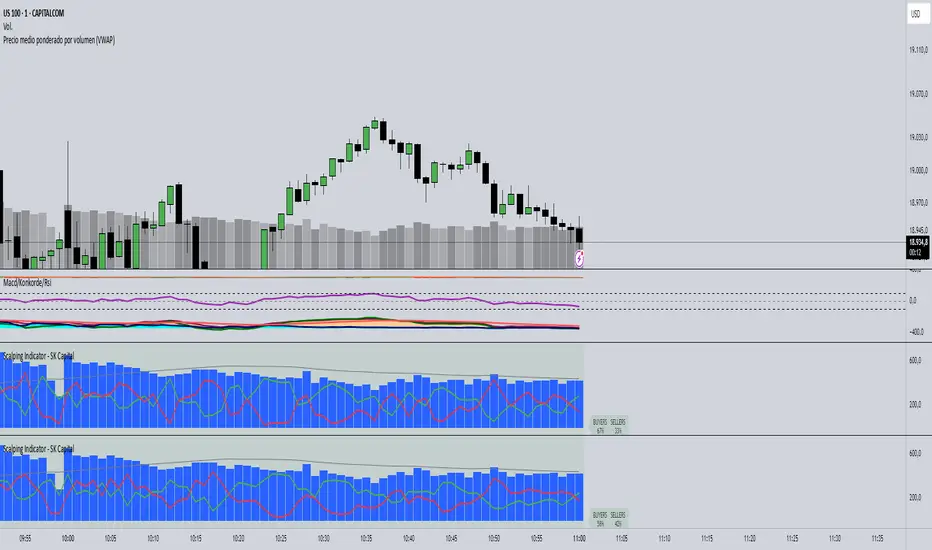
Scalping Indicator - SK CapitalThe Scalping Indicator - SK Capital is a professional-grade tool designed to empower intraday traders with real-time volume sentiment analysis and trend confirmation. Built on Pine Script v6, this indicator combines essential elements of technical trading—such as VWAP/EMA crossovers and volume decomposition—into one streamlined visualization.
Key Features:
Buyers vs. Sellers Visualization: Accurately estimates and displays the percentage of buying and selling volume within each candle. These are plotted with color-coded lines (green for buyers, red for sellers) and highlighted with a fixed summary label at the top for instant comparison.
Dynamic Sentiment Label: A prominent label at the top of the chart dynamically updates with the percentage of buyers and sellers per bar. The label’s background color shifts to green or red based on volume dominance and stays neutral when balanced, providing instant visual feedback.
Volume Histogram with Average Overlay: The total volume is represented by blue histogram bars, while a gray SMA line tracks the 50-period average volume to contextualize current activity.
Customizable Settings: Input fields allow traders to adjust the smoothing period for volume analysis, the EMA crossover length, and label font size for visual clarity.
This indicator is ideal for scalpers and short-term traders who rely on swift, data-driven decisions based on volume dynamics and trend signals. Whether you're analyzing one-minute candles or broader intraday timeframes, this script provides critical context in a compact, intuitive layout.
"scalp" için komut dosyalarını ara
Scalper's Volatility Filter [QuantraSystems]Scalpers Volatility Filter
Introduction
The 𝒮𝒸𝒶𝓁𝓅𝑒𝓇'𝓈 𝒱𝑜𝓁𝒶𝓉𝒾𝓁𝒾𝓉𝓎 𝐹𝒾𝓁𝓉𝑒𝓇 (𝒮𝒱𝐹) is a sophisticated technical indicator, designed to increase the profitability of lower timeframe trading.
Due to the inherent decrease in the signal-to-noise ratio when trading on lower timeframes, it is critical to develop analysis methods to inform traders of the optimal market periods to trade - and more importantly, when you shouldn’t trade.
The 𝒮𝒱𝐹 uses a blend of volatility and momentum measurements, to signal the dominant market condition - trending or ranging.
Legend
The 𝒮𝒱𝐹 consists of a signal line that moves above and below a central zero line, serving as the indication of market regime.
When the signal line is positioned above zero, it indicates a period of elevated volatility. These periods are more profitable for trading, as an asset will experience larger price swings, and by design, trend-following indicators will give less false signals.
Conversely, when the signal line moves below zero, a low volatility or mean-reverting market regime dominates.
This distinction is critical for traders in order to align strategies with the prevailing market behaviors - leveraging trends in volatile markets and exercising caution or implementing mean-reversion systems in periods of lower volatility.
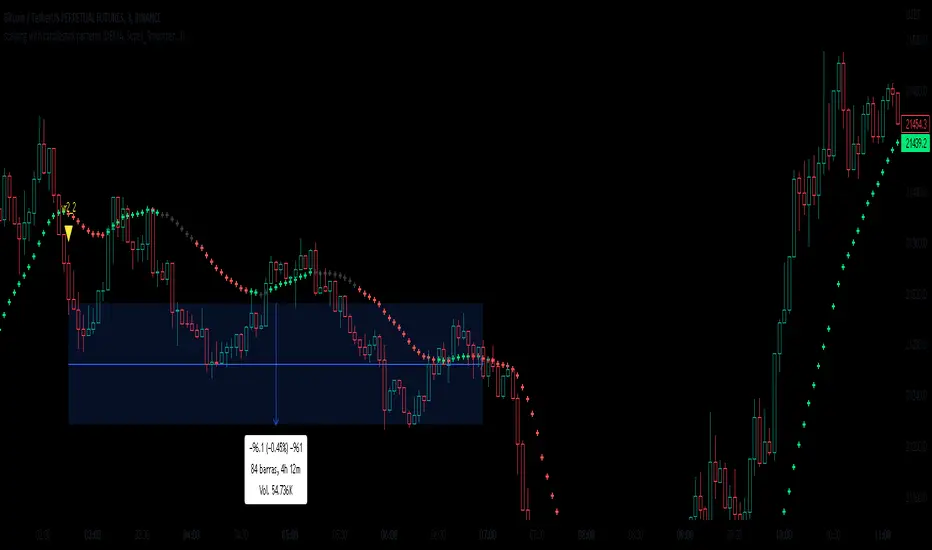
Case Study
Here we can see the indicator's unique edge in action.
Out of the four potential long entries seen on the chart - displayed via bar coloring, two would result in losses.
However, with the power of the 𝒮𝒱𝐹 a trader can effectively filter false signals by only entering momentum-trades when the signal line is above zero.
In this small sample of four trades, the 𝒮𝒱𝐹 increased the win rate from 50% to 100%
Methodology
The methodology behind the 𝒮𝒱𝐹 is based upon three components:
By calculating and contrasting two ATR’s, the immediate market momentum relative to the broader, established trend is calculated. The original method for this can be credited to the user @xinolia
A modified and smoothed ADX indicator is calculated to further assess the strength and sustainability of trends.
The ‘Linear Regression Dispersion’ measures price deviations from a fitted regression line, adding further confluence to the signals representation of market conditions.
Together, these components synthesize a robust, balanced view of market conditions, enabling traders to help align strategies with the prevailing market environment, in order to potentially increase expected value and win rates.

scalping with heikin candlestick patternsThis indicator will show you when a heikin ashi candlestick pattern forms based on volume .
It contains different candlestick patterns to be able to use it in scalping.
Each pattern has a specific name to identify it
It is recommended to use it in 1 minute charts.

scalping with candlestick patterns VJThis indicator will show you when a volume-based candlestick pattern forms.
It contains different candlestick patterns to be able to use it in scalping.
Each pattern has a specific name to identify it
It is recommended to use it in 1 minute charts.
Scalper Helper System===========================================================================
===========================================================================
Description
===========================================================================
===========================================================================
Scalper Helper System combines a series of trade strategies which have been learned and honed in the Jim of All Trades channel.
Paixy has contributed candlestick combination rules, Jonas has shared his deep understanding of Stochastic.
Jim himself has taught clearly on the merits of RSI.
This system attempts to formulate all the notes and rules I have made over the past months.
The system searches for 10 - 15 rules which are divided into bullets and bombs. Bombs relate to momentum, so these signals may not be pinpoint accurate, but they are more often leading to bigger moves.
This initial version is released mainly only to the JOAT community to help continue the development of the idea and to help find
continued improvements.
Special thanks to FiendishFeather for his strategy work, (check out his work to learn how to apply any trading strategy to his back testing harness), and the date filtering snippet and the tip to show this option at the top.
===========================================================================
===========================================================================
The strategy decisions are based on the following general rules:
===========================================================================
===========================================================================
BULLETs are hint to the idea of firing a small sized position into the market, BOMBs are hints to go all in - however this does not mean proper risk management should be forgotten.
Without risk management this and any strategy will lead to failure.
Without risk management this and any strategy will lead to failure.
Without risk management this and any strategy will lead to failure.
Without risk management this and any strategy will lead to failure.
===========================================================================
Bullet1 uses the value of the stochastic and checks for buy/sell cross over on 5m, 8m and 13m chart.
These values should be calculated on a ratio basis ideally.
Bullet2 measures divergence between the printed Stochastic signals.
Bullet3 has been decommissioned.
Bullet4 is an RSI divergence and value indicator.
Bullet5 has been decommissioned.
Bullet6 uses the history of the stochastic buy and sell signals
Bullet7 uses the Scalper Helper Trends for entries by attempting to see how the overall trend is changing. More refinement is needed here.
Bullet8 uses the Scalper Helper Trends on multiple timeframes for entries.
Bullet9 strict buy/sell signals from Stochastic RSI
Bomb1 relies on the Fast, Medium and Slow MA's being correctly lined up as well as the Stochastic, this hints at a more imminent move and so the strategy suggests a quicker entry.
Bomb2 relies on the Fast, Medium and Slow MA's NOT being correctly lined up as well as the Stochastic, and therefore has the luxury of suggesting Limit orders near the local high/low.
Bomb3 looks for two or more Stochastics signals in the same direction and then performs a divergence calculation.
Bomb4 looks a change in the Stochastics signals direction and then performs a divergence calculation.
===========================================================================
===========================================================================
Configuration settings:
===========================================================================
===========================================================================
Users can chose to show mainly buy and/or sell signals and can select a level of strictness. Enabling strict rules will force a multi timeframe comparison of Stochastic analysis.
Users can try different levels for long and short targets for profit and stop loss. This is important because the market does not behave the same going up as it does going down.
The RSI conditional check makes the strategy more selective. This discernment can be applied to bullets or bombs in order to validate entry and exits.
During the bull run and perhaps even in ranging markets, the RSI overbought levels is usually 70-80, but in the bear market we are seeing in Crypto now, a value of 60 is more useful. Try for yourself to see what works for you and feedback in the comments.
An additional indicator, Scalper Helper Trends is recommended to get a quick view on the trend condition (rally, base, down) by viewing the MACD from multiple time frames. Further research is required to know which larger timeframes work best here.
For the 15min chart, 15m, 30m, 45m, 60m, 120m, 240m, 360m, 960m would work well. Note it is not possible to go higher than 1000 at this time.
Whether you use the Scalper Helper trends or not for your own visual confirmation, it is possible to allow this indicator to attempt to read it for you. More research is required to best model the reading of this. For now, it will simply measure the gradient of the number of up versus down colors.
The system can also find entries off the Scalper Helper Trends - but really this, by design is not the best use of Scalper Helper Trends. Although you may prove me wrong so the option is given for you to find buy/sells with your own testing.
Users can chose to use some engulfing candle arrangements to trigger exits and define the length of the 200MA and decide if this should play a part in the filtering of the signals. Similarly, a check can be made to ensure that the first two candles after a signal are behaving as we would expect with the "Wait for 2 closing in the direction of the signal" option. This has a lot of value on the 1min chart.
When Revenge trade is set to true you may re-enter a trade in the same direction as the last one when the last one was stopped out, otherwise you would only be looking for trades in the other direction. We all should not revenge trade, and indeed I have only seen a few cases when it has increased the profitability, however this option remains for now.
The flip opens a new trade in the reverse direction when a signal is given to close a trade, but does not apply to scenarios where stop losses or take profit closed the trade.

ScalpingSystem 2.0 @MishuComplete scalping strategy with all related indicators.
1) Wait for an up/down-trend (10 EMA (Orange) crosses ABOVE/Below 20 EMA (Blue))
2) Wait for price to breakout then retest the EMA's (either one(based on the trend type))
3) Wait for bullish/bearish confirmation candle after the retest
4) Enter after the confirmation candle
5) Set a stop loss underneath the previous swing low (previous Zigzag point)
6) Take profit one the EMA's cross the other direction (10 EMA crosses BELOW/ABOVE 20 EMA)
Standart Strategy
with the second trend (higher TF)
zigzag included (@author=lucemanb)
if you have a number of signals you can filter the first signal
Scalping Swing Trading Tool R1-4 by JustUncleLDescription:
This study project is a "Scalping Swing trading Tool" and is an alternative to the "Scalping Pullback Tool R1". It is designed for a two pane TradingView chart layout :
the first pane set to 15min Time Frame;
the second pane set to 1min Time Frame(TF).
The tools incorporates the majority of the indicators needed to analyse and scalp Trends for Swings, PullBacks and reversals on 15min charts and 1min charts.
Incorporated within this tool are the following indicators:
1. The following EMAs are drawn automatically:
Green = EMA89 (15min TF) = EMA75 (1min TF)
Blue = EMA200 (15min TF) = EMA180 (1min TF)
Black = EMA633 (15min TF) = EMA540 (1min TF)
2. The 10EMA (default) High/Low+Close Price Action Channel (PAC), the PAC channel
display is disabled by default.
3. Optionally display Fractals and optional Fractal levels
4. Optional HH, LH, LL, HL finder.
5. Coloured coded Bar high lighting based on the PAC:
blue = bar closed above PAC
red = bar closed below PAC
gray = bar closed inside PAC
lime Line = EMA10 of bar close
6. Pivot points (disables Fractals automatically when selected) with optional labels.
7. EMA5-12 Channel is displayed by default.
8. EMA12-36 Ribbon is displayed by default
9. Optionally display EMA36 and PAC instead of EMA12-36 Ribbon.
Set up and hints:
I am unable to provide a full description here, as Pullback Trading incorporates a full trading Methodology, there are a number of articles and books written on the subject.
Set to two pane TradingView chart, set first pane to 15Min and second to 1min.
Set the chart to Heikin Ashi Candles (optional).
I also add a "Sweetspot Gold2" indicator to the chart as well to help with support and resistance finding and shows where the important "00" lines are.
Use the EMA200 on the 15min pane as the anchor. So when prices above EMA200 we only trade long (buy) and when prices below the EMA200 we only trade short (sell).
On the 15min chart draw any obvious Vertical Trend Lines (VTL), use Pivots point as a guide.
On the 15min chart what we’re looking for price to Pullback into the EMA5-12 Channel or EMA12-36 ribbon, we draw Trendlines uitilising the Pivot points or Fractals to guide your TL drawing.
On the 15min chart look for the trend to resume and break through the drawn TL. The bar color needs to change back to the trend direction colour to confirm as a break.
Now this break can be traded as a 15min trade or now look to the 1min chart.
On the 1min chart draw any Pullback into any of the EMAs.
On the 1min chart look for the trend to resume and break through the drawn TL. The bar color needs to change back to the trend direction colour to confirm as a break.
Now this break can be traded as a 1min trade.
There is also an option to select Pristine (ie Ideal) filtered Fractals, which look like tents or V shape 5-candle patterns. These are actually used to calculate the Pivot points as well.
Other than the "SweetSpot Gold2" indicator, you should not need any other indicator to successfully trade trends for Pullbacks and reversals. If you really want another indicator use the AO (Awesome Oscillator) as it is momentum based.

Scalp EA for 15 Minute Timeframes and HigherSo I have written this indicator based upon the percentages of the High and the Low of the candlestick with respect to the open price. This indicator by no means tries to find top's and bottom's;however, it does find good opportunities for 5-20 pips reversals or continuations. The signal is provided without delay and should only be based upon the closing of the candle. For example, at open- the indicator will tell you "buy, sell, or remain flat" but you should only buy or sell when the candle has completely closed.
Choose whether to use it for scalps, or to set up larger trades with bigger time frames and support or resistance zones.
*Warning*- This is untested and will remain untested due my unavailability.
Reason behind the coding: As I trader, I like to think that I am always "buying low and selling high"or "selling high and buying low". Throughout my trading experiences, I can tell you that I have done the opposite many times. This indicator helps me in finding opportunities as I have written it to always Sell at the closing price of a green candle and always to buy at the close of a red candle. The indicator makes the attempt to Sell High and Buy Low.

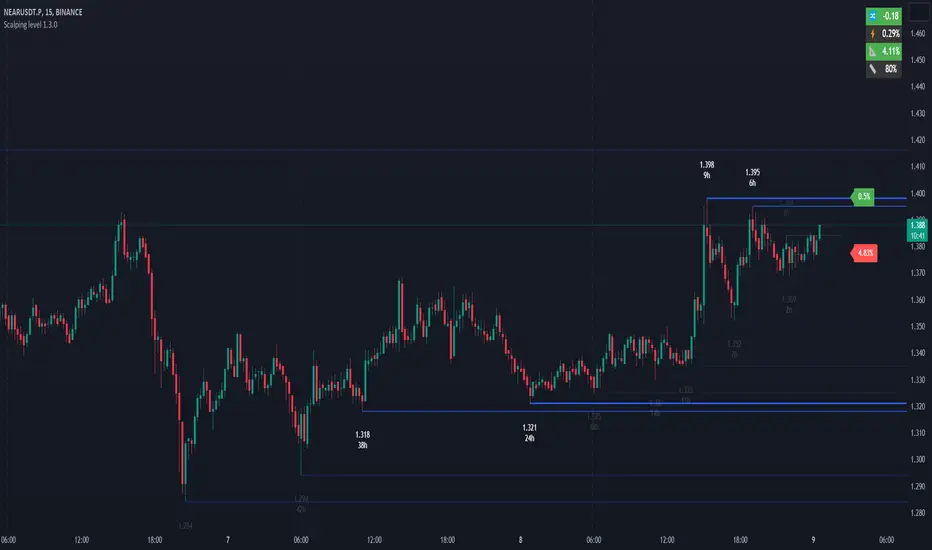
Scalping level 1.3.0The indicator shows the horizontal levels behind which the liquidity accumulates. The indicator is based on the price extremums according to the specified settings. Each extremum is marked with a faint blue line and the price. If two or more extrema are located at the same price or close enough to each other, they are highlighted in bright blue, and it indicates a strong resistance or support level. When prices approach strong resistance levels, we can consider the situation on a long breakout or a bounce from the level in the short. As price approaches strong support levels, we could consider a breakout in the short or a bounce from the level in the long. Each level has a time (indicated at each price extremum), when it was formed in hours, the more hours ago the level was formed, the stronger it is and the more likely is the price reaction at this level.
The marks next to the price show the distance in percent to the nearest strong levels, it gives a reference point for how soon the price will approach these levels.
Additional indicators, located at the top right of the chart help to make decisions in trading.
Daily dollar volume - shows how interesting the instrument to the market participants, if the traded volume for 24 hours is low, then it is not worth to pay attention to this tool.
Bitcoin correlation - (used for the cryptocurrency market), if the coin price follows the bitcoin (the indicator value is close to 1), then you should exclude this coin, because the price is controlled by robot correlators, not market participants.
Natr - the average volatility of a 5-minute candle in %. The low value of volatility can indicate that the instrument is not active at the moment. Also it is possible to use this value as a stoploss in scalper deals.
Price change - price change for the current session in %, if the value is more than 10% (for cryptocurrencies), then the breakdown of resistance levels have a higher probability than a bounce, if the value is less than -10%, then the probability of breaking support levels have a higher than a bounce.
Percentage of average daily ATR - shows how much the price passed in % for the current session from the average daily ATR. If price passed about 100%, it is possible to consider the price reversal from resistance or support levels.
Important! When trading on levels it is necessary to consider the situation in the Depth of Market. Pay attention to large densities located near support and resistance levels.
=== Basic settings: ===
LOCAL LEVEL, MIDDLE LEVEL, GLOBAL LEVEL . Three ranges of levels (local, middle, global). For each range, you can configure the period and lifetime of the level. For example, global levels are the strongest, they have the longest period and the longest time of existence (note: 0 for Lifetime means infinite time of existence), while local levels have the shortest period and the shortest time of existence. Period - the period in which the level is built. Lifetime - time after which the level is removed from the chart. Color and width - color and width of the line.
BREAK LEVELS . Levels broken by the price. These levels are displayed for convenient tracking of previous breakouts. Parameters are set similarly to other levels.
IMPORTANT LEVELS . Important levels show behind which price range the greatest accumulation of liquidity. Important levels can be adjusted by setting the minimum number of adjacent levels, for example 2 or more, as well as the maximum distance between adjacent levels. Thus, important levels show the accumulation of price extremums, behind which there are Stop Losses of the participants.
Near level coefficient - the distance coefficient between adjacent levels, the higher the coefficient is, the greater is the acceptable price range between the levels. The coefficient is multiplied by the average ATR, as a result we get the price range. For example, if we specify 0, then strong levels will be detected only if 2 or more extrema have the same price.
Minimum near levels - the minimum number of adjacent (close to each other) levels. For example, if 2 is specified, then if 2 or more levels are situated near each other at a distance not exceeding the distance, specified in the Near level coefficient, then those levels will be displayed in bright blue color.
Week level transparent - transparency of "weak" levels located at the price extremums.
COMMON.
Max distance to level - the maximum distance of levels is set by a coefficient, it is necessary to display only the closest levels to hide the levels that are formed very far from the current price. It is calculated on the basis of ATR.
Show level time - shows level existence time.
PRICE. Visual settings of price levels on the chart
Size - print size of price on the chart
Color - color of price on the chart
Round price color - color of the round price number. The round number is the price with the last two digits 0. Example 28124.00 or 0.2500
INDICATORS. Auxiliary numeric indicators (located in the upper right corner of the chart):
Daily dollar volume , the traded volume for the last 24 hours in dollars. You can specify a volume threshold in millions of dollars, above which the value will be highlighted in green. The default value is 100 million dollars. A high value of traded volume indicates a large number of participants and increases the probability of volatility of the instrument.
Bitcoin correlation , an indicator of price correlation with bitcoin, the lower the indicator, the instrument is more independent, the closer to 1, the stronger the instrument repeats bitcoin price movements. It has a threshold value of 0.5 by default. If the indicator reading is below the threshold, it is highlighted in color.
Natr , shows the average range at which the price passes in 5 min. The higher the indicator, the higher the volatility of the instrument.
Price change , price change in % for the current session.
Percentage of average daily ATR , shows how much the price passed in % for the current session from the average daily ATR.
Scalper v1A trend following strategy which uses regression to estimate buying and selling, the regression is done using oscillators and filters. This strategy can be used to scalp if you can wait till the candle is fully painted and you have a good sense of market.
Trade at your own risk no one can guarantee a 100% strike rate!

Scalper Alerts
Use in conjuction with the Scalper .
Configure both with the same properties to verify.


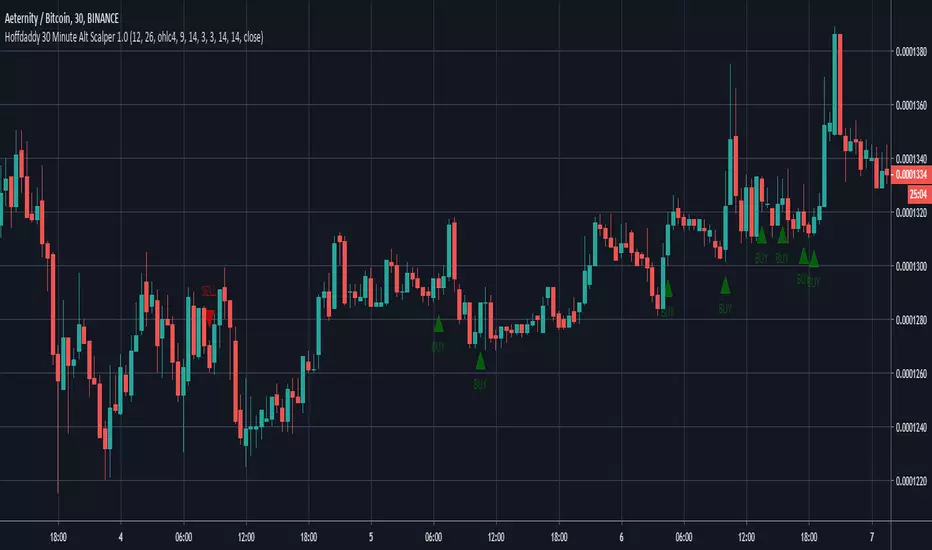
Hoffdaddy 30 Minute Alt Scalper 1.0Scalping indicator for bot trading on altcoins vs BTC. Works best on 30 minutes with minimal DCA, tight stop loss, and 1-2% take profit. No repaint, use candle close on alerts to avoid ghost signals.
PM for temporary access.
As always, I welcome feedback.
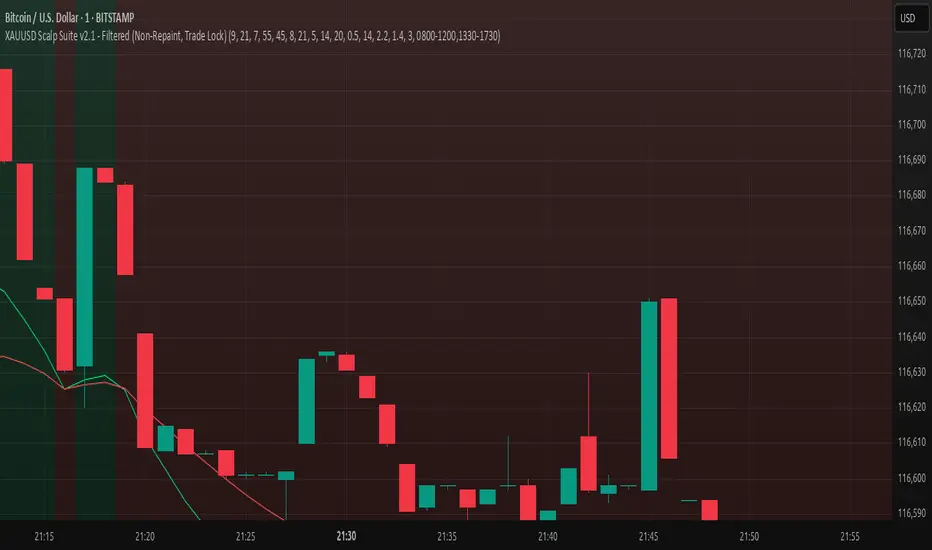
Scalp Suite v1 – Non-Repaint BUY/SELL with TP/SL & Trade LockA complete scalping tool designed for 1m–5m charts on FX pairs, Gold (XAUUSD), and indices.
Features:
• Non-repaint BUY/SELL signals based on EMA trend, RSI, and optional MACD filter
• ATR-based dynamic SL, TP1, TP2
• Automatic trade lock – no new signals until current trade closes
• Break-even move after TP1 hit (optional)
• Session filter to trade only during the most active market hours
• Customizable visuals: entry, SL, TP lines and trade labels
• Alerts for BUY and SELL signals
Best used with:
• Low-spread brokers
• Active market sessions (e.g., London + NY overlap)
• Strict risk management (0.5–1% per trade)
⚠ For educational purposes only. Not financial advice.
Scalp Pump-Dump Detector with AlertsThis script displays the percentage of movement of all candles on the chart, as well as identifying abnormal movements to which you can attach alerts. An abnormal movement is considered a rise or fall that exceeds the parameter set in the settings (by default, 1% per 1 bar).
Added a function to display the volume on abnormal candlesticks.

Scalp Tool
This script is primarily intended as a scalping tool.
The theory of the tool is based on the fact that the price always returns to its mean.
Elements used:
1. VWMA as a moving average. VWMA is calculated once based on source close and once based on source open.
2. the bands are not calculated like the Bollinger Band, but only a settlement is calculated for the lower bands based on the Lows and for the upper bands based on the Highs. Thus the bands do not become thicker or thinner, but remain in the same measure to the mean value above or below the price.
3. a volume filter on simple calculation of a MA with deviation. Therefore, it can be identified if a volume breakout has occurred.
4. support and resistance zones which are calculated based on the highs and lows over a certain length.
5. RSI to determine oversold and overbought zones. It also tries to capture the momentum by using a moving average (variable selectable) to filter the signals. The theory is that in an uptrend the RSI does not go below 50 and in a downtrend it does not go above 50.
However, this can be very different depending on the financial instrument.
Explanation of the signals:
The main signal in this indicator Serves for pure short-term trading and is generated purely on the basis of the bands and the RSI.
Only the first bands are taken into account.
Buy signal is generated when the price opens below the lower band 1 and closes above the lower band 1 or the RSI crosses a value of 25 from bottom to top.
Sell signal is generated when the price opens above the Upper Band 1 and closes below the Upper Band 1 or the RSI crosses a value of 75 from top to bottom.
The position should be closed when the price hits the opposite band. Alternatively, it can also be closed at the mean.
Other side signals:
1. breakouts:
The indicator includes 2 support and resistance zones, which differ only in length. For the breakout signals, the short version of the R/S is used. A signal is generated when the price breaks through the zones with increased volume. It is then assumed that the price will continue to follow the breakout.
The values of the S/R are adjustable and marked with "BK".
The value under Threshold 2 defines the volume breakout. 4 is considered as the highest value. The smaller the value, the smaller the volume must be during a breakout.
2. bounce
If the price hits a S/R (here the long variant is used with the designation "Support" or "Resistance") and makes a wick with small volume, the script assumes a bounce and generates a Sell or Buy signal accordingly.
The volume can be defined under "Threshold".
The S/R according to the designation as well.
Combined signals:
If the value of the S/R BK and the S/R is the same and the bounce logic of the S/R BK applies and an RSI signal is also generated, a signal is also plotted.
Here the idea was to get very strong signals for possible swing entries.
4. RSI Signals
The script contains two RSI.
RSI 1:
Bullish signal is generated when the set value is crossed from the bottom to the top.
Bearish signal is generated when the set value is crossed from the top to the bottom.
RSI 2:
Bullish signal is generated when the set value is crossed from the top to the bottom.
Bearish signal is generated when the set value is crossed from bottom to top.
For RSI 2 the theory is taken into account according to the description under Used elements point 5
Optical trend filter:
Also an optical trend filter was generated which fills the bands accordingly.
For this the VWMA is used and the two average values of the band.
Color definition:
Gray = Neutral
Red = Bearish
Green = Bullish
If the mean value is above the VWMA and the mean value based on the closing price is above the mean value based on the open price, the band is colored green. It is a bullish trend
If the mean value is below the VWMA and the mean value based on the closing price is below the mean value based on the open price, the band is colored red.
The band is colored gray if the mean value is correspondingly opposite. A sideways phase is assumed.
The script was developed on the basis of the pair BTCUSD in the 15 minute chart and the settings were defined accordingly on it. The display of S/R for forex pairs does not work correctly and should be hidden. The logic works anyway.
When using the script, all options should first be set accordingly to the asset and tested before trading afterwards. It applies of course also here that there is no 100% guarantee.
Also, a strong breakout leads to false signals and overheating of the indicator.

Scalping Trading System ALERT Crypto and StocksThis is the alert version of the strategy with the same name.
Indicators
SImple Moving Average
Exponential Moving Average
Keltner Channels
MACD Histogram
Stochastics
Rules for entry
long= Close of the candle bigger than both moving averages and close of the candle is between the top and bot levels from Keltner . At the same time the macd histogram is negative and stochastic is below 50.
short= Close of the candle smaller than both moving averages and close of the candle is between the top and bot levels from Keltner . At the same time the macd histogram is positive and stochastic is above 50.
Rules for exit
We exit when we meet an opposite reverse order.
This strategy has no risk management inside, so use it with caution !

OMEN-SCALPING-TRENDScalp the market using low time frames and high leverage. Works well between 1m-10m charts.
Allow the candle to close before entering the position.
Set alert to "ONCE PER BAR CLOSED"

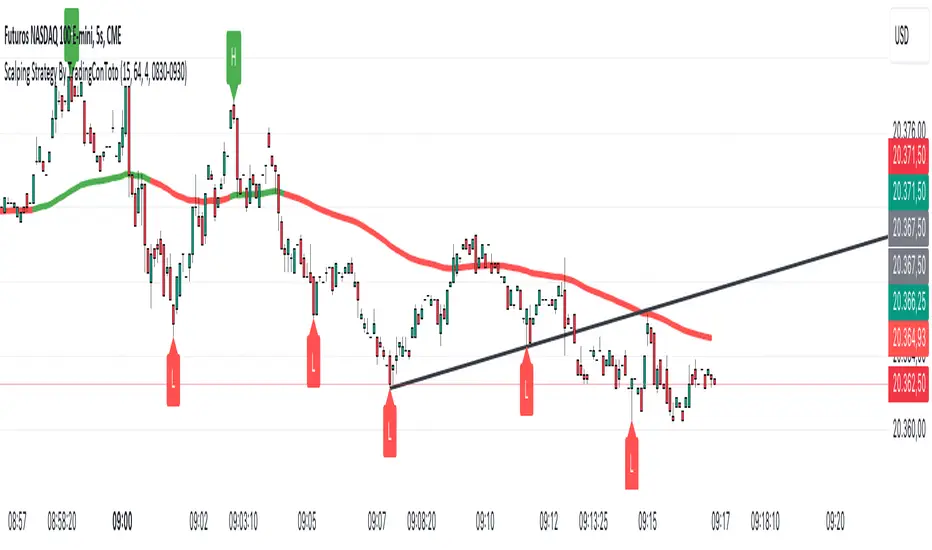
Scalping Strategy By TradingConTotoScript Description: "Scalping Strategy By TradingConToto"
This scalping strategy is designed to trade in volatile markets, taking advantage of rapid price movements. It uses pivots to identify key entry and exit points, along with exponential moving averages (EMAs) to determine the overall trend.
Key Features:
Dynamic Pivots: Calculates pivot highs and lows to identify support and resistance zones, improving entry accuracy.
Market Trend Analysis: Utilizes a 100-period EMA for long-term trend analysis and a 25-period EMA for short-term trends, facilitating informed decision-making.
Automated Entry and Exit: Generates buy and sell signals based on EMA crossovers and specific market conditions, ensuring you don't miss opportunities.
Risk Management: Allows you to set take profit and stop loss levels tailored to market volatility, using the ATR for effective risk management.
User-Friendly Interface: Easily customize strategy parameters such as pivot range, stop loss and take profit pips, and spread.
Requirements:
Ideal for use on short time frames during high activity sessions, like the configured scalping session.
Activate buy and sell options according to your preference and analyze performance using TradingView’s tools.
Note:
This script is a tool and does not guarantee results. It is recommended to test in a simulated environment before applying it to real accounts.
Optimize your scalping operations and enhance your market performance with this effective strategy!
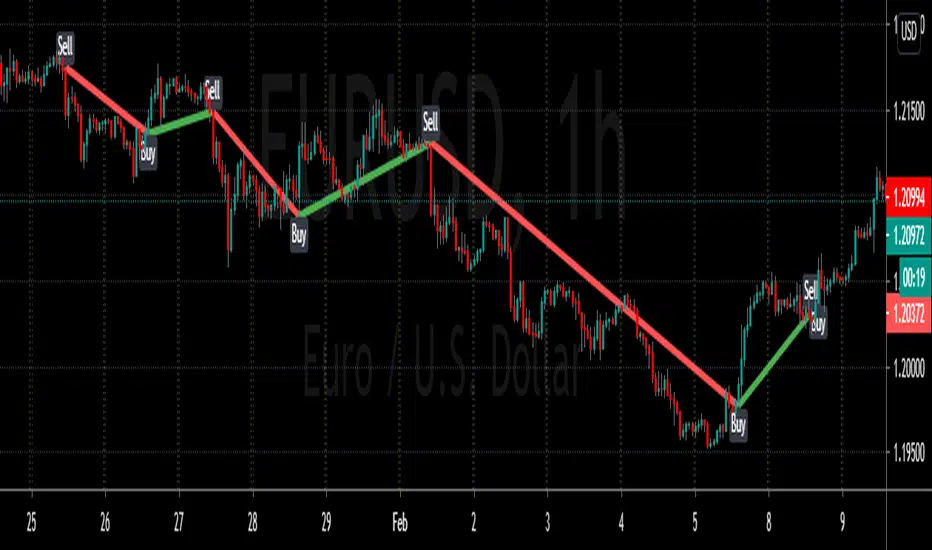
Scalper ALThe script is an updated version of our old Scalper 1.1. It includes a linear regression line for trend indication, a moving average line and the buy sell labels. The fluctuation and strength of the trend can be discerned from Pearson's value and its sign. Algorithmic trading can be done by setting an alarm. There is a provision to set target and stop loss in setting window(for algo trading). It's more profitable on the 15 minute chart, and applies to any type of stock.The color of the moving average represents the short term trend.
Contact us using the links below to gain access to this indicator
