HMA Breakout Buy/Sell indicator for Scalping & Intraday - ShyamHi All,
This is a very simple indicator which provides the buy signal, when the moving average lines turns Green and sell signal, when the moving average signal turns red. This can be used for both intraday and scalping method with different timeframes. But best time frame is 5 minutes.
Buy Signal >>> Line turns GREEN (Use trailing SL to cover maximum profit)
Sell Signal >>> Line turns RED (Use trailing SL to cover maximum profit)
No trade >>> Line turns GRAY
Best timeframe >>> 5 minutes
Thanks,
Shyam
"scalp" için komut dosyalarını ara

Price change scalping short and long strategy indicatorPrice change scalping Short and Long indicator uses a rate of change momentum oscillator to calculate the percent change in price between a period of time. Rate of change calculation takes the current price and compares it to a price of "n" periods while the period of time can be defined by a user. The calculated rate of change value is then compared to the upper threshold and the lower threshold values to determine if a position should be opened. If the threshold is crossed and filtering conditions are met a strategy position will be triggered. Entry, take profit, and stop loss prices are calculated and displayed on the chart as well as positions directions. Once the entry price is crossed, a long or short position is created and once the take profit price is crossed, the stop loss price will begin to trail behind the price action using the close of the previous bar. Once the trailing stop price is crossed, the position is closed. If the entry price is not crossed and the price action crosses the stop level, the trade setup is cancelled. The indicator is enhanced by DCA algorithm which allows to average entry price with safety orders. The script also allows to use Martingale coefficient to increase averaging power
Advantages of this script:
The indicator has custom alert settings for each strategy action
The indicator can be used with 3Commas, Cryptohopper, Alertatron or Zignaly bots
High frequency and low duration of trades
Can be used with short-term timeframes ranging from 5 to 60 minutes
Indicator is sustainable to market slumps due to DCA implementation
Can be used for short and long positions (can be adjusted to long only, short only or both)
Can be applied to any market and quote currency
Easy to configure user interface settings
Built in detailed statistic menu
How to use?
1. Apply the indicator to a trading pair your are interested in using 5 to 60 minutes timeframe chart
2. Configure the indicator: change layer values, order size multiple and take profit/stop loss values according to current market cycle stage
3. Set up a TradingView custom alert using the indicator settings to trigger on a condition you are interested in
4. indicator will send alerts when to enter and when to exit positions which can be applied to your portfolio using external trading platforms
5. Update settings once market conditions are changed using backtests on a monthly period
Price change scalping short and long strategyPrice change scalping Short and Long strategy uses a rate of change momentum oscillator to calculate the percent change in price between a period of time. Rate of change calculation takes the current price and compares it to a price of "n" periods while the period of time can be defined by a user. The calculated rate of change value is then compared to the upper threshold and the lower threshold values to determine if a position should be opened. If the threshold is crossed and filtering conditions are met a strategy position will be triggered. Entry, take profit, and stop loss prices are calculated and displayed on the chart as well as positions directions. Once the entry price is crossed, a long or short position is created and once the take profit price is crossed, the stop loss price will begin to trail behind the price action using the close of the previous bar. Once the trailing stop price is crossed, the position is closed. If the entry price is not crossed and the price action crosses the stop level, the trade setup is cancelled. The strategy is enhanced by DCA algorithm which allows to average entry price with safety orders. The script also allows to use Martingale coefficient to increase averaging power
Advantages of this script:
Strategy has high net profit of 293% at backtests
Backtests show high accuracy around 71%
High frequency and low duration of trades
Can be used with short-term timeframes ranging from 5 to 60 minutes
Strategy is sustainable to market slumps due to DCA implementation
Can be used for short and long positions (can be adjusted to long only, short only or both)
Can be applied to any market and quote currency
Easy to configure user interface settings
Built in detailed statistic menu
How to use?
1. Apply the strategy to a trading pair your are interested in using 5 to 60 minutes timeframe chart
2. Configure the strategy: change layer values, order size multiple and take profit/stop loss values according to current market cycle stage
3. Set up a TradingView alert to trigger when strategy conditions are met
4. Strategy will send alerts when to enter and when to exit positions which can be applied to your portfolio using external trading platforms
5. Update settings once market conditions are changed using backtests on a monthly period

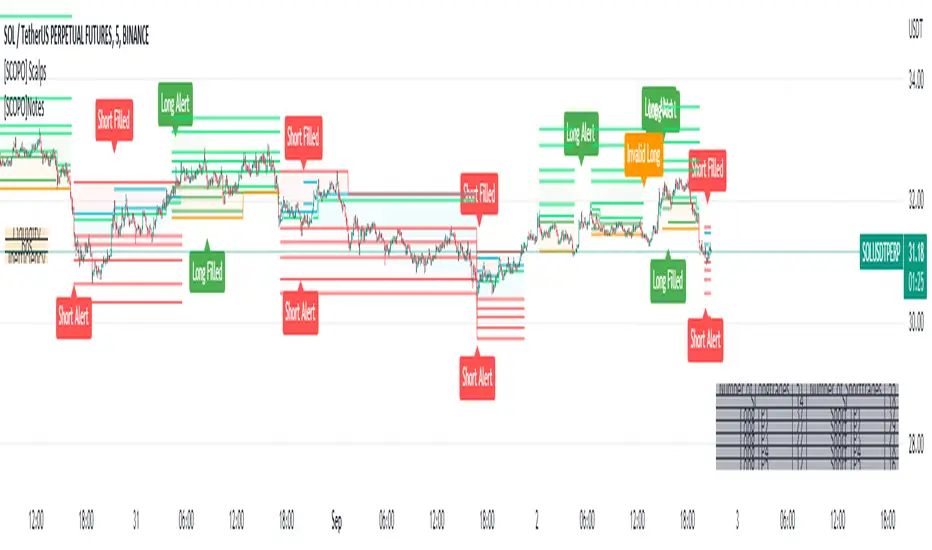
[SCOPO]Scalping BotEnglish, German is found Below
Scalping Indicator (5min Mostly)
- An Indicator that Creates Possible Trades, created on MA's, Volumebased Support and Ressistance and MACD, The Take Profits are created by a Simple Support and Ressitance Indicator (Built In)
- The Indicator sends with the Alert Function Buy and Sell Signals
- These Signals exists from 3 Entrys, 5 Take Profits and 1 Additional Take Profit who should be used after Entry 2/3 has been filled
- If a Signal gets Invalid or an Entry has been filled ,there comes a new Alert
- The Indicator Plots Lines on the Chart for TP/SL and has an Integrated Backtester table
If you got Questions pls Contact me via PM!
Update Rolled out Today (2.9.2022)
- Its now possible to set your own choosen minimal TP, before was 0.3 % and the next Ressistance above would have been taken for longs
- FilterMA can now be choosen from Different MA's via Dropdown menu
- Length of FilterMA can now be set by user
- Those Changes have been done to make it usefull for higher Timeframes too
German
Scalping Indikator
- Kurzbeschreibung: Ein Indikator der mit EMA & Macd und Volumenbasierten Supports/Ressistance Long - & Shorttrades vorschlägt
- Der Indikator sendet mit der Alarm Funktion Kauf und Verkaufsignale
Diese Signale bestehen aus 3 Entrys, 5 Take Profits sowie 1 Additional Take Profit der Aktiv wird nachdem der Entry 2 / 3 gefüllt wurde
Sollte ein Signal Invalidiert werden dann kommt ein erneuter Alarm
Sollte der 1.Entry gefüllt werden dann kommt auch ein Alarm
- Der Indikator gibt visuell auf dem Chart Linien für TP/SL wieder und besitzt auch ein Integriertes Info Fenster für ehemalige Trades.
- Die TP's werden durch eine eingebaute Support/Ressistance Funktion ausgewählt.
Alle verbesserungsvorschläge bitte per PN an @ridicolous
Update vom 2.9.2022
- Es wurde die möglichkeit mindest TP's zu setzen hinzugefügt
- Die FilterEMA kann nun aus einer Auswahl verschiedener MA's ausgewählt werden
- FilterMA längen können nun angepasstwerden
- Diese Aenderungen wurden hinzugefügt um das Skript auch auf höheren Timeframes laufen lassen zu können
Easy Scalping by JayKasunBINANCE:BTCUSDTPERP
This indicator can show stochastic RSI K and D line crosses and some candlestick patterns on chart.
You can use this indicator to scalping, check usage for more info. Always backtest before trading with your real money.
This indicator will also help mobile TradingView users to get an idea when getting stochastic RSI signals, they can use this indicator to check if stochastic RSI K and D crossed or not. ( Because they have limited area to view chart ) .
4 Exponential moving averages are there in the indicator with easy enable disable option. 9 , 21 , 55 , 100 is suggested as default values.
Meanings of signs in chart
Blue triangle bellow candle means it's a stochastic RSI K and D line cross in oversold level
Red triangle above candle means it's a stochastic RSI K and D line cross in overbought level
Green plus sign shows when EMA 50 crossover EMA 100
Red plus sign shows when EMA 50 cross bellow EMA 100
Features
You can enable candlestick pattern displaying when stochastic RSI K and D cross happen. Check indicator settings.
You can enable displaying ATR Trailing Stops in indicator settings.
Indicator will only show blue triangle after Green plus sign and Red triangles after Red plus sign
After you enable candlestick pattern option, stochastic RSI crosses with candlestick patterns will show in deferent colors. Blue triangle will turn into green and Red triangle into pink.
Usage
Use lower time frames like 5m or 15m
After green plus sign, if price retouched 21 EMA or 55 EMA and blue triangle appeared , you can enter a long position.
After red plus sign, if price retouched 21 EMA or 55 EMA and red triangle appeared , you can enter a short position.
Always wait for candle close . signs of chart can be changed when candle closing. ( Does repaint until candle close )
Use ATR trailing to get a stop loss price.
Use 1:1 or 1:0.5 Risk Reward ratio. Because it's scalping and lower time frame.
Use more indicators like RSI to get more confirmations ( like divergences ) before entering a trade. Its more reliable.
Candlestick Patterns Short names
H - Hammer
IH -Inverted Hammer
BE - Bullish Engulfing ( green triangle )
BE - Bearish Engulfing ( pink triangle )
BH - Bullish Harami ( green triangle )
BH - Bearish Harami ( pink triangle )
I have included ATR + Trailing Stops by SimpleCryptoLife and Candlestick Patterns Identified (updated 3/11/15) by repo32
this is a combination of multiple indicators
credit goes to original creators of above indicators

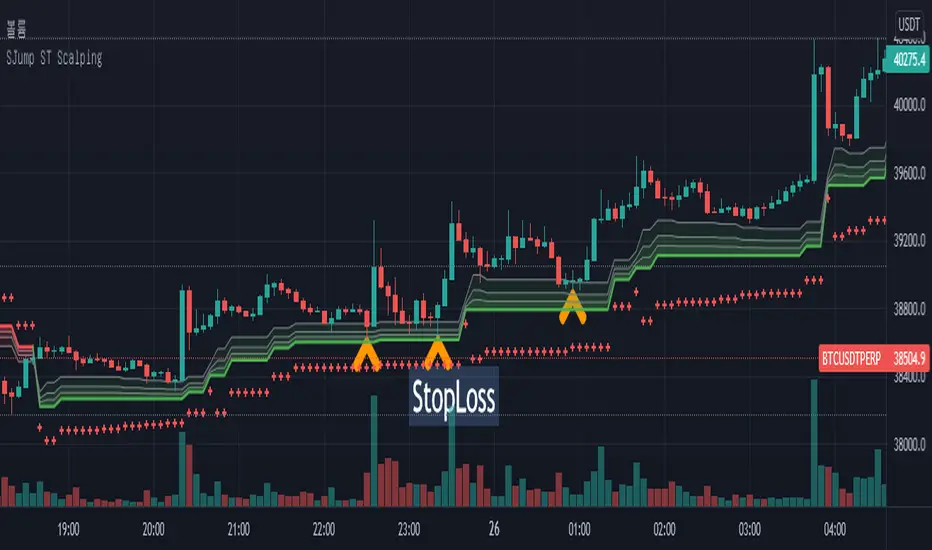
SuperJump HTF SuperTrend for ScalpingThis script can help you perform scalping using SuperTrend
First, set the HTF value higher than your current time frame.
As you know, the accuracy of the supertrend is very poor on the lower timeframe.
So I used higher timeframe(15 mins) supertrend more than current chart(5 mins)
TICK Scalping strategy, SPY 1 min1 min chart scalping version of my other TICK strategy with adjusted parameters and additional entry and exit conditions better suited for 1 min SPY chart. Please refer to my original TICK strategy for explanation.
Important notes:
1. This strategy is designed for same day SPY option scalping on the 1 min chart . All profit shown in back testing report is based on Profit/Loss (P/L) estimates from trading options with approximately 6 weeks of data. By default, it is set to 10 option contracts. By default the initial capital is set to $5000. Pyramiding is set to 3.
2. This strategy works better with non-extended market data .
3. This strategy is mainly developed for SPY trading on 1 min chart, it probably will not be very profitable with other tickers or time frame without tweaking all the parameters first.
Cheers and enjoy~! Let's all make money~!!

crypto futures hourly scalping with ma & rsi - ogcheckershi to all lovable traders,
hereby i want to share a combination of trade ideas for scalping
i've chosen hourly timeframe
indicators used: moving averages and rsi
moving averages:
ema 3, ema 5, ema 7
sma 3, sma 5, sma 7
daily_ema_3, daily_ema_5
daily_ema_5, daily_sma_5
rsi:
rsi 7, rsi 14, rsi 26
daily_rsi_7, daily_rsi_14, daily_rsi_26
as per the analysis over moving average behavioral patterns & rsi movements, useful points are given below which will be helpful while choosing good entry points & exit points,
strategical points for LONG:
* when ema3 crosses above sma3 - green candles start to form
* it's followed by ema5 > sma5 and ema7 > sma7
* when ema3 crosses down sma3 - it's considered as an indication of exit
* if rsi supports then can wait for ema5 crossing down sma5
* as similar, when daily_ema_3 crosses above daily_sma_3, its an higher timeframe bullish indication, so the lower timeframe entries inside this higher timeframe is a sure shot confident entry
* for LONG always take entries when rsi_14 < 30 or 25 else check rsi_7 < 25 or below
* as along the above, bullish CANDLE patterns like bullish engulfing , morning star is been used for entry at lower levels
* so here i've used OPEN as rsi_source in majority
* exit points also indicated at high_rsi and moving average crossunders or reverse crossovers
* for SHORTING, the above said ideas can be used in viceversa
* inputs in the indicator were tailored for users needs so that you will enjoy the magics of customization
if i am wrong in anyways regarding the above indicator strategy, please forgive me and help me improve in this aspect by commenting.
after few more studies and analysis and mainly QUERIES & COMMENTS, i'm planning to backtest these strategies here in tradingview.
also if these strategies are coded in python, we can link it to Binance Futures Algo or Bot Trading.
thankyou for this opportunity,
thanks to tradingview and pinecoders
thanks to Pranab (for 365MA)
thanks to Gandalf (for inspiring)
Special Thanks & Love to Chartbank for Everything

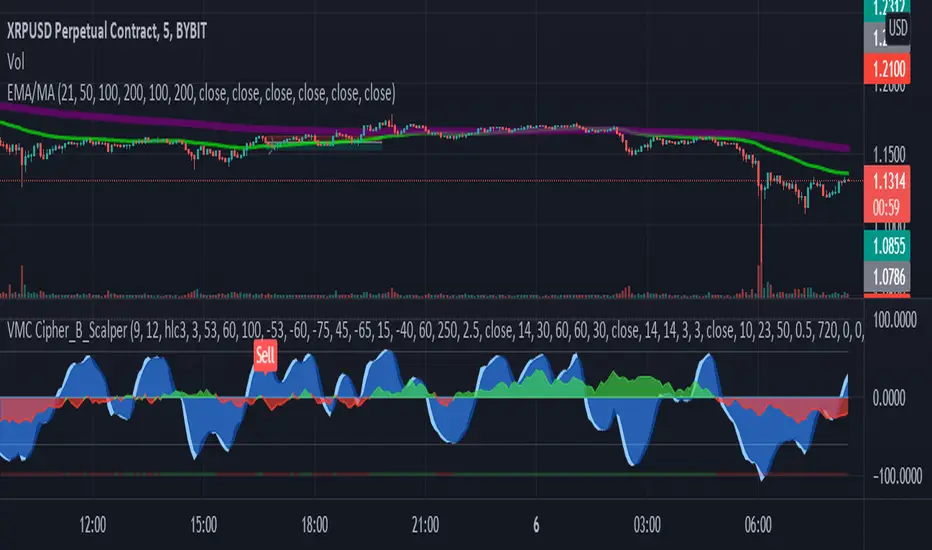
LA_Crpyto_Pirate Modifie VuManChu B Script with Scalping FiltersI added the following filters for entry signals to the VuManChu B with divergences for use as a scalping indicator. You will need to load the 50 EMA and this indicator to trade this per the rules below
The rules for trading this are as follows; You can only take a long or short entry when all of these requirements match
The wave cross is under the zero line (long) or over the zero line (short)
The money flow indicator is green (long) or red (short)
The closing price is above the 200 EMA (long) or below the 200 EMA (short)
price has pulled back to the 50 EMA
Here are the filters I employed in the script to help you trade this
Zero Line Filter: Only signal longs under the zero line and shorts over the zero line will fire off a signal
Money Flow Indicator Filter: Only signal longs when money flow is green and only shorts when money flow is red
200 MA filter: Only longs when price is closing above the 200 EMA and only shorts when price is closing below the 200 EMA
When you get an alert, simply check to see that price has pulled back to the 50 EMA before entering. Place long and short orders when the indicator signals and you confirm price has pulled back to the 50 ema before entering the long or short. Set your Stop Loss above or below the pervious pullback and set a reward ratio of your choice. Good luck!
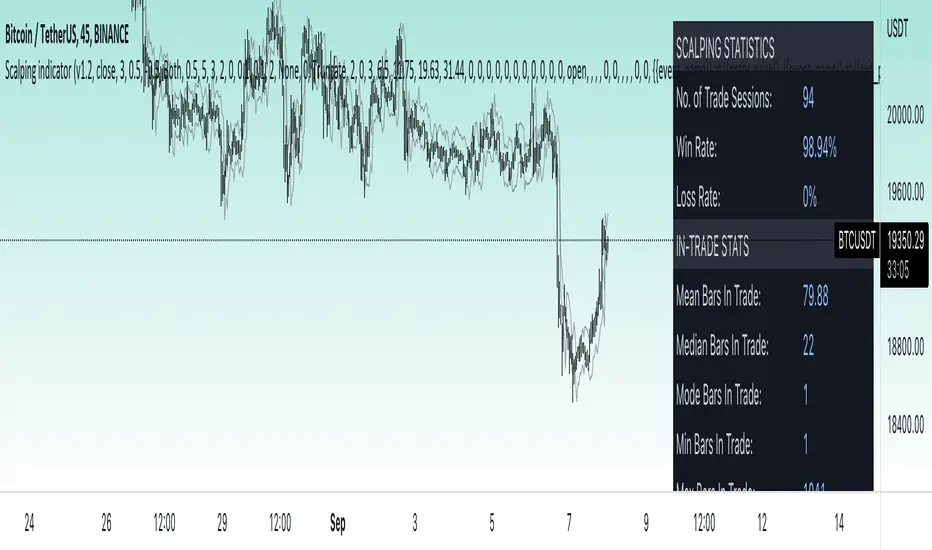
Price Change Scalping Indicator v1.0Introduction
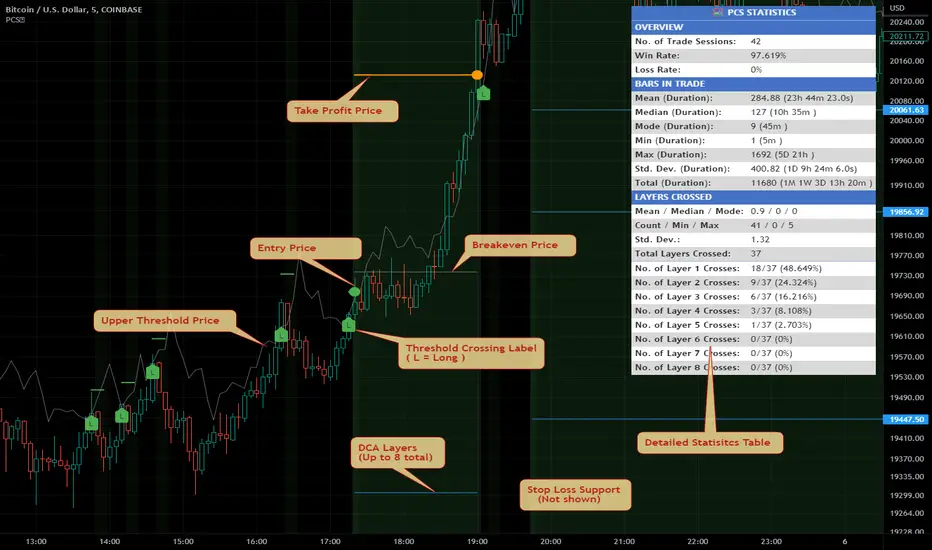
This indicator uses a price rate of change (ROC) momentum calculation to determine the percent change in price between a defined range of bars. The calculated ROC value is then compared to the Upper Threshold and Lower Threshold values to determine if a trade setup is to be activated. If the threshold is crossed, a trade setup will occur based on the indicator settings. Entry, Take Profit, and Stop Loss prices are calculated and displayed on the chart. Once the Entry Price is crossed, a long or short position is created (depending on the direction) and once the Take Profit price is crossed, the position is closed. If the Entry Price is not crossed within a specific number of bars, the trade setup is canceled, and it will proceed to monitor price changes for the next set up.
How is it original and useful?
This indicator is unique in that the strategy version fully supports the TradingView backtester, which will enable you to perform experiments with various settings to evaluate performance using the historical chart data. The study version implements numerous custom alerts for you to build TradingView notifications around specific price action events and stay informed with market activity in real-time. Both script versions will provide the same configuration abilities where you can define:
Define a short or long trading strategy.
Price change data source and offset settings.
Your layering placement relative to the entry price.
Your trading parameters like take profit and stop loss offsets, exchange commission rates, trading start time, and order size multiplication for each layer.
Flexible trade eligibility rules that can use other chart indicators, like RSI or EMA, to exclude the selection of entry prices for trading.
The visibility of detailed statistics from the chart history pertaining to trading sessions started and closed, session durations, win rate, price action drops and bounces, as well as layer utilization.
How does it compare to other scripts in the Public Library?
The indicator offers a very detailed, comprehensive settings to address all types of markets found on TradingView where you can implement the price change scalping strategy. The strategy version can be considered the first of its kind on TradingView to leverage the backtester to provide informative, detailed performance measurements surrounding this unique trading strategy. The study version will contain numerous custom alerts to aid in your notification preferences and stay informed on the indicator's activities:
Price Crossed Above Threshold
Price Crossed Below Threshold
Enter Long Position
Exit Long Position
Enter Short Position
Exit Short Position
Price Crossed DCA Layer 1 (Long)
Price Crossed DCA Layer 2 (Long)
Price Crossed DCA Layer 3 (Long)
Price Crossed DCA Layer 4 (Long)
Price Crossed DCA Layer 5 (Long)
Price Crossed DCA Layer 6 (Long)
Price Crossed DCA Layer 7 (Long)
Price Crossed DCA Layer 8 (Long)
Price Crossed DCA Layer 1 (Short)
Price Crossed DCA Layer 2 (Short)
Price Crossed DCA Layer 3 (Short)
Price Crossed DCA Layer 4 (Short)
Price Crossed DCA Layer 5 (Short)
Price Crossed DCA Layer 6 (Short)
Price Crossed DCA Layer 7 (Short)
Price Crossed DCA Layer 8 (Short)
Strategy Results
The default settings are designed to define a "loose" price change settings to ensure that the indicator will render chart elements when first loaded as well as to allow the backtester to gather order executions and display performance summary. The strategy version is using $10,000 initial capital, a commission rate of 0.1% for both entries and exits, and a 1 tick slippage setting. It is also using 2.74506% of the equity with a Order Size Multiplier of 1.33, using 8 total DCA layers, and a take profit of 2% with no stop loss. All other settings are defaults.
It is recommended that the indicator be "tuned" for your specific market in order to best implement the price change strategy and obtain better desirable results. You do so by scrolling through the chart's history and observing moments when prices tend to move rapidly. Measure the number or bars it typcially takes for the price to change at a specific rate. Using this information, you can adjust the Price Change Settings accordingly to configure the indicator for the chart.
Always keep in mind that past performance may not be indicative of future results. Settings that seem favorable for one market may be found to be disastrous in another. Therefore, do take the time needed to understand how the settings will behave with the given chart symbol.
Enjoy! 😊👍
How to obtain access to the script?
You have two choices:
Use the "Website" link below to obtain access to this indicator, or
Send us a private message (PM) in TradingView itself.
Price Change Scalping Strategy v1.0Introduction
This strategy uses a price rate of change (ROC) momentum calculation to determine the percent change in price between a defined range of bars. The calculated ROC value is then compared to the Upper Threshold and Lower Threshold values to determine if a trade setup is to be activated. If the threshold is crossed, a trade setup will occur based on the indicator settings. Entry, Take Profit, and Stop Loss prices are calculated and displayed on the chart. Once the Entry Price is crossed, a long or short position is created (depending on the direction) and once the Take Profit price is crossed, the position is closed. If the Entry Price is not crossed within a specific number of bars, the trade setup is canceled, and it will proceed to monitor price changes for the next set up.
How is it original and useful?
This strategy is unique in that the strategy version fully supports the TradingView backtester, which will enable you to perform experiments with various settings to evaluate performance using the historical chart data. The study version implements numerous custom alerts for you to build TradingView notifications around specific price action events and stay informed with market activity in real-time. Both script versions will provide the same configuration abilities where you can define:
Define a short or long trading strategy.
Price change data source and offset settings.
Your layering placement relative to the entry price.
Your trading parameters like take profit and stop loss offsets, exchange commission rates, trading start time, and order size multiplication for each layer.
Flexible trade eligibility rules that can use other chart indicators, like RSI or EMA, to exclude the selection of entry prices for trading.
The visibility of detailed statistics from the chart history pertaining to trading sessions started and closed, session durations, win rate, price action drops and bounces, as well as layer utilization.
How does it compare to other scripts in the Public Library?
The strategy offers a very detailed, comprehensive settings to address all types of markets found on TradingView where you can implement the price change scalping strategy. The strategy version can be considered the first of its kind on TradingView to leverage the backtester to provide informative, detailed performance measurements surrounding this unique trading strategy. The study version will contain numerous custom alerts to aid in your notification preferences and stay informed on the indicator's activities:
Price Crossed Above Threshold
Price Crossed Below Threshold
Enter Long Position
Exit Long Position
Enter Short Position
Exit Short Position
Price Crossed DCA Layer 1 (Long)
Price Crossed DCA Layer 2 (Long)
Price Crossed DCA Layer 3 (Long)
Price Crossed DCA Layer 4 (Long)
Price Crossed DCA Layer 5 (Long)
Price Crossed DCA Layer 6 (Long)
Price Crossed DCA Layer 7 (Long)
Price Crossed DCA Layer 8 (Long)
Price Crossed DCA Layer 1 (Short)
Price Crossed DCA Layer 2 (Short)
Price Crossed DCA Layer 3 (Short)
Price Crossed DCA Layer 4 (Short)
Price Crossed DCA Layer 5 (Short)
Price Crossed DCA Layer 6 (Short)
Price Crossed DCA Layer 7 (Short)
Price Crossed DCA Layer 8 (Short)
Strategy Results
The default settings are designed to define a "loose" price change settings to ensure that the indicator will render chart elements when first loaded as well as to allow the backtester to gather order executions and display performance summary. The strategy version is using $10,000 initial capital, a commission rate of 0.1% for both entries and exits, and a 1 tick slippage setting. It is also using 2.74506% of the equity with a Order Size Multiplier of 1.33, using 8 total DCA layers, and a take profit of 2% with no stop loss. All other settings are defaults.
It is recommended that the indicator be "tuned" for your specific market in order to best implement the price change strategy and obtain better desirable results. You do so by scrolling through the chart's history and observing moments when prices tend to move rapidly. Measure the number or bars it typcially takes for the price to change at a specific rate. Using this information, you can adjust the Price Change Settings accordingly to configure the indicator for the chart.
Always keep in mind that past performance may not be indicative of future results. Settings that seem favorable for one market may be found to be disastrous in another. Therefore, do take the time needed to understand how the settings will behave with the given chart symbol.
Enjoy! 😊👍
How to obtain access to the script?
You have two choices:
Use the "Website" link below to obtain access to this indicator, or
Send us a private message (PM) in TradingView itself.

CRYPTO TRADING BOT - 1min SCALPING LONG/SHORTHOW IT WORKS
The core concept behind the script is the determination of the current market mood in sense of creating a trendline indicator using EMA / SMA .
By using this trend indication alongside RSI / MACD value range, we are able to enter/exit the market in both directions: LONG and SHORT .
In case of confirmed false signals, we try to catch up the next good opportunity to minimise loss and to close the current trade.
If the chance for a good countertrade is given at this point, the market is going to be entered reversely.
Should the market move incredibly fast against our trade direction, we use proven Stop-loss targets, to bring our children into safety.
As many others, we could tell you now, that we used state-of-the-art machine learning algorithms
as well as highly sophisticated methods to gain our results.
As a fact, we started with an idea, using simple and common trading tools/indicators,
as a solid ground. We did not want to reinvent the wheel and it paid off.
GET A WORKING SCRIPT
The algorithm we are using has initially been created with a self-developed backtesting software.
To be able to deliver gas to our engine, we have bought a huge amount of OHLCV data for the 1min chart.
After many exhausting and frustrating weeks of our workflow-rotation (develop, fail, fix, test, repeat)
we finally got confirmation for all of our conditions/expectations, so we translated our algorithm into pine-code.
THE RESULTS
Since we have been using our Pine-Strategy alongside our backtesting software , we checked all the results provided by TradingView
and our tool to be 100% sure every outcome, every entry and every exit is exactly the same.
We did this for several months and since 2021 June we have been using it with real Alerts, coped to our binance account.
Below, you will find how the performance for the previous months looked like (every trade was made with 100% of the capital, of course using proper stop loss and take profit):
September 2020: 15.18%
October 2020: 36.17%
November 2020: 15.12%
December 2020: 48.58%
January 2021: 150.10%
February 2021: 45.96%
March 2021: 46.48%
April 2021: 4.96%
May 2021: 43.48%
June 2021: -28.99%
Juli 2021: 15.63%
August 2021 (so far): 11.57%
Accumulated Profit: 1,979.01%
To prove our results, we will link an excel sheet for every trade that was made within this timerange.
Link: docs.google.com
ABOUT US
We are two good friends, both incredibly interested in mathematics, software engineering, AI and algorithmics. After getting introduced into the crypto space
by a common friend, we started figuring out that there is a pattern behind every big or small move which happens in an asset.
This is where the passion for creating a CRYPTO TRADING BOT began. It was our goal, to create this script for the 1min Timeframe, so the software can react quickly when a
big or small move is happening - this is why it is called a SCALPING SCRIPT .
We are incredibly proud of this script and would like to share it with this amazing community - just hit us up on TradingView!

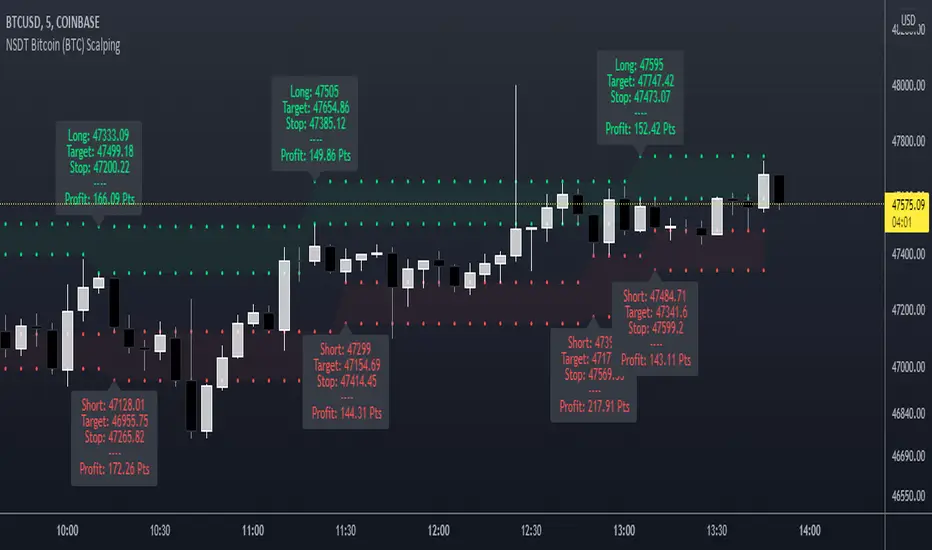
NSDT Bitcoin (BTC) ScalpingThis indicator is specifically designed for scalping Bitcoin (BTC). It looks for a particular price pattern/sequence and displays a label on the chart to show a potential entry, target, and stop based on that analysis. Basically enter long through the green zones and short through the red zones. These levels are not guaranteed to be hit. Trading is risking and you can lose money. Trade at your own discretion and risk. This indicator is only providing potential scalping zones based on recent price action.
Pro Algo Scalping/DT/ST No Repaint/No Lagging by@ProKingTV This is a bar-by-bar trading signal system for scalping, day trading or swing trading on all time frames. It generates ONE signal(buy/sell or long/short) for the most of important bars and candles with no repaint and no lagging.
How does it work?
* Defines all support/resistance(S/R) levels based on floor trader’s pivot points and my own S/R levels.
* Calculates the trend/reversal signals, price reactions close to all above S/R levels.
* Generates one trading signal: buy/long or sell/short based on all combined factors.
What are the signals?
* Blue Arrow signals are bullish
* Pink Arrow signals are bearish
How to use?
* Blue Up Arrow : Buy(Long) or continuous Buy(Long)
* Pink Down Arrow : Sell(Short) or continuous Sell(Short)
* Increase time frame to reduce signal noises, but will generate less trading opportunities.
* There is no way to filter all noises even with higher time frame, all the trades must have a stop.
* This indicator is highly sensitive to a price change and reversal signals will be generated immediately.
How to access?
* PM me to obtain access
* 10 day Free Trial is available

Market Sniper - Trading/Scalping SuiteWelcome to Market Sniper.
Market sniper is meant to be a suite for trading/scalping alongside my indicators script, RSI, Stochastic and Horizontals.
It is based on over 15 Indicators/Oscillators so there is no need for convoluted charts and constantly changing charts/indicators for a better understanding of the market.
Warnings:
I can't stress this enough! This isn't a magic pill that will transform your illiterate grandmother into an expert trader! This is a very powerful tool whose function is to complement your trading/save time (and yes, with practice be your main trading tool).
This algorithm requires setting up and training to be used correctly, please do not expect to load it up and immediately be scalping the 1s charts.
This algorithm is heavy and might require constant refreshes of the browser on slower computers.
Labels overlap at the moment, working on this part at the moment. So, always zoom in before doing a trade / change the "+- signals in settings"
Candlestick patterns need tweaking, I personally have it off and use my own judgement atm.
What it includes:
Trend reversal / continuation (Macd, Stochastics, money flow , CCI , momentum, DIOSC (automatic trendlines ), SuperTrend, Moving averages, etc, etc.)
RSI divergence drive / drive counter (base code from Libertus, check his profile as he has very helpful scripts)
Bull Market expansions for longterm take profit and increasing position
Candlestick patterns
Trend reversal / Continuation
Green = Bullish reversal
Red = Bearish trend reversal
Orange = Trend continuation / strengthening
Trend Continuation/Strengthening
A warning here, trend strengthening also means that many times the indicators are overextended or close to it
------
The numbers reflect the amount of indicators that are signaling a reversal over the specified period on the settings.
For higher timeframes this setting should be on a lower value and the opposite for lower timeframes.
This works on every market and every timeframe(according to months of my own paper and real trading). Remember that each market/asset/commodity has different soft spots so tweaking, backtesting and present accuracy review should be of maximum priority.
Bull Market expansion phase
Warning:
The indicator purposely does not show any signals during bear markets. It is my opinion bear markets complexity render this tool close to useless.
It was designed to be used in higher timeframes, tough it SEEMS to have a good track record / be useful in lower timeframes.
it will ALWAYS give a fake signal at the end of a bull market because of the very nature of the code.
It is based of EMAs, RSI and Stochastic
Candlestick Patterns
Bullish candlestick patterns:
Hammer
Inverted Hammer
Dragonfly
Gravestone
Bearish candlestick pattern:
Shooting Star
Hanging Man
Gravestone
Dragonfly
RSI divergence drive
- Credit to Libertus for the base code of this section
The green triangle means there are at least 2 drives of valid divergence, yellow for 3 and red for 4+.
The script shows triangles when confirmation candle closes.
You need to know how divergence works to use this section. investopedia can easily get you there.
For cryptos I use 2-4h+ timeframes, for traditional markets I use 15min+ for forex I use it basically in every timeframe.
For questions/suggestions and access PM me in the platform itself and don't forget -> FEEDBACK IS IMPORTANT
Thank you all

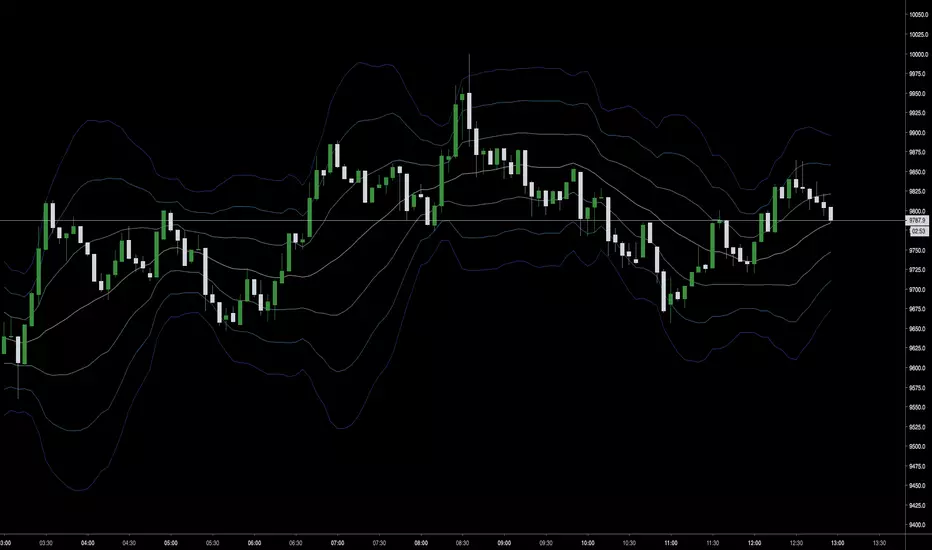
Deviation Bollinger Band On-the-Fly Scalping System (3 Dev's)3 Deviation Bollinger Band On-the-Fly Scalping System
check meangreenmoneymachine.com
read "Scalping Forex with Bollinger Bands & Maximizing Profits by Joseph Wohlers
Cyatophilum Scalping Bot V2 [BACKTEST]Improved version of Cyatophilum Scalping Bot
Default settings for BITMEX:XBTUSD
2% stop loss
2% trailing take profit

PA Researcher Perfect Auto-Scalping [NASDAQ]This is PA Researcher Perfect Auto-Scalping Indicator for NQ1!
Amazing Hit Ratio on 3min/5min chart
No Repainting

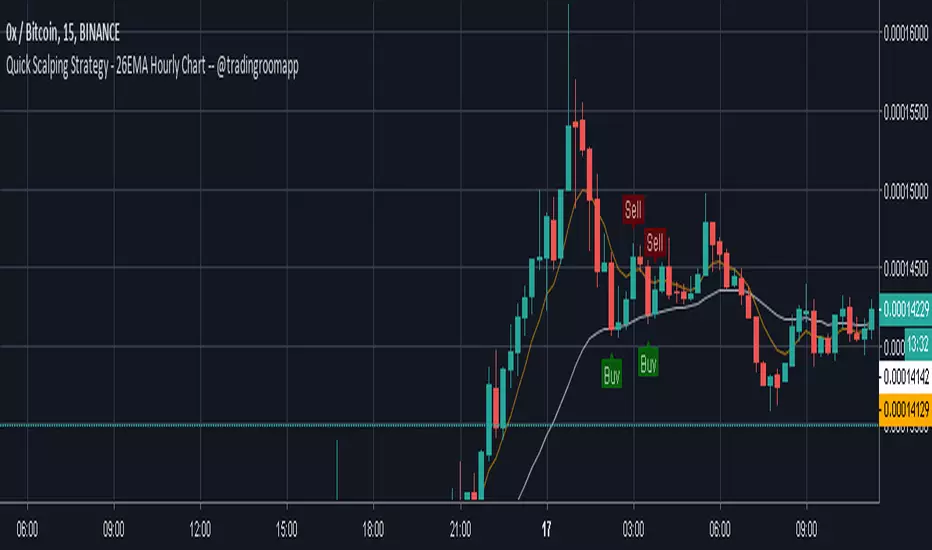
Quick Scalping Strategy - 26EMA Hourly Chart -- @tradingroomappQuick Scalping Strategy around 26EMA and 7EMA published by @TradingRoomApp twitter.com
and brought into TV by myself.
It will give you a quick Buy and Sell opportunity based on crypto price spikes.
If you want access to the tool feel free to send me a DM or contact me through twitter (@CryptoNTez)
Happy Trading!
Bimex Scalping [PlungerMen] 15mHello!
This free community edition is very good for a 15 minute time frame
This Script is very well used as it works by itself and very well used in conjunction with the "Bitmex Long Short" script, both compliment for each other. the "Bitmex Long Short" script is Free, you can find it
If you want to be more accurate and more efficient, more comfortable when you do not want to see too many other indicators, you can register for our Professional edition.
- The Professional Edition supports Level 1 and Level 2 commands, which are very effective in allocating funds and optimizing your profits
Besides that,You will be supported by personal preferences, profit maximization
- Register for a Professional version will be used 2 Script,Bimex Scalping Pro and Bitmex Long Short Pro
- We will invite you to the signal channel with the announcement of the bottom and the peak of the BTC ,the big variable variable has exists
We hope you enjoy this script. Your support will help us develop more good quality scripts in the future to serve the community
**Remember, Like this script and posivite feedback if you are satisfied**
if you have any questions Plz post a comment ... below here
******
Thanks

Draculapresley's Daytrading Scalping STRAT O' DoomUsing some custom settings with a few indicators and a custom movement algorithm I have backtested this script and used it with great results. Excellent for getting in and out for quick scalping trades. The results are typically 1% + and sometimes even a great deal more. The indicator gives you buy and sell points and works great with 15 min candles though you can modify the inputs to work with any time frame. Use all 3 indicators for safest bets but most of the time just using the Stoch input with the movement algorithm almost always yields positive results with tons of buys. Works pretty well even in a downturn but absolutely kills in a bull market.
Check out the screenshots below.
imgur.com

OneX HiteshB Scalping Indicator 1.0Full Documentation:
This script uses the 10 and 20 period EMAs on the higher time frame to determine the trend and 14 period Stoch RSI from current time frame to determine entries in the direction of the trend.
Available Settings :
1. Turn On/Off Trend - This will show you the bearish trend in a red background and the bullish trend in a green background. Redundancy only, the indicator is already calculating trend without this setting.
2. Stoch RSI settings - These are set to default. The SRSI sensitivity is set to 15 for oversold and 85 for overbought, and this cannot be edited.
3. Target and Stop Loss offsets - You can modify this according to your Reward:Risk.
Known Issues:
-Old entries do not erase if the stop loss was hit
Pros:
1. Very useful in scalping in the direction of the trend
2. Can be used on ANY time frame, across ANY asset class (however I recommend using this between the 5 minute to 30 minute time frames for the most profitability, with the 15min being my personal favourite)
3. Current average profitability stands at roughly 65% across any mix of trends - this will be proven in the strategy to be released later this week)
Cons:
1. Unable to call any sort of trend reversal
2. Does not account for stop runs on lower time frames (1min-3min but I don't recommend using those time frames anyway)
Future Plans:
-Implementation of SRSI divergences
If you have any criticism or suggestions, please do comment below.
[BullTrading] 1 minute Easy Scalping Sys v3.0This is the third version of Bull Trading Easy Scalping Tool for 1 minute charts. This improved code filters trend direction and power to avoid some false entries on horizontal markets. Exits after profit are commonly taken when the price hits the ma's.
DISCLAIMER:
The Following indicator/code IS EXPERIMENTAL AND NOT intended to be a formal investment advice or recommendation by the author, nor should be construed as such. Users will be fully responsible by their use regarding their own trading vehicles/assets.
