Intraday Trading Tool [VK]This Indicator is all you need to day trade.
Overview: This is a intraday/scalp trading Indictor works using MTF- MA,MACD,RSI for trend ,SRSI For Entries , Murrey Lines for Targets and ATR For Stop Loss , it is designed for all type of markets (crypto, forex, stocks, commodity etc.) and works on all commonly used timeframes .
About The Indicator :
This indicator uses the most commonly used indicators in The markets, MA channel + MACD (Background Trend) + RSI (Trend On Top) . This Three Indicators Are Used For Trend In Higher Time Frame. We Have to take trades based on Trend In Higher Time Frames. We are using SRSI For entries which Has the function to show entries from Higher Time Frames .
Stop Loss And Take Profit : we have used ATR for Stop Loss which will show up with Buy/Sell Signals. and for Taking Profit We Have used Murrey Lines Which Can be used to see Support/Resistance as Targets And also has the function to show Support/Resistance from Higher Time Frame.
Extra Function :
The Cross And Triangles On the Bottom of the Chart Indicates MACD Cross on Higher Time Frames .
How to get access:
Send a Private Massage for getting access to the script.
"scalp" için komut dosyalarını ara

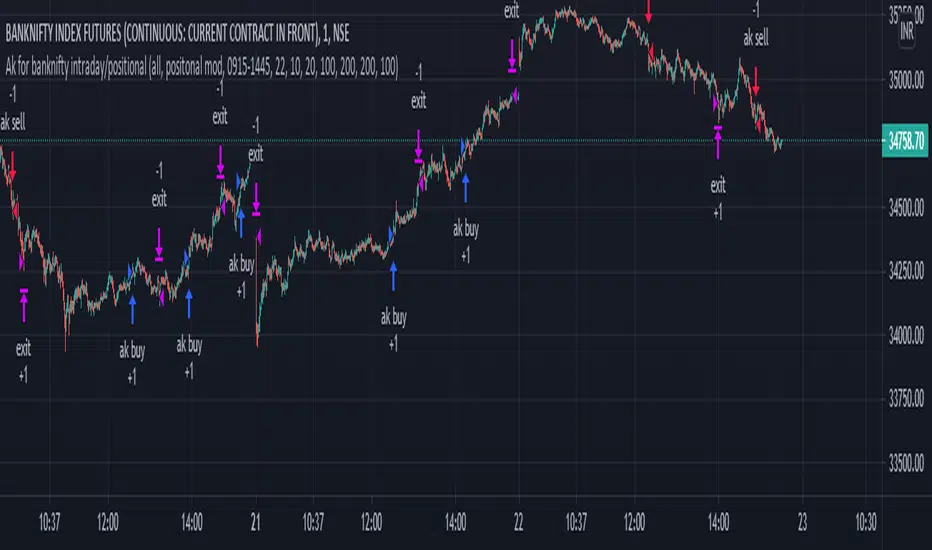
Ak for Banknifty intradayHi friends this is Ak for Banknifty Intraday
It analyse price action when price makes higher high or higher low and it scalps and take profit ..its occur in moment of time so for that algo trading require..it automatically take profit and stoploss and close trade near session end. u can also change time for close trade...it automatically calculate previous candles high and low and when it breaks it generate buy and sell signal...
TTM Scalper Alerts [SystemAlpha]This is an alert companion of the TTM Scalper Strategy based on TTM scalper indicator. Instead of using just the normal buy and sell signal, we added an option to use trend filters, trailing stop loss and take profit targets.
The TTM scalper indicator of John Carter’s Scalper Buys and Sells was originally created by HPotter and is a close approximation of the one described in his book Mastering the Trade.
In this study you have a choice of:
Trend Filters:
- Average Directional Index ( ADX ) – buy when price is trend is up and sell when trend is down.
- Moving Average (MA) – buy when price close above the defined moving average and sell when price close below moving average
- Parabolic SAR – buy when SAR is above price is above price and sell when SAR is below price.
- All - Use ADX , MA and SAR as filters
For MA Filter , you can use the “TF MA Type” and "TF MA Period" parameter to select Simple or Exponential Moving Average and length.
Stop Loss:
- Average True Range (ATR) – ATR % stop as trailing stop loss.
- Parabolic SAR ( SAR ) – Parabolic SAR adapted as trailing stop loss.
For ATR , you can use the “ATR Trailing Stop Multiplier” parameter to set an initial offset for trailing stop loss.
Take Profit Target:
- Average True Range (ATR) – ATR % stop as trailing stop loss.
- Standard % – Percent as target profit
For ATR , you can use the “ATR Take Profit Multiplier” parameter to set an initial offset for trailing stop loss.
Additional feature include:
- Show Bar Colors
Alerts:
When creating alerts use “Once Per Bar Close” parameter for Long and Short and “Once Per Bar” for Close, Trailing Stop, and Take Profit.
TradingView Links:
Strategy:
Reference:
HPotter TTM scalper indicator Strategy
How to use:
1. Apply the script by browsing through Indicators --> Invite-Only scripts and select the indicator
2. Once loaded, click the gear (settings) button to select/adjust the parameters based on your preference.
3. Wait for the next BUY or SELL signal to enter the trade!
Disclaimer:
The indicator and signals generated do not constitute investment advice; are provided solely for informational purposes and therefore is not an offer to buy or sell a security; are not warranted to be correct, complete or accurate; and are subject to change without notice.

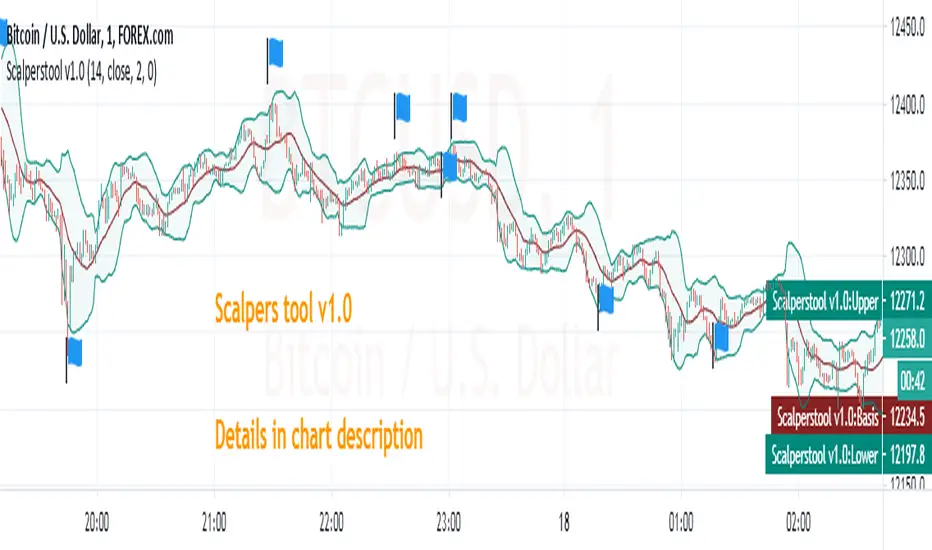
Scalperstool v1.0_Ramesh0296Scalperstool v1.0
This indicator can use for scalp in Highly liquid stocks,indices and currencies
What here i used ?
Here i used Bollinger bands with Modified Relative Strength Index (n=2)
How to use it ?
Apply scalperstool v1.0 in chart
Time frame 1min
once you applied 3 lines will plotted on chart but the value dimensions shows 4 value in top left side on the chart
first 3 values related to bollinger bands(here i used it for dynamic support and resistance). the last value shows modified RSI value
CONDITIONS
CONDITION 1
1 min candle should close and it must showing below value
safe Players
Buy condition (too safe) : RSI value should be less than or equal to 3
Sell condition (too safe) : RSI value should be greater than or equal to 97
Moderate Risk takers
Buy condition : RSI value should be less than or equal to 10
Sell condition : RSI value should be greater than or equal to 90
Most of the time the value above mentioned equals to bollinger upper band(overbought) and lower band(oversold) zones
CONDITION 2
May scalp alone with 1st condition but my favorite is i combined above condition with this one
This is too simple that 1 min candle should close with long upper wick or long lower wick & mostly its open equals to high looks like a hammer but not exact one.
I flag some good trades in chart.
STOP LOSS SHOULD BE ENTRY CANDLE'S PREVIOUS ONE LOW OR HIGH.
--------------------------------------------------------------------------------------------------------------------------
LIKE & FOLLOW TO SHOW YOUR LOVE & SUPPORT AND ALSO TO GET MORE TRADE IDEAS AND SCRIPTS
**Educational Purpose only
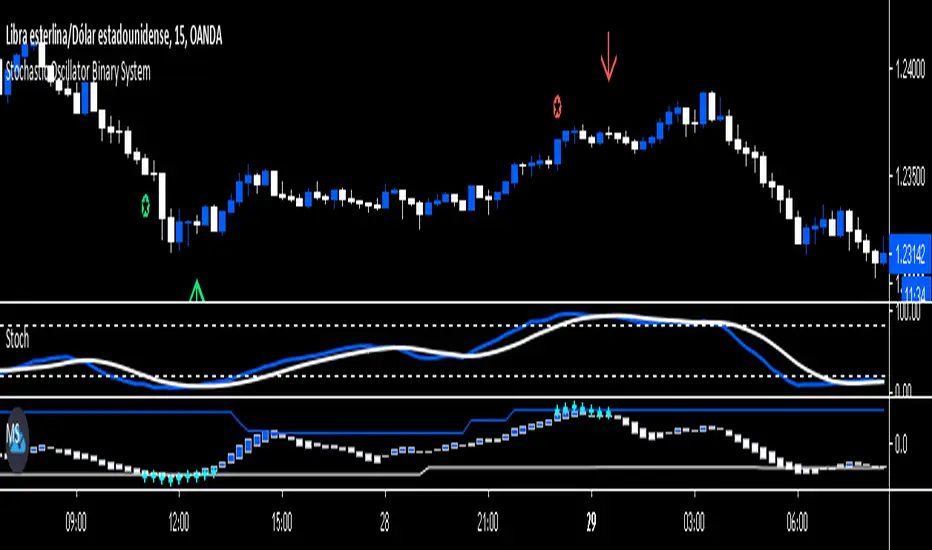
Stochastic Oscillator Binary System by Hashtag_binaryRules
- Time Frame 1 min.
- Expires Time 3 min or 15 min (the best option).
- Markets: Forex (only volatile currency pair), Futures.
- Sessions: London and New York.
Call
- Heiken Ashi Dodger blue;
-Stochastic Oscillator cross upward from oversold Zone (conservative trade, aggressive trade: Stochastic Oscillator cross upward ).
-Matrix three square dodger blue.
Put
- Heiken Ashi white;
- Stochastic Oscillator cross downward from overbougth Zone (conservative trade, aggressive trade: Stochastic Oscillator cross downward ).
- Matrix three square withe.
This Binary System is also good for trade scalping. The same rule for entry with conservative trade:
Exit position options
- For Buy close position when the stochastic line touches 80 levels,
- For Sell close positions when stochastic line touches 20 levels.
- Initial Stop loss on the previous swing.
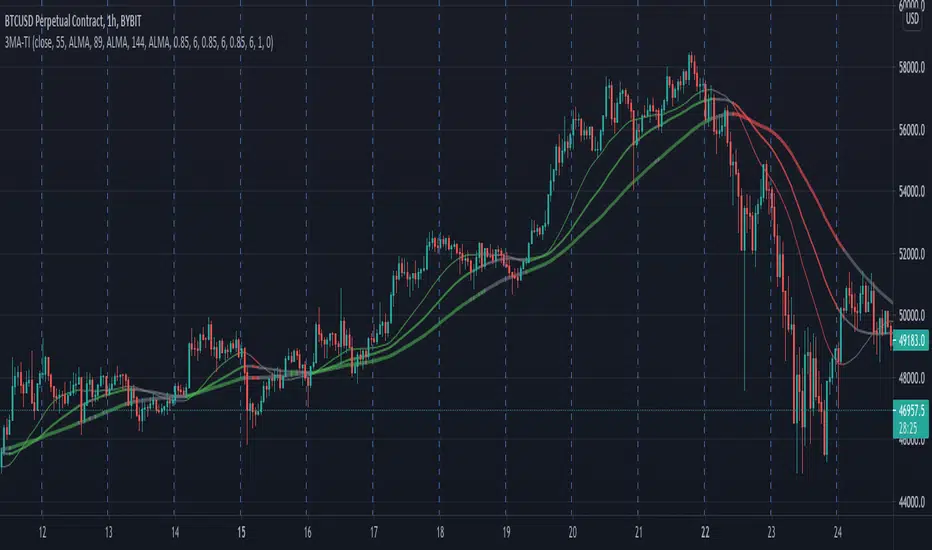
3 MA Trend IndicatorIt is a trend detector indicator, using 3 moving averages.
You can select different MA's and set the periods of them. If all 3 is increasing, the color will be green, if decreasing, the color will be red, gray otherwise.
It can be used for e.g. scalping.
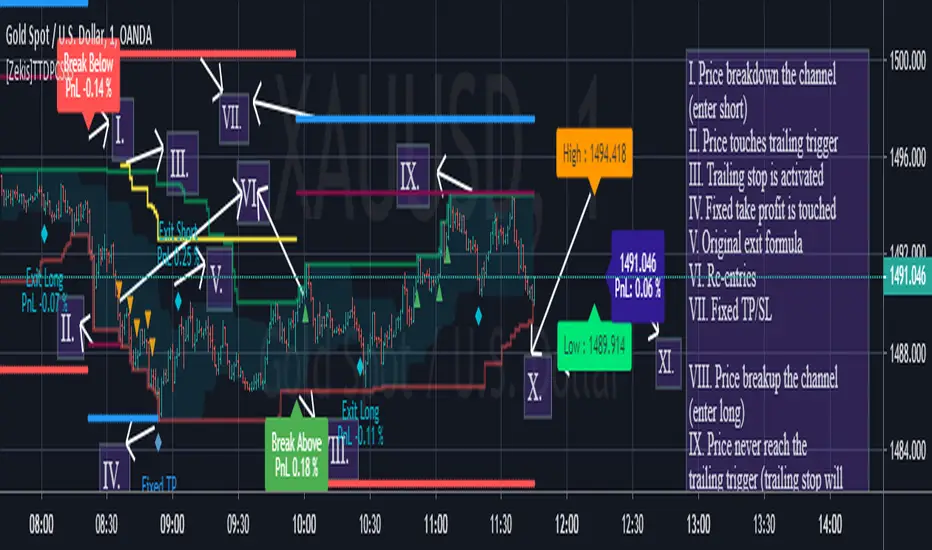
[Zekis]Turtle Trading Donchian Price Channels StrategyOne of the most famous strategy in the history of trading, #Turtle strategy have numerous legends, one of them is using Donchian Price Channels with 55 period for entries and 20 period for exits.
Can be used with any time frame
Added alerts
I added re-entries and re-exits for more scalps or for laddering trading.
Also you can modify parameters for entries and exits for your market needs.
Trade safe!
@Zekis
ATR CHANNEL .2Channel based on 100MA & daily ATR / volatility - whole point is to warn and show you where not to participate. Signals can be considered as higher probability trades, short term reversal type scalps - especially effective at FX and stock trading

HiLoMAHiLoMA (High/Low Moving Average) was designed specifically for calculating moving average boundries similar to Bollinger Bands, but is derived from the highest and lowest prices of an asset, not just the closing price. The timeframe is configurable and the study displays arrows where buys (below) and sells (above) should take place.
On exchanges with low or discounted fees, the study does excessively well at scalping. Backtesting, in general, shows this study to be very robust in any market conditions.
The alert conditions are clearly identified as BUY ASSET and SELL ASSET for automated trading.
Buys only occur when the entire spread is below the momentum line.
Sells only take place when the entire spread is above the momentum line.
When the momentum line cuts through the spread, any potentional buys/sells are ignored as these are considered weak.
Be sure your calculate your momentum on the basis of your candlestick timeframe. If you are using 3 minutes candlesticks and you want a 24 hour momentum, you need to set your momentum to 480. This holds true for all timeframes.
Sep 24
Release Notes: Seperated buys/sells where spread crosses momentum.
Cyan (lighter blue) arrows are buy/sell signals that disregard momentum.
Buys/Sells that honour momentum are now labeled MOMBUY ASSET and MOMSELL ASSET.
Buys/Sells that disregard momentum are now BUY ASSET and SELL ASSET accordingly.
Oct 4
Release Notes: Momentum is now a band with an upper and lower boundry. Buys and sells must now be completely above the band or below the band respectively. The effect is to produce stronger signals for momentum precomditional trades.

Maverick - Strategy TesterWelcome to the Maverick - Strategy Tester.
This indicator is used for back-testing. Once you have found settings that you like, you can use my other published indicator "Maverick" to set alerts.
How to use: Apply to any chart, on any time frame. You will see LONG and SHORT signals on the chart. A LONG signal represents an entry/buy in, and a SHORT signal represents an exit/sell.
You can use the Maverick - Strategy Tester to scalp on low time frames such as the 5m, 15m, 30m etc. Or use it on higher time frames such as the 1hr, 2hr, 4hr.
You can use regular candles but Heikin Ashi are recommended for better accuracy.
When using Heikin Ashi, I have included a real price line which shows the actual price of the asset/chart at the close of each candle.
You cannot set alerts with this indicator!
MaverickWelcome to the Maverick.
How to use: Apply to any chart, on any time frame. You will see BULL and BEAR signals on the chart. A BULL signal represents an entry/buy in, and a BEAR represents an exit/ sell.
You can use the Maverick to scalp on low time frames such as the 5m, 15m, 30m etc. Or use the Maverick on higher time frames such as the 1hr, 2hr, 4hr.
You can use regular candles but Heikin Ashi are recommended for better accuracy.
When using Heikin Ashi, I have included a real price line which shows the actual price of the asset/chart at the close of each candle.
Settings alerts: You can easily set buy/sell alerts by selecting Maverick in the set alerts tab and selecting Bull for buy alerts and BEAR for sell alerts.
To gain access to this INVITE ONLY script, please join the discord for a free trial: discord.gg


Spacer - SRThis script spaces prices between charts while scalping
They can be used as potential support and resistance
Prices are spaced with odd numbers only 1,3,5,7,9
Enjoy the script

PPSignal BB and EWO BB Strategy ScalpDescription:
This indicator is an implementation of the Bollinger Band and EWO Oscillator Scalping system.
This technique is for those who want the most simple method that is very effective. It is BEST traded during the busiest trading hours, 3am to 12am EST NY time. This method doesn't work in sideways markets, only in volatile trending markets.
-Time Frames: 1, 5, 10, 15 ,30 min.
-Currency pairs: majors, btc, futures and volatile stock.
Other Chart indicators:
Add EWO bb.
Optionally Add Squeeze Indicato or bbsqueeze .
Here's the strategy:
// Going LONG:
Enter a long position when Curve Slope has crossed up through the Bollinger upper band (lime) . At the same time, the EWO BB or BBqueeze should be approaching or crossing it's zeroline, going up. This is indicated by "Buy" alert.
// Going SHORT:
Enter a short position when Curve Slope has crossed down through the low Bollinger red. At the same time, the EWO BB or BBqueeze should be approaching or crossing it's zero line, going down. This is indicated by the "Sell" Alert.
// Take profit:
// 10-20 pips depending on pair or When Awesome Oscillator turns a different color.
// HINTS: Best trades tend to occur when price reversing bounce off outer band and and outside Optional Bollinger Squeeze indication.
// References:
www.forexstrategiesresources.com

SeerFirst, we cheat, then, we go broke. Maybe.
Seer is a private technical indicator based on volatility, trend analysis, volume, flow and reversion. It is incredibly accurate across every asset class, including: futures, indexes, individual equities, commodities, forex and crypto. It can be used on every timeframe, from the 1m for fast, high strike rate scalps, to the daily or weekly for longer-term positions. Due to it's insane strike rate it will not be made public (examples below). If you are a billion-dollar hedge fund I may consider selling the indicator, otherwise the expected value from selling it is less than the edge I would give up by sharing it. If you have a counter-offer feel free to send me a message.

MaxGains BitMEX Scalper - Buy / SellIts' a new indicator for scalping on BitMEX.
The most profitable indicator available on TradingView.
If you study this indicator correctly you will make good amount of money.
We made this indicator for scalping on BitMEX but you can use it in any markets like forex, stock, crypto etc.
You can use any timeframe but I suuggest you to use low timeframes like 30 min, 45 mins & 1 hr.
You can set alerts also

RSI scalperRSI for scalpers and swingers, easily to identify divergence.
Intraday S/R levels (0) for easy trading.
green line = in the money
red line = reconsider your position
For BTC, xbt, altcoins, forex & stocks
Trial version 7 days, contact me

R1 ScalpCan be used on various chart periods. Calculates entry and exits for options. Expiry of options should be chosen based on timeframe (weekly for intra-day scalps, 2-3 weeks for Daily, etc).

INSTITUTIONAL MOMENTUM [@Ash_TheTrader]⚡ The Impulse Engine: Institutional Velocity & Smart Structure System
Subtitle/Short Description: Stop looking at just Open and Close. Visualize the speed of price action, detect institutional footprints, and trade off dynamic "living" market structure that flips and burns automatically. Developed by @Ash_TheTrader.
The Hidden Dimension of Price Action
Most traders look at a standard candlestick and see four data points: Open, High, Low, and Close.
But this hides the most critical information: The struggle.
Did the buyers step in aggressively in the first 5 minutes, pushing price to highs instantly? (Institutional buying)
Or did it take 59 minutes of slow, grinding effort to reach that high? (Retail exhaustion/Trap)
Standard candles look identical in both scenarios. The Impulse Engine, developed by @Ash_TheTrader, solves this by visualizing the "Speed of Price" (Velocity) directly onto your chart, combined with a state-of-the-art, dynamic market structure system.
It’s not just an indicator; it’s a complete market X-ray.
1. The Velocity Painter: See the Speed ⚡
The core of this system is the Velocity Engine. It looks "inside" your current timeframe bar (using lower timeframe data) to calculate how fast price traveled to its extremes.
It paints the bars based on institutional urgency, allowing you to ignore the noise and focus on the momentum.
The Visual Code:
⚡ NEON CYAN (Bullish Impulse) : Aggressive buying. Price ripped from the open to the high very quickly. This is where the smart money is stepping on the gas.
⚡ NEON MAGENTA (Bearish Impulse): Aggressive selling. Price crashed from the open to the low immediately.
💤 FADED GREY (Exhaustion/Trap): The "grind." Price took a long time to reach its extremes. These are often low-momentum environments or potential traps waiting to reverse.
STANDARD GREEN/RED: Normal market flow with no significant velocity extremes.
"Trade the Neon, Ignore the Grey." — @Ash_TheTrader
2. Smart Structure: "Living" Levels 🏗️
Old-school pivot indicators clutter your chart with endless historical lines that are no longer relevant. The Impulse Engine uses a "Living Structure" algorithm that manages the lifecycle of every support and resistance level.
It only shows you the two most relevant Resistance levels (R1, R2) above price, and the two most relevant Support levels (S1, S2) below price.
Risk-Based Classification:
You choose the structure based on your trading style in the settings:
Scalp Mode: Detects short-term, 5-bar swings. (Thin dotted lines).
Trend Mode: Detects standard trend swings (21-bar). (Dashed lines).
Major Swing: Detects deep, major structural points (60-bar). (Thick solid lines).
The "Flip & Burn" Mechanic (Viral Feature) 🔥
This is where the system gets smart. It understands market mechanics:
The Flip (Role Reversal): If a Resistance level is broken by a candle close, it automatically turns Gold and becomes Support (Flip). The same applies to Support turning into Resistance. You no longer need to guess if an old level will hold from the other side.
The Burn (Auto-Cleaning): If a "Flipped" level is broken again, the system recognizes it has lost its structural integrity. The line is instantly "burned" (removed from the chart).
This ensures your chart only ever shows levels that are active and respected.
3. Whale Signs: The Footprint of Big Money 🐋
Sometimes, velocity isn't enough. You need to see raw power.
The Whale Sign feature detects massive expansions in volatility. It flags any candle whose range is significantly larger (default 2x) than the average of the previous two candles.
💚 Green Triangle + $ (Below Bar): A massive bullish expansion candle. A "Wake Up" call for longs.
❤️ Red Triangle + $ (Above Bar): A massive bearish expansion candle. A warning sign for shorts.
These often precede sustained velocity moves.
4. The Pro HUD (Heads-Up Display) 💻
In the bottom right corner, the dynamic HUD gives you a real-time health check of the current candle.
Status Header: Instantly tells you if the current candle is IMPULSE, EXHAUSTION, or NORMAL.
Live Velocity %: The exact speed score. The text color changes to Neon during impulses and fades to grey during exhaustion.
Mode Info: Reminds you which risk setting you are currently using (e.g., Mode: ).
Signature: The official @Ash_TheTrader stamp of quality.
How to Trade With The Impulse Engine
This system is designed for confluence. Never trade a signal in isolation.
📈 Strategy 1 : The "Velocity Bounce" (Trend Continuation)
Ensure the market is trending (e.g., making higher highs).
Wait for price to pull back to a Smart Support level (Cyan dashed line or Gold "Flip" line).
Trigger: Look for a Neon Cyan Impulse Candle to form right off that support level. This confirms institutions are defending the structure with speed.
📉 Strategy 2: The "Whale Breakout"
Identify a consolidation zone below a Smart Resistance level.
Trigger: A Whale Sign ($) appears on a candle that successfully closes above the Resistance level.
Confirmation: The very next candle should ideally be a Neon Impulse candle continuing the move.
Conclusion
The markets are moved by aggression and speed. By obscuring this data, standard charts put you at a disadvantage.
The Impulse Engine brings this hidden data to the forefront, combining institutional velocity detection with smart, automated market structure that reacts to price just like a professional trader would.
Trade faster, trade smarter.
Developed by @Ash_TheTrader.
(Disclaimer: This tool is for informational purposes only and does not constitute financial advice. Always manage your risk.)

Sultan MA Trinity – Scalper to SwingSultan MA Trinity Pro is an institutional moving-average trend engine for scalping, intraday and swing trading.
It auto-adjusts EMAs and ATR-based SL/TP per mode, prints clean BUY/SELL signals with break-even logic, and shows a live dashboard for trend, last trade and key MA levels.
Use it as a directional framework and confluence tool alongside your own SMC/VSA rules – not as a blind signal generator.

IDLP – Intraday Daily Levels Pro [FXSMARTLAB]🔥 IDLP – Intraday Daily Levels Pro
IDLP – Intraday Daily Levels Pro is a precision toolkit for intraday traders who rely on objective daily structure instead of repainting indicators and noisy signals.
Every level plotted by IDLP is derived from one simple rule:
Today’s trading decisions must be based on completed market data only.
That means:
✅ No use of the current day’s unfinished data for levels
✅ No lookahead
✅ No hidden repaint behavior
IDLP reconstructs the previous trading day from the intraday chart and then projects that structure forward onto the current session, giving you a stable, institutional-style intraday map.
🧱 1. Previous Daily Levels (Core Structure)
IDLP extracts and displays the full previous daily structure, which you can toggle on/off individually via the inputs:
Previous Daily High (PDH)
Previous Daily Low (PDL)
Previous Daily Open
Previous Daily Close,
Previous Daily Mid (50% of the range)
Previous Daily Q1 (25% of the range)
Previous Daily Q3 (75% of the range)
All of these come from the day that just closed and are then locked for the entire current session.
What these levels tell you:
PDH / PDL – true extremes of yesterday’s price action (liquidity zones, breakout/reversal points).
Previous Daily Open / Close – how the market positioned itself between session start and end
Mid (50%) – equilibrium level of the previous day’s auction.
Q1 / Q3 (25% / 75%) internal structure of the previous day’s range, dividing it into four equal zones and helping you see if price is trading in the lower, middle, or upper quarter of yesterday’s range.
All these levels are non-repaint: once the day is completed, they are fixed and never change when you scroll, replay, or backtest.
🎯 2. Previous Day Pivot System (P, S1, S2, R1, R2)
IDLP includes a classic floor-trader pivot grid, but critically:
It is calculated only from the previous day’s high, low, and close.
So for the current session, the following are fixed:
Pivot P – central reference level of the previous day.
Support 1 (S1) and Support 2 (S2)
Resistance 1 (R1) and Resistance 2 (R2)
These levels are widely used by institutional desks and algos to structure:
mean-reversion plays, breakout zones, intraday targets, and risk placement.
Everything in this section is non-repaint because it only uses the previous day’s fully closed OHLC.
📏 3. 1-Day ADR Bands Around Previous Daily Open
Instead of a multi-day ADR, IDLP uses a pure 1-Day ADR logic:
ADR = Range of the previous day
ADR = PDH − PDL
From that, IDLP builds two clean bands centered around the previous daily Open:
ADR Upper Band = Previous Day Open + (ADR × Multiplier)
ADR Lower Band = Previous Day Open − (ADR × Multiplier)
The multiplier is user-controlled in the inputs:
ADR Multiplier (default: 0.8)
This lets you choose how “tight” or “wide” you want the ADR envelope to be around the previous day’s open.
Typical use cases:
Identify realistic intraday extension targets, Spot exhaustion moves beyond ADR bands, Frame reversals after reaching volatility extremes, Align trades with or against volatility expansion
Again, since ADR is calculated only from the completed previous day, these bands are totally non-repaint during the current session.
🔒 4. True Non-Repaint Architecture
The internal logic of IDLP is built to guarantee non-repaint behavior:
It reconstructs each day using time("D") and tracks:
dayOpen, dayHigh, dayLow, dayClose for the current day
prevDayOpen, prevDayHigh, prevDayLow, prevDayClose for the previous day
At the moment a new day starts:
The “current day” gets “frozen” into prevDay*
These prevDay* values then drive: Previous Daily Levels, Pivots, ADR.
During the current day:
All these “previous day” values stay fixed, no matter what happens.
They do not move in real time, they do not shift in replay.
This means:
What you see in the past is exactly what you would have seen live.
No fake backtests.
No illusion of perfection from repainting behavior.
🎯 5. Designed For Intraday Traders
IDLP – Intraday Daily Levels Pro is made for:
- Day traders and scalpers
- Index and FX traders
- Prop firm challenge trading
- Traders using ICT/SMC-style levels, liquidity, and range logic
- Anyone who wants a clean, institutional-style daily framework without noise
You get:
Previous Day OHLC
Mid / Q1 / Q3 of the previous range
Previous-Day Pivots (P, S1, S2, R1, R2)
1-Day ADR Bands around Previous Day Open
All calculated only from closed data, updated once per day, and then locked.

Indian Scalper 2025 – PSAR + SMA50 + RSI≤50 + High Volume (75%)Best 1-min / 2-min scalping strategy for NIFTY, BANKNIFTY, FINNIFTY & liquid stocks in 2025
✓ PSAR flip + SMA-50 trend filter
✓ RSI ≤50 (avoids chasing)
✓ Only high-volume candles (bright colour)
✓ Loud mobile alerts with price & SL
✓ 1:2+ RR with PSAR trailing
Works like magic 9:15–11:30 AM and 2–3:20 PM
Made with love for the Indian trading community ♥

OBV + WaveTrend Volume Scalper [GratefulFutures]This script is a combination script of three different strategies that provides buy and sell signals based on the change of volume with momentum confirmations.
Sources used:
This script relies on the outstanding scripts of the great script writer LazyBear: LazyBear
The following scripts were used in this publication:
1. A modified "On-Balance Volume Oscillator" modified from LazyBear's original script:
2. Wavetrend Oscillator with crosses, Author: LazyBear
3. Squeeze Momentum Oscillator, Author: LazyBear
This script functions based on the following criteria being true:
1. On balance volume oscillator turning from negative to positive (buy) or positive to negative (sell)
2. Squeeze Momentum value is increasing (buy) or decreasing (sell)
3. Wavetrend 1 (wt1) is greater than wavetrend 2 (wt2) (buy)/ Wavetrend 1 (wt1) is less than wavetrend 2 (wt2) (sell)
By combining these factors the indicator is able to signal exactly when net buying turns to net selling (OBV) and when this change is most advantageous to continue based on the momentum and price action of the underlying asset (SQMOMO and Wavetrend).
This allows you to pair volume and price action for a powerful tool to identify where price will reverse or continue providing exceptional entries for short term trades, especially when combined with other aspects such as support and resistance, or volume profile.
How to use:
Simply adjust the settings to your preference and read the given signals as generated.
Settings
There are multiple ways to tune the signals generated. It is set standard for my preferred use on a 1 minute chart.
OBV Oscillator Settings
The first 4 dropdowns in the Inputs section tune the On Balance Volume Oscillator (OBVO) portion of the indicator. You can choose if you want it to calculate based on close, open, high, low, or other value.
The most impactful in the entire settings is going to be the length and smoothing of the OBVO EMA. Making this number lower increasing the sensitivity to changes in volume, making the signals come quicker but is more susceptible to quick fluctuations. A value of between (5-20) is reasonable for the OBVO EMA length. There is a separate smoothing factor titled OBV Smoothing Length and below that, OBV Smoothing Type , a value of (2) is standard with "SMA" for smoothing type with a value of between 2-10 being reasonable. You may also play with these values to see what you like for your trading style.
Wavetrend Settings
The next 3 options are to modify the wavetrend portion of the indicator. I do not modify these from standard, and feel that they work appropriately on all time frames at the following values: n1 length (10), n2 length (20), Wavetrend Signal SMA length (4)
Squeeze Momentum Settings
The following 5 options through the end modify the Squeeze momentum portion of the indicator. The only one that modifies the signals generated is the KC Length , Making this number lower increasing the sensitivity to changes in price action, making the signals come quicker but is more susceptible to quick fluctuations. A value of between (18-25) is reasonable for KC Length .
Style Setting
You may select if you want to see the buy and sell signals. The following 5 options Raw OBV Osc through Squeeze Momentum allow you to see where each specific requirement was met, posted as a vertical line, but for live use it is recommended to turn all of these vertical lines off and only use the buy and sell signals.
Time Frames:
While this script is most effective on shorter time frames (1 minute for scalping and daytrading) it is also viable to use it on longer timeframes, due to the nature of its components being independent of time frame.
Examples of use - (Green and red vertical lines are for visualization purpose and are not part of the script)
SPY 1 Minute (Factory Settings):
SPX 15 minutes (Factory Settings):
Considerations
This script is meant primarily for short term trading, trades on the basis of seconds to minutes primarily. While they can be a good indication of volume lining up with momentum, it is always wise to use them in combination with other factors such as support, resistance, market structure, volume levels, or the many other techniques out there...
As Always... Happy Trading.
-Not_A_Mad_Scientist (GreatfulFutures Trade University)
