Scalping 4D+ Engine (Advanced Entry Modes {SMC})Scalping 4D+ Engine (Advanced Entry Modes {SMC}) is a next-generation quantitative trading model engineered for traders who want fewer but higher-probability signals.
This system combines Smart Money Concepts (SMC), quantitative volume analysis, volatility regime modeling, and momentum confirmation into a unified scoring engine that filters out noise and highlights only the strongest directional opportunities.
Unlike conventional indicators that rely on a single trigger (EMA crosses, RSI oversold, MACD flips), the SMC 4D+ engine evaluates multiple market dimensions simultaneously, allowing it to track the true underlying state of the market before issuing a BUY or SELL signal.
"scalp" için komut dosyalarını ara

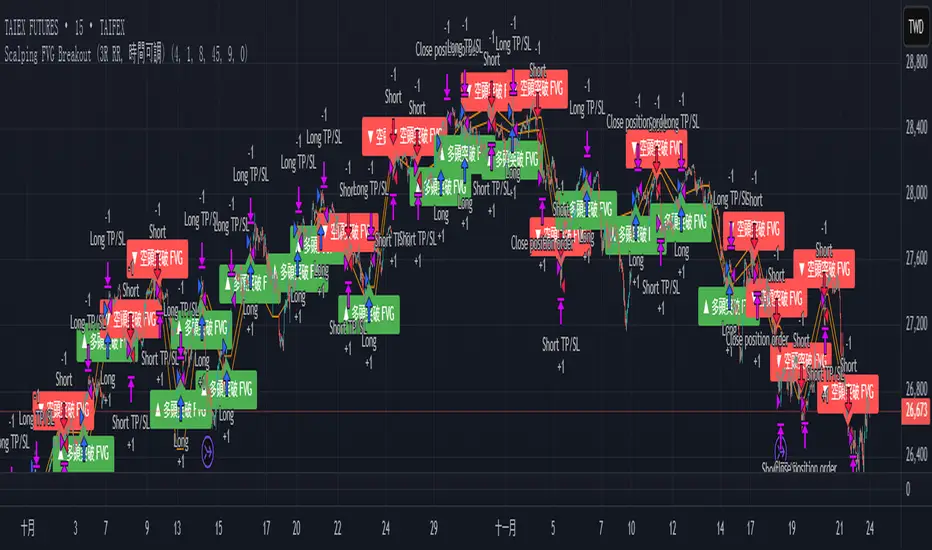
Scalping FVG Breakout (3R RR, 時間可調)Scalping
1. Taipei Open Time (time adjustable)
2. First 15mK Bar
3. Risk 1:3
4. Stop Loss
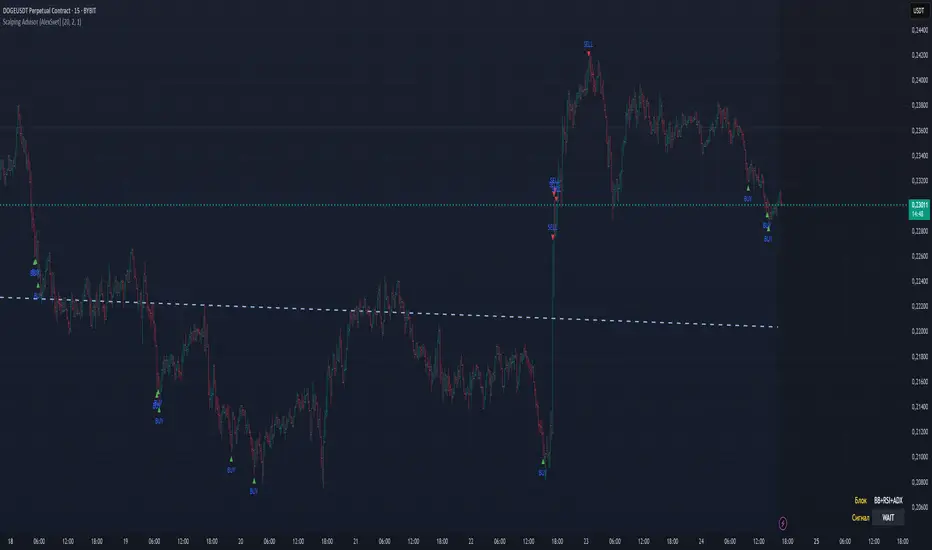
Scalping Advisor [AlexSvet]Scalping script. I added a dashboard table: it shows the BB+RSI+ADX block and the final signal (BUY, SELL, WAIT)
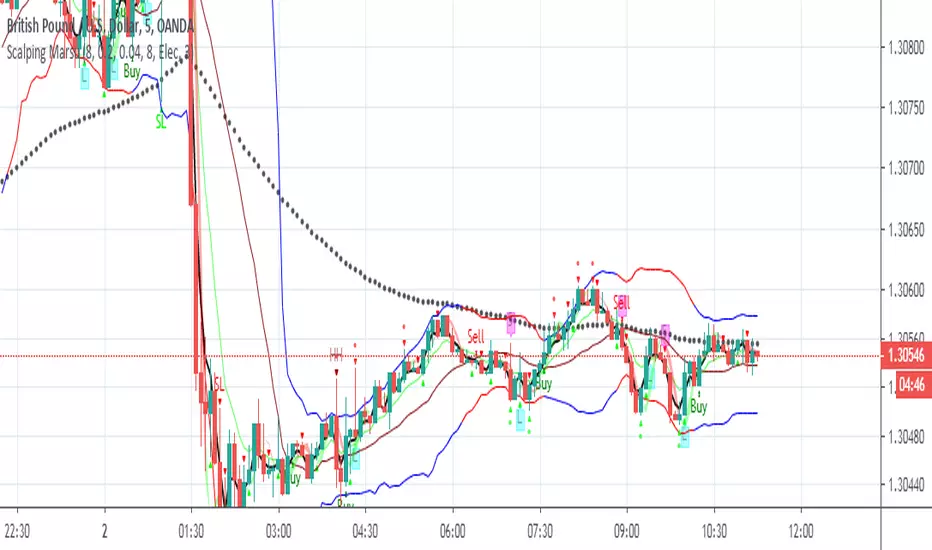
Scalping MarsuScalping Marsu
Trading using Tradingview. Build trading bots for bitcoin , altcoins, forex, stocks and more...
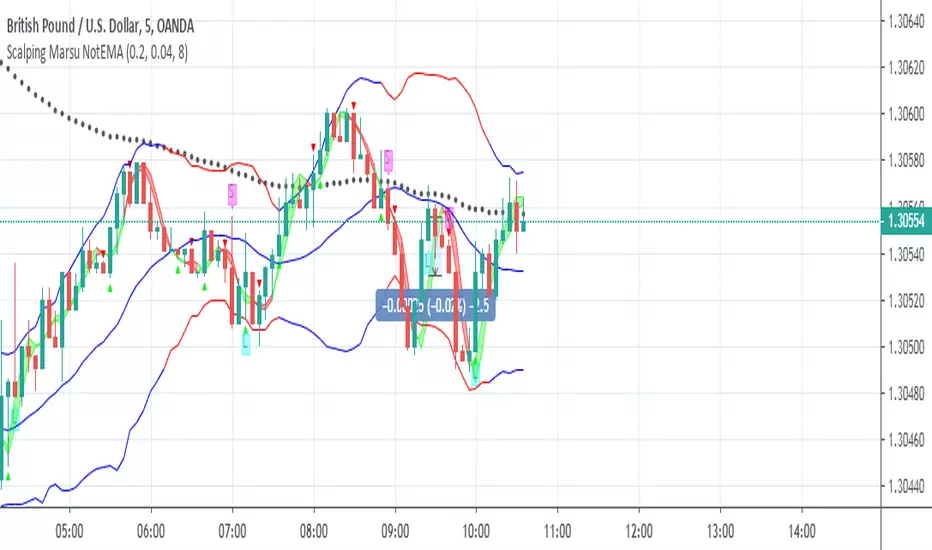
Scalping Marsu NotEMAScalping Marsu NotEMA
Trading using Tradingview. Build trading bots for bitcoin, altcoins, forex, stocks and more...
Scalping of Marsu PilamiScalping of Marsu Pilami
Trading using Tradingview. Build trading bots for bitcoin, altcoins, forex, stocks and more...


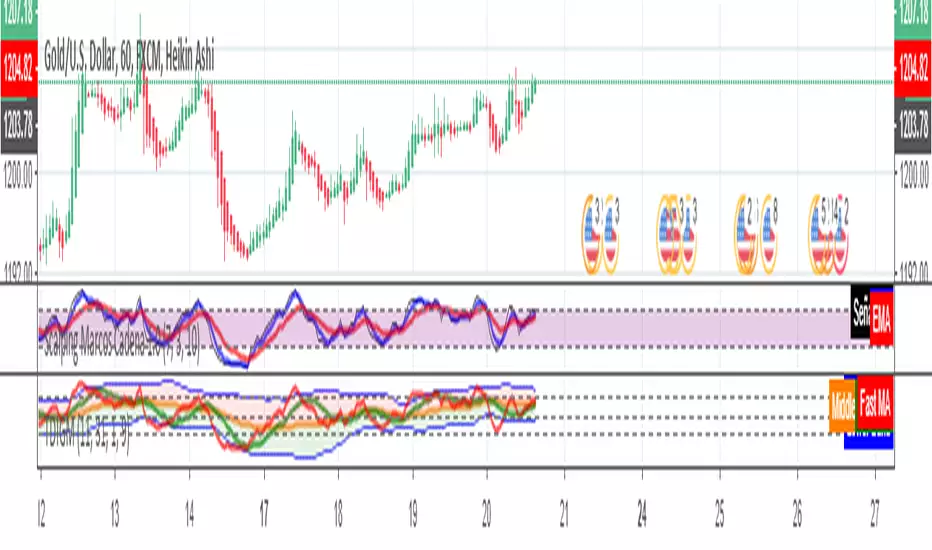
Scalping Marcos Cadena 1.0Scalping Marcos Cadena Crossing of moving averages together identifying within the RSI when it is overbought or oversold
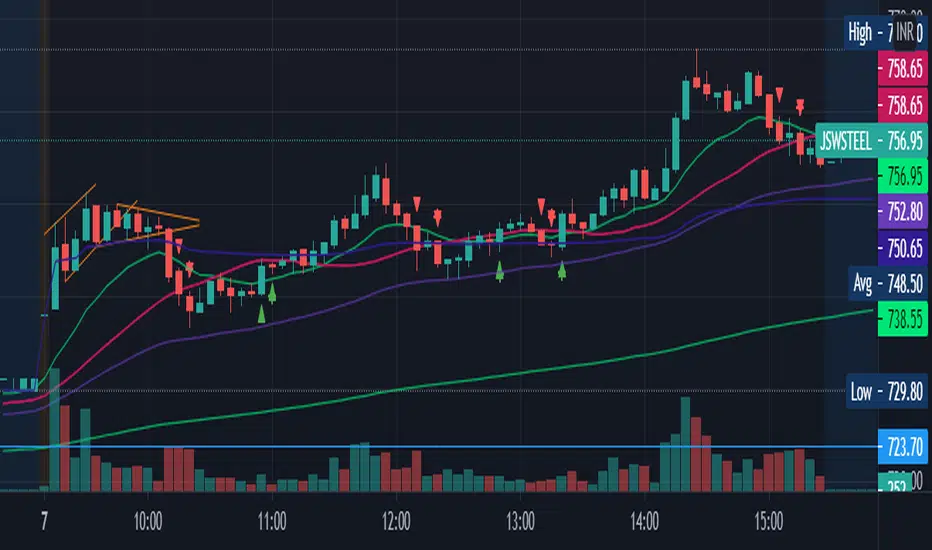
scalping2sahilnarkarThis is the a bit edited to the previous script. As per regulations i have kept this as an open script.
The only Difference to confirm your support resistance levels is an addition of simple moving average 21.
Rules are the Same-
- Trade long when above vwap and 21EMA
- Trade Short when below the VWAP.
EMA21 and EMA50 acts as support where as SMA 21 will show the Trend.
Even though This script is purely based on EMA's, i tend to find the SMA21 as a good Support resistance/support while taking a trade as it avoids the wipsaws while taking an entry.
Please Note-
-This is a scalping Script so book profits and keep stoplosses accordingly.
-When you put this script on the screen, remove everything except EMA9,EMA21,EMA50,EMA200 and the SMA21(keep the arrows and edit the arrows as you want)
-This is not a plug and play script so tune it as you want on the settings.
-Please consider using a VWAP always.
-I have made this script after putting it into many indian stocks you have to tune it as per your stock exchange.
Daily, Weekly, Monthly Separators (ScalpTheTicker)I put together this Daily, Weekly and Monthly separating indictor after I couldn't find one on Tradingview that did what I was looking for.
It is basic but it does the job I needed.
Feel free to use this indicator and hopefully it does what you need.
ScalperThe scalper allows you to choose entries based on ohlc ratios. Default settings are pyramiding and on order fill. Change the tick value to get acceptable closes for stop orders.

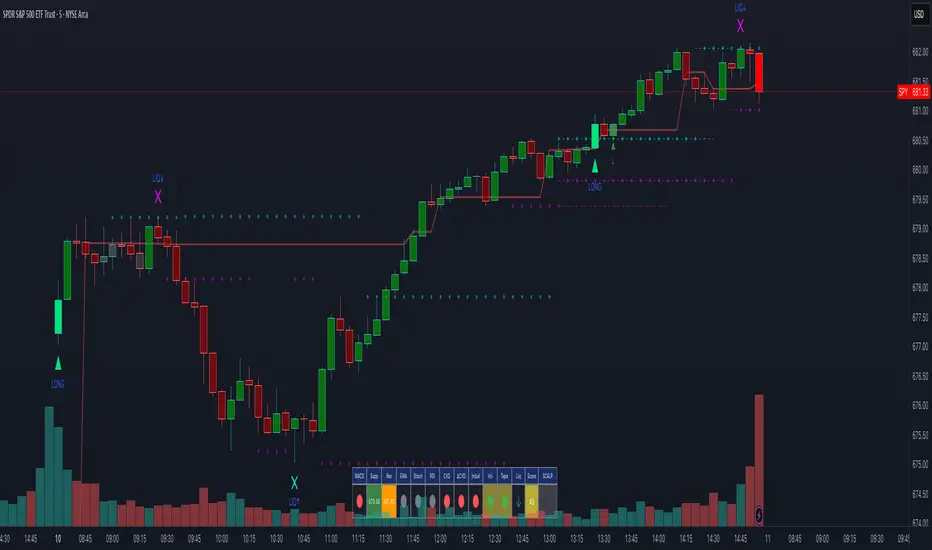
Scalping Dashboard - Volume Candles + Liquidity ZonesScalping Dashboard - Volume Candles + Liquidity Zones
📊 Overview
A comprehensive scalping indicator designed for high-frequency traders on 1-5 minute timeframes. This all-in-one dashboard combines volume analysis, order flow metrics, technical indicators, and institutional liquidity zones to identify high-probability scalping opportunities.
🎯 Key Features
✅ Multi-Timeframe Analysis
Fast MACD (5/13/5) for momentum
Quick EMAs (9/20/50) for trend direction
Rapid Stochastic (5/3/3) for oversold/overbought conditions
Fast RSI (7) for extreme readings
✅ Advanced Order Flow Metrics
CVD (Cumulative Volume Delta): Tracks buy vs sell pressure over time
Delta Momentum: Measures acceleration in buying/selling
Buy/Sell Pressure Ratio: Real-time balance of market forces
Order Flow Imbalance: Detects aggressive buying or selling
Tape Speed: Measures how fast volume is hitting the market
✅ Institutional Liquidity Zones
Buy-Side Liquidity: Areas above price where short stop losses cluster
Sell-Side Liquidity: Areas below price where long stop losses cluster
Liquidity Sweeps: Detects "stop hunts" by institutions before reversals
✅ Volume-Based Candle Coloring
Visual representation of volume intensity
Extreme, High, Normal, and Low volume categories
Fully customizable color schemes
✅ Dynamic Support/Resistance
Volume-weighted price levels
Automatically updates every 3 bars
Shows distance to key levels
📈 Dashboard Indicators Explained
The bottom-left dashboard displays 14 real-time metrics:
▸ MACD (●)
Green = Bullish momentum
Red = Bearish momentum
Gray = Neutral
▸ Supp (Price)
Support level
Green highlight = at support (good for long entry)
▸ Res (Price)
Resistance level
Orange highlight = at resistance (good for short entry)
▸ EMA (●)
Green = Price above EMAs (bullish)
Red = Price below EMAs (bearish)
▸ Stoch (●)
Green = Oversold (<20)
Red = Overbought (>80)
Gray = Neutral
▸ RSI (●)
Green = Oversold (<30)
Red = Overbought (>70)
Gray = Neutral
▸ CVD (●)
Green = Cumulative buying pressure
Red = Cumulative selling pressure
▸ ΔCVD (●)
Green = Increasing buy pressure
Red = Increasing sell pressure
▸ Imbal (●)
Green = Buy imbalance (>2:1 ratio)
Red = Sell imbalance
▸ Vol (●)
Green/Yellow background = Volume surge (>2x average)
▸ Tape (●)
Green/Yellow background = Fast tape (>1.5x speed)
▸ Liq (↑↓●)
↑ = Bullish sweep or near sell-side liquidity
↓ = Bearish sweep or near buy-side liquidity
● = Neutral
▸ Score (#L or #S)
Quality score (0-8) for Long or Short setups
Higher numbers = Better quality trade
▸ SCALP (LONG/SHORT/WAIT)
Primary signal
Bright color = High quality (score ≥5)
Dim color = Decent quality (score =4)
Gray = Wait for better setup
🎨 Candle Color System
Volume-Based Colors
Bright Green/Red: Extreme volume (>2.5x average) - Major moves
Medium Green/Red: High volume (>1.5x average) - Strong activity
Dull Green/Red: Normal volume - Standard market activity
Gray: Low volume (<0.5x average) - Avoid trading
Signal-Based Colors
Lime: Strong Long signal (score ≥5)
Green: Decent Long signal (score =4)
Orange: Strong Short signal (score ≥5)
Red: Decent Short signal (score =4)
Candle Color Modes (adjustable in settings):
Volume Only: Pure volume intensity
Volume + Signals: Signals override volume when present (default)
Signals Only: Only shows entry signals
🔵 Chart Indicators
Support & Resistance Lines
Green Line: Volume-weighted support level
Red Line: Volume-weighted resistance level
Lines update dynamically based on 100-bar volume profile
Liquidity Zones
Cyan Circles/Dashed Lines: Buy-side liquidity (above price)
Where short stop losses cluster
Potential targets for bullish moves
Institutions may push price here before reversing down
Magenta Circles/Dashed Lines: Sell-side liquidity (below price)
Where long stop losses cluster
Potential targets for bearish moves
Institutions may push price here before reversing up
Entry Markers
Large Green Triangle (▲): High quality long entry (score ≥5)
Small Green Triangle (▲): Decent long entry (score =4)
Large Orange Triangle (▼): High quality short entry (score ≥5)
Small Red Triangle (▼): Decent short entry (score =4)
Liquidity Sweep Markers
Cyan X-Cross (below bar): Bullish liquidity sweep - "LIQ↑"
Price swept sell-side liquidity and reversed up
Strong buy signal
Magenta X-Cross (above bar): Bearish liquidity sweep - "LIQ↓"
Price swept buy-side liquidity and reversed down
Strong sell signal
🎯 How to Use This Indicator
For Long Scalps (Buy):
Wait for Dashboard Signal: SCALP = "LONG" with score ≥5
Confirm Multiple Green Dots: Look for EMA, CVD, ΔCVD, Imbal all green
Check Volume: Vol or Tape should show yellow background (surge)
Look for Confluence:
Price at or near Support level (green highlight)
Price near Sell-Side Liquidity (magenta line below)
RSI oversold (green dot)
Large green triangle appears on chart
Best Entry: On a bullish liquidity sweep (cyan X-cross)
For Short Scalps (Sell):
Wait for Dashboard Signal: SCALP = "SHORT" with score ≥5
Confirm Multiple Red Dots: Look for EMA, CVD, ΔCVD, Imbal all red
Check Volume: Vol or Tape should show yellow background (surge)
Look for Confluence:
Price at or near Resistance level (orange highlight)
Price near Buy-Side Liquidity (cyan line above)
RSI overbought (red dot)
Large orange triangle appears on chart
Best Entry: On a bearish liquidity sweep (magenta X-cross)
Three Types of Scalping Setups:
1. Quick Scalp (Fastest - 1-5 minute holds)
MACD or Stochastic crossover + Volume surge
At Support/Resistance level
Score ≥4
2. Momentum Scalp (Ride the wave - 5-15 minute holds)
Strong EMA alignment + CVD slope positive
Order flow imbalance + Fast tape
Volume surge with price structure
Score ≥5
3. Reversal Scalp (Fade extremes - 3-10 minute holds)
Stochastic + RSI extreme readings
At Support/Resistance OR liquidity sweep
CVD momentum reversal
Score ≥6
⚙️ Recommended Settings
Timeframes
Primary: 1-minute, 2-minute, 5-minute
Confirmation: Use 15-minute chart for overall trend direction
Asset Types
Forex pairs (high liquidity)
Crypto (BTC, ETH with high volume)
Futures (ES, NQ)
Major stocks during market hours
Risk Management
Target: 1-3 times your stop loss
Stop Loss: Below nearest liquidity zone for longs, above for shorts
Position Size: Never risk more than 1% per trade
Score ≥5: Take full position size
Score =4: Take half position size or skip
🔧 Customization Options
Input Groups
MACD Settings
Fast Length: 5 (scalping optimized)
Slow Length: 13
Signal Length: 5
EMA Settings
EMA 9, 20, 50 (fast scalping EMAs)
Stochastic Settings
%K Length: 5
%D Smoothing: 3
Smooth: 3
CVD Settings
MA Length: 10 (for CVD smoothing)
RSI Settings
Length: 7 (fast RSI)
Overbought: 70
Oversold: 30
Volume Settings
MA Length: 10
Extreme Multiplier: 2.5x
High Multiplier: 1.5x
Low Multiplier: 0.5x
Liquidity Zone Settings
Lookback Periods: 20
Swing Strength: 3
Show Liquidity Zones: On/Off
Show Liquidity Sweeps: On/Off
Support/Resistance Settings
Volume Lookback: 100 bars (~2 hours on 1-min chart)
Order Flow Settings
Imbalance Threshold: 2.0 (2:1 ratio)
Color Customization
All volume colors customizable
All signal colors customizable
All liquidity colors customizable
📊 Volume Legend (Top Right)
The small table in the top-right corner shows the volume intensity key:
Extreme: >2.5x average volume
High: >1.5x average volume
Normal: 0.5x to 1.5x average volume
Low: <0.5x average volume
🔔 Built-in Alerts
Set up these alerts to never miss a trade:
High Quality Long Scalp: Triggers when entry_long and score ≥5
High Quality Short Scalp: Triggers when entry_short and score ≥5
Bullish Liquidity Sweep: Triggers when sell-side liquidity is swept
Bearish Liquidity Sweep: Triggers when buy-side liquidity is swept
To set up: Right-click chart → Add Alert → Select condition → Create
💡 Pro Tips
Understanding Liquidity Zones
Buy-Side Liquidity = Where shorts have their stops = Price tends to wick up here
Sell-Side Liquidity = Where longs have their stops = Price tends to wick down here
Liquidity Sweep = Institution triggers stops, absorbs liquidity, then reverses
Best trades = Enter AFTER the sweep when price reverses back
Reading the Dashboard
All Green Dots + Yellow Volume = Strong Long Setup
All Red Dots + Yellow Volume = Strong Short Setup
Mixed Colors = Choppy/Neutral = Wait
Score 6+ = Highest probability trades
Score 3 or less = Avoid
Confluence is Key
Never trade on a single indicator. Wait for:
Dashboard score ≥5
Volume surge (yellow background)
At support/resistance OR liquidity zone
CVD and momentum aligned
Price structure confirmation (triangle marker)
Avoid These Situations
❌ Low volume periods (gray candles)
❌ Dashboard shows "WAIT"
❌ Score below 4
❌ No volume surge during entry
❌ Trading against higher timeframe trend
Best Trading Sessions
Forex: London open (3-5 AM EST), NY open (8-10 AM EST)
Crypto: Works 24/7, best during high volume periods
Stocks: First hour (9:30-10:30 AM EST), last hour (3-4 PM EST)
Futures: US session open (9:30 AM EST)
🎓 Understanding the Scoring System
The indicator calculates a quality score (0-8) for both long and short setups:
+1 point for each:
EMA bias aligned (price above/below EMA structure)
CVD momentum bias aligned (buying/selling pressure)
Buy/Sell pressure ratio aligned (>1.5x or <0.67x)
Volume strength (surge detected)
Order flow imbalance (>2:1 ratio)
Tape speed (>1.3x average)
Price structure (higher highs or lower lows)
Liquidity bias (sweep detected)
Score Interpretation:
7-8: Extremely high probability (rare, take immediately)
6: Very high probability (excellent trade)
5: High probability (good trade)
4: Decent probability (acceptable with tight stop)
3 or less: Low probability (wait for better setup)
📋 Quick Reference Card
Entry Checklist
Dashboard shows LONG or SHORT
Score is ≥5
Multiple indicators aligned (green or red dots)
Volume surge present (yellow background)
At support/resistance or liquidity zone
Triangle marker appeared on chart
Risk:Reward ratio is at least 1:2
Exit Strategy
Take Profit: At opposite liquidity zone or resistance/support
Stop Loss: Below sell-side liquidity (longs) or above buy-side liquidity (shorts)
Trail Stop: Move to breakeven after 1:1 risk:reward achieved
⚠️ Important Notes
This is NOT a holy grail: No indicator is 100% accurate. Always use proper risk management.
Backtest first: Paper trade or backtest on your specific instrument before using real money.
Market conditions matter: This indicator works best in trending or volatile markets, not in tight consolidation.
Combine with price action: Use the indicator as confluence with your own price action reading.
Adjust for your instrument: Different assets may require tweaking the sensitivity settings.
Lower timeframes = More noise: 1-minute charts have more false signals than 5-minute charts.
🔄 Version History
v1.0 - Initial release
Multi-indicator dashboard
Volume-based candle coloring
Support/Resistance detection
Entry signal generation
v2.0 - Current version
Added liquidity zone detection
Added liquidity sweep identification
Enhanced scoring system (now 0-8)
Added liquidity bias to entries
New alerts for liquidity sweeps
Improved dashboard with Liq indicator
📞 Support & Feedback
If you find this indicator helpful, please:
⭐ Give it a boost
💬 Share your results in the comments
🐛 Report any bugs or issues
💡 Suggest improvements
Disclaimer: This indicator is for educational purposes only. Trading involves significant risk. Past performance does not guarantee future results. Always trade responsibly and never risk more than you can afford to lose.
🏆 Credits
Created for serious scalpers who want institutional-level insights on retail charts. Combines order flow analysis, volume profiling, and liquidity mapping into one comprehensive tool.
Happy Scalping! 🚀📈
Scalping Market Strctures[SumitQuants]🇮🇳🔥 **Scalping Market Structures
**
Built for Scalper and Market Structure Breakout Trader
A clean, lightning-fast market structure engine designed for Indian scalpers who need precise Swing Points, BOS/CHoCH, and True Breakout Signals — without clutter, lag, or noise.
Perfect for 1-min, 3-min, 5-min scalping on indices & stocks.
🧠 Why This Indicator Stands Out
Most structure tools repaint or clutter your chart.
This one is simple, sharp, and brutally effective.
It reveals:
➡ True swing highs & lows
➡ Where structure flips (BOS/CHoCH)
➡ Counter-trend reversals
➡ Buy/Sell pressure points
➡ 0.5 retracement zones for sniper entries
It reads the chart the way scalpers need:
Fast. Clean. Accurate.
🔥 What’s Inside (Complete Feature Stack)
🎯 1. Automatic Swing High/Low Detection (Scalper-Optimized)
Instant swing labeling that adapts to your timeframe:
✔ HH (Higher High)
✔ LH (Lower High)
✔ HL (Higher Low)
✔ LL (Lower Low)
Buy / Sell swing labels appear automatically:
🟥 “Sell ↓” on bearish swing highs
🟩 “Buy ↑” on bullish swing lows
Perfect for reading trend direction in seconds.
⚡ 2. Real BOS & CHoCH Detection
Clean breakout logic that respects your choice:
✔ BOS via Candle Close
✔ BOS via Wick Break
Plus:
✨ CHoCH mode (first counter-trend BOS automatically renamed to CHoCH)
✨ Breakout lines drawn with your color & style
✨ Mid-point BOS labels for perfect visibility
Spot reversals & trend flips with zero confusion.
📏 3. The 0.5 Retracement Tool (Smart Entry Zone)
Beautiful mid-retracement lines drawn ONLY when trend conditions match:
🔹 Appears between recent swing high → low
🔹 Shows ideal 50% pullback zone
🔹 Perfect for sniper re-entries during expansions
Enable/disable anytime. Fully customizable.
🔍 4. Trend Context in One Glance
The script tracks:
✔ Last swing direction
✔ Whether the market is making HH/LH or HL/LL
✔ Bias shift moments
✔ When highs or lows get invalidated
This gives you real structure awareness — the foundation of SMC scalping.
🔔 5. Clean Breakout Visualization
Whenever a swing high or swing low gets taken out:
🔥 A BOS line is drawn
🔥 A BOS/CHoCH label appears
🔥 The previous swing is deactivated
🔥 Trend context is updated instantly
No repaint. No lag. No ambiguity.
🧽 6. Ultra-Clean UI
✔ Minimalist labels
✔ Light/dark-mode friendly
✔ Zero clutter
✔ Focus on price, not drawings
A scalper’s dream: fast, clean, actionable.
🧪 Who Is This Built For?
✔ NIFTY/BANKNIFTY Scalpers
✔ Price Action Traders
✔ SMC Traders
✔ Smart Money Reversal Traders
✔ Anyone who trades 1m–15m charts
✔ Traders who want a simple but powerful structure tool
⚡ Why Indian Traders Love It
🔸 Calls out structure shifts instantly
🔸 Helps spot reversals BEFORE the move starts
🔸 Makes scalping simple & visual
🔸 Eliminates noisy indicators
🔸 Gives pure price-action clarity
🔸 Works on every timeframe & instrument
This is not just a structure tool —
It’s your scalping radar.
🛒 Get Full Access
This indicator is available inside the Courses Section on the official website.
👉 Purchase & Access:
www.ironmindtrader.com
Inside the course:
🔧 Installation Steps
📘 How to Use the Structure System
🎯 Scalping Entry Logic
🔄 Updates Included

Scalping PullBack by AbhiSetup and hints:
When price is above the PAC(blue bars) we are only looking to buy as price comes back to the PAC, when price is below the PAC(red bars), we are only looking to sell when price comes back to the PAC
What we’re looking for when price comes back into the PAC we draw mini Trendlines (TL) utilising the Fractals and HH/LL points to guide your TL drawing.
Now look for the trend to pull back and break the drawn mini TL. That's is where we can place the scalp trade.
So we are looking for continuation signals in terms of a strong, momentum driven pullbacks of the PAC EMA(34).
The other EMAs are there to check for other Pullbacks when PAC EMA (34) is broken.
Other than the "SweetSpot Gold RN" indicator, you should not need any other indicator to scalp for pullbacks.
If you want to trade shallower Pullbacks for quicker scalps, try reducing the PAC and EMA combination lengths for example:
- 21 PAC and 55, 144, 377 for fast, medium, slow EMAs
- 13 PAC and 34, 89, 233 for fast, medium, slow EMAs
Each alert should be evaluated on it's own merits, the alerts are designed to highlight possible scalping trades from Pullback recoveries around the PAC.
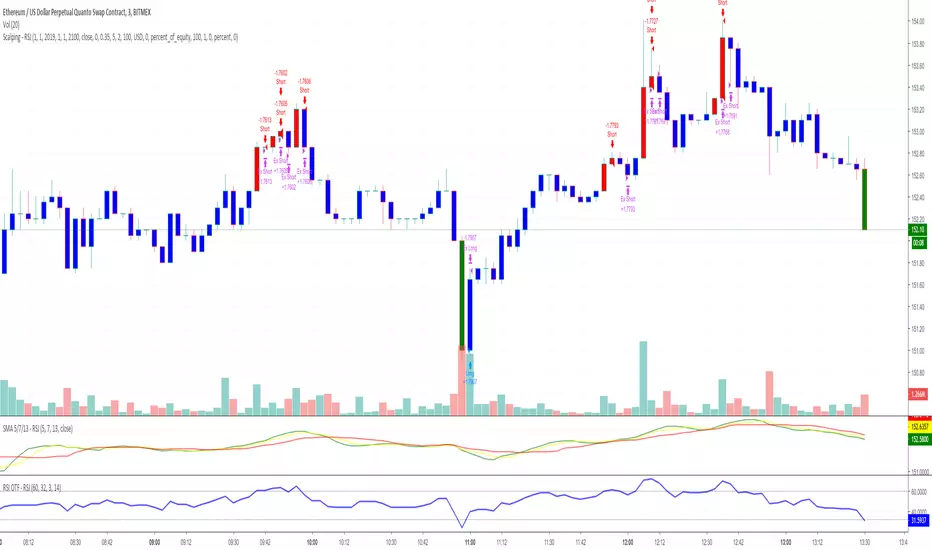
Scalp Strategy by Trade Journey📘 Trading Strategy: "Delta Flow Scalper"
Author: @Trad_journey
Type: Scalping / Intraday
Timeframes:
- Context: 1H
- Entry Points: 15m
---
🎯 Core Idea
We use a powerful tool — the Delta-RSI Oscillator (D-RSI), which calculates the derivative of RSI using polynomial regression. This oscillator doesn't just show the strength of price movement but reveals how that strength changes over time.
By combining this with order flow analysis on the 1H timeframe, we can spot reversals and momentum bursts within a prevailing trend, where the D-RSI is most accurate.
---
🔍 Strategy Logic
1. Context (1H)
Before entering a trade on the 15m chart, we determine:
- The trend on 1H using candle structure, levels, EMAs, volume, VSA, and other methods.
- Example: If 1H shows a series of higher highs/lows and rising volume — it indicates an uptrend.
2. Entry Signals (15m)
Entry is based on the D-RSI, configured with manually optimized settings:
- RSI Length: 14
- Polynomial Order: 2
- Window Length: 14
- Signal EMA: 7
- RMSE Filtering: Enabled, e.g., with a 10% threshold
Entry Conditions (any of the following):
- Zero-Crossing: Oscillator crosses above zero (long) or below zero (short)
- Signal Line Cross: D-RSI crosses the signal EMA
- Direction Change: Oscillator was below zero and starts rising (long), or vice versa
3. Trade Filter
To improve accuracy:
- Polynomial Approximation Error Filter (RMSE) is used — this eliminates noisy signals.
- Ideally, confirm entries with a candlestick pattern or key level as well.
---
📈 Example of Entry Logic
1. On 1H: Clear uptrend, candles with long lower wicks, volume increasing
2. On 15m: D-RSI was below zero, sharply started rising and crossed the signal line from below
3. RMSE < 10% → signal confirmed
4. Enter long, place stop below local low + spread
5. Exit:
- On opposite D-RSI signal
- Or at a take profit (e.g., 1.5R or a key level)
---
⚙️ Settings
()
---
📊 Why It Works
- D-RSI captures momentum shifts and trend acceleration — these often occur before price changes.
- RMSE filtering removes false signals during chop or weak movement.
- Using a higher timeframe gives directional context — entries are made in the trend's direction, drastically increasing win probability.
---
🔔 Recommendations
- Don’t use without higher timeframe context — countertrend signals can be unprofitable.
- Best entries are after small pullbacks within a trend.
- You can add an ATR/volatility filter — to avoid signals in tight ranges.
---
✅ Conclusion
Delta Flow Scalper is a plug-and-play strategy for traders looking for precise intraday entries within larger moves. It's great for those wanting to reduce noise and trade smartly with momentum.
Try it on demo, tweak it to fit your style — and go for it!

Scalp Master V1.1This version has added support and resistance to help traders identify the best entry and exit points.
Also, we included a linear regression band to identify the last period's trend, the prices would normally swing between the upper and lower dotted white line and it gives a good starting point for traders to identify possible bounces or rejection moments of the price.

Scalping Line Strategy📌 Scalping Line Strategy – A Precision Crossover System
🔎 Overview
The Scalping Line Strategy is a short-term trading system built around the concept of momentum-driven crossovers between a smoothed moving average filter and a fast signal line. It is designed for scalpers and intraday traders who seek clear entry signals, minimal lag, and adaptive filtering to fit volatile market conditions.
At its core, the strategy uses a custom signal line ("Scalping Line"), which is derived from the difference between a double-smoothed moving average and a shorter-period signal line. Trade entries are triggered when this Scalping Line crosses above or below zero, providing a clean and rules-based framework for both long and short setups.
⚙️ Core Logic
Main Trend Filter – A double-smoothed moving average is calculated over a configurable period (default 100). This reduces noise and provides a more robust backbone for scalping signals.
Percent-Based Filter – To avoid false signals, a customizable percentage filter adjusts how closely the system “respects” price deviations from the moving average. This helps filter out insignificant fluctuations.
Signal Line – A shorter-period simple moving average (default 7) provides faster responsiveness to recent price action.
Scalping Line (SLI) – Calculated as the difference between the fast signal line and the smoothed moving average. When the SLI crosses zero, it signals a potential momentum shift.
SLI > 0 → Momentum bias is bullish.
SLI < 0 → Momentum bias is bearish.
🎯 Trade Direction & Flexibility
Trade Direction Control:
Choose between Long Only, Short Only, or Both to tailor the system to your trading style.
Signal Flip Option:
By default, long entries occur when the SLI crosses below zero, and shorts when it crosses above zero. This orientation can be flipped, allowing for alternative interpretations of the signals depending on how you want to capture momentum in your market.
🕒 Time Window Filtering
For intraday traders, a time filter can be enabled to restrict signals to specific trading sessions (e.g., 9 AM – 4 PM EST). This is particularly useful when trading assets such as equities or futures that have strong intraday volatility windows.
📈 Visuals & Clarity
Scalping Line Plot: Displayed as a dynamic oscillator around a zero baseline.
Histogram Fill: Green when above zero (bullish bias), red when below zero (bearish bias).
Signal Markers: Clear arrows mark long and short entries at crossover points.
Zero Line Reference: A flat gray line at zero assists in visually gauging momentum shifts.
🚀 Strategy Execution
Long Entry: Triggered when SLI crosses below zero (or above zero if flip is enabled) within allowed session hours.
Short Entry: Triggered when SLI crosses above zero (or below zero if flip is enabled) within allowed session hours.
Built-in Signal Cancels: Pending entries are canceled if conditions are no longer valid, ensuring no stale trades remain active.
✅ Best Use Cases
Markets: Works across equities, forex, crypto, and futures with sufficient intraday volatility.
Timeframes: Most effective on 1m to 15m charts for scalping setups, but adaptable to higher frames for swing trading.
Style: Traders who appreciate simple, rules-based momentum crossovers will find this system easy to follow and highly adaptable.
⚠️ Risk Management Note
This strategy is strictly an entry signal framework. Position sizing, stop-loss, and take-profit rules must be overlaid based on your risk management style. Always validate results with backtesting and forward testing before applying to live trading accounts.
📜 Final Thoughts
The Scalping Line Strategy offers a refined, easy-to-interpret approach to intraday trading. By combining smoothed moving averages, adaptive filtering, and flexible signal options, it helps traders identify short-term momentum shifts with clarity and confidence, making it a highly configurable tool for scalping-focused strategies.

Scalp Recent High/Low (Stable v5 r4)UMA Scalp Levels(ウマ・スキャル・レベルズ)
UMA Scalp Levels
Automatically detects recent swing highs and lows —
the “psychological levels” most watched by traders —
and alerts you when a valid breakout occurs.
🔹 Detects swing highs/lows automatically (non-repainting)
🔹 Confirm breakouts by close or wick (configurable)
🔹 Filters small fakeouts using ATR / % thresholds
🔹 Supports breakout alerts (up / down / retest)
🔹 MTF compatible — e.g., show 15m levels on 5m chart
Ideal for scalpers and day traders who want to catch momentum
immediately after a breakout of key levels.
直近で“市場が意識している高値・安値ライン”を自動で検出し、
ブレイク時にサインとアラートを出す、順張り型のスキャルピング指標。
🔹 スイング高値・安値を自動抽出(リペイント耐性あり)
🔹 終値 or ヒゲ抜けでブレイク判定(選択可能)
🔹 ATRや%幅でノイズを除外(小さな抜けをフィルタリング)
🔹 アラート対応(上抜け/下抜け/リテスト検知)
🔹 MTF対応(例:15分足ラインを5分足チャートに表示)
短期トレードで最も意識される「節目の抜け」を視覚化し、
勢いに乗る順張りトレードの精度を高めます。

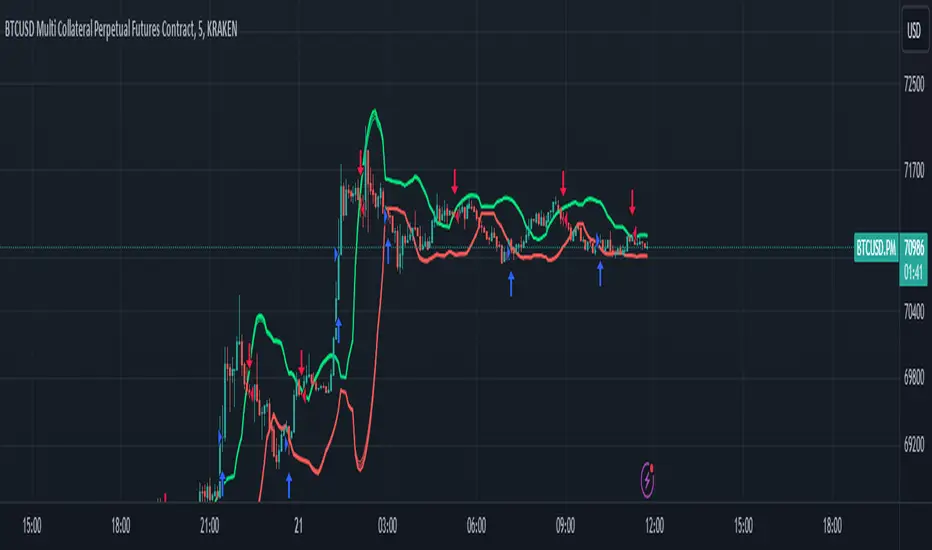
[SCALPING] L3 Banker Flow (1m Optimized)What’s improved for 1-min scalping:
Shorter lengths for trend and range detection (9, 5, 3, 2).
Faster EMA and weighted averages for quicker signal response.
Entry signal conditions are slightly relaxed (bull_bear_line < 30) for faster entry in micro-trends.
Maintains the same visuals: yellow/green/white/red/blue candles for easy reading.

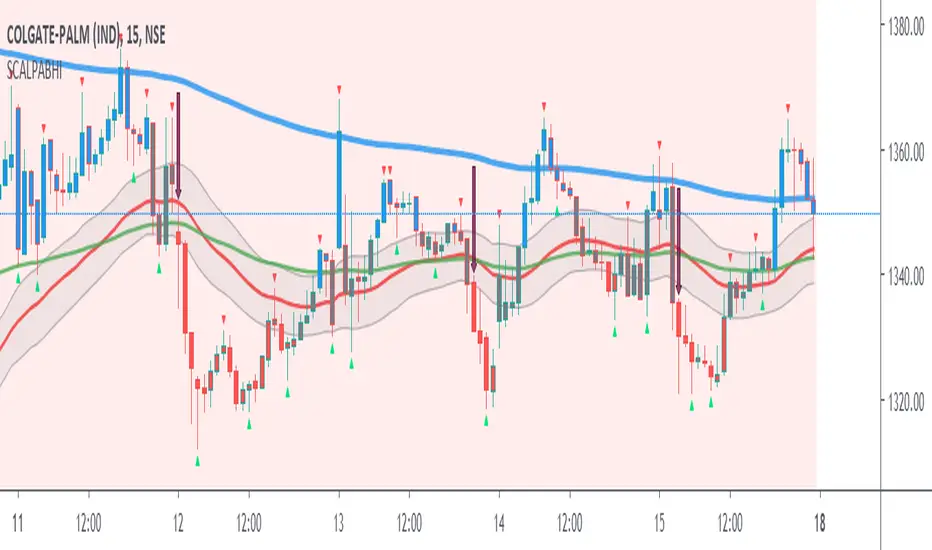
Scalping, Swing Pro: Urban Towers + Bollinger(0.5)+ WMA by KidevThis indicator combines narrow Bollinger Bands (σ = 0.5) with a Weighted Moving Average (WMA-96) to provide traders with a reliable framework for identifying both short-term scalps and medium-term swing setups.
Bollinger Bands (0.5σ):
Traditional Bollinger Bands at 2σ cover ~95% of price movement, while 0.5σ bands narrow the focus to ~50% of price activity. This tighter structure makes them ideal for detecting volatility contractions, consolidations, and early breakout signals.
WMA-96 as Trend Reference:
The 96-period WMA acts as a slower, more stable directional guide. Unlike shorter WMAs, this longer setting filters noise and serves as a reference line for the dominant trend. Traders can use it as an anchor for intraday or swing positions.
Scalping & Swing Benefits:
Price holding above the WMA-96 while staying near the upper 0.5σ band often signals strength.
Contractions (squeezes) in the 0.5σ band followed by expansion frequently mark breakout zones.
Pullbacks toward the WMA-96 combined with band signals can act as re-entry or risk-defined trade areas.
This script provides a balanced view of momentum and stability — the 0.5σ bands reveal short-term volatility shifts, while the WMA-96 grounds the trader in the prevailing trend.

Scalper ProCreated by 77
version 0.9 (Pre-release version)
Overview
The Scalper Pro Algo is a specialized day trading indicator optimized for the various timeframe, tailored for both stock and cryptocurrency markets. It delivers precise buy and sell signals, highlights dynamic overbought and oversold zones, and flags potential reversal points to support active traders.
At its core, the indicator blends a Kalman-filtered Super trend algorithm with VWMA (Volume-Weighted Moving Average) bands. This fusion enables trend-following and mean-reversion strategies by identifying high-probability entry and exit points. The Kalman filtering helps reduce market noise and minimize false signals, offering traders clearer, more dependable guidance for scalping and short-term trades.
