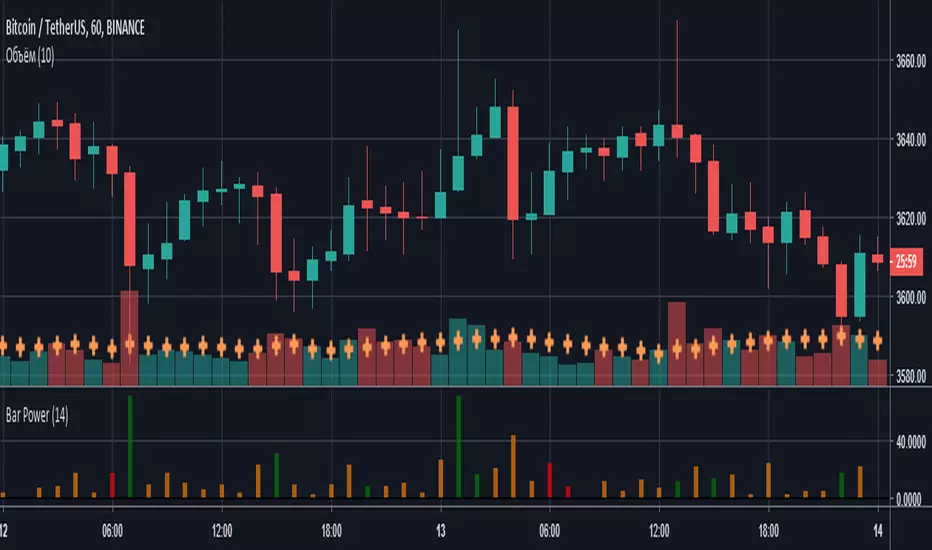
Bar PowerВысота столбцов характеризует силу (то, на сколько быки/медведи были активнее) сформированной свечи, а цвет - количество затраченной на это энергии (объем).
- Красный - маленький объем;
- Оранжевый - средний объем;
- Зеленый - высокий объем.
"bar" için komut dosyalarını ara
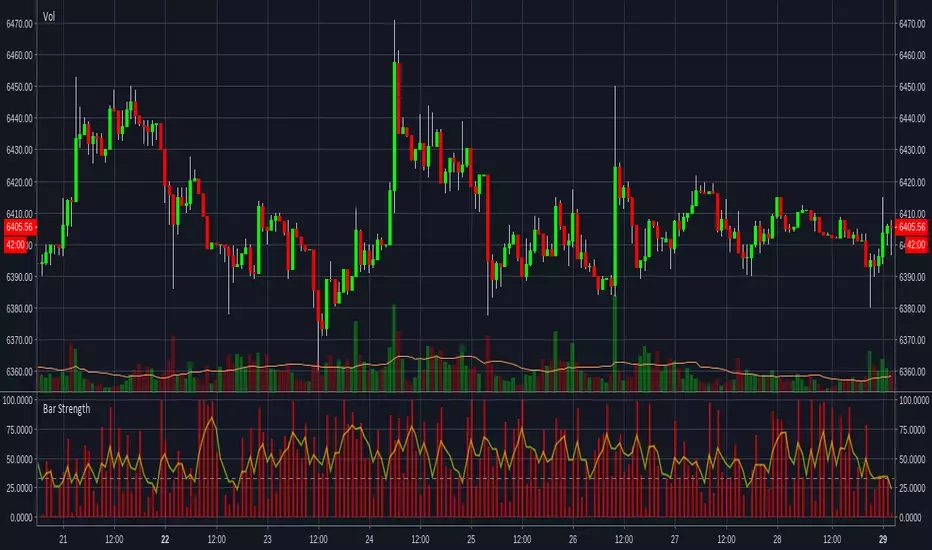
Bar Strength IndicatorIndicator to measure the size of the candle body against the whole candle including the wicks. More information can be found here www.fxstreet.com
This indidactor is based on Marco Mayers article. All credits go to him.

Bars Since EMA OverlayCounts number of bars since an EMA Touch or an EMA cross with close and shades the area when a threshold is exceeded. Currently supported for 3 thresholds.

Bar Close Audio AlertAdd script to chart
Create Alert
Condition: Close/Greater Than/Value/0.0
Frequency: Once on Bar Close
Alert Action: Play Sound
Hide close on chart in Objects Tree if preferred.
Many thanks to tranzium for creating code.

Alligator + Fractals + Divergent & Squat Bars + Signal AlertsThe indicator includes Williams Alligator, Williams Fractals, Divergent Bars, Market Facilitation Index, Highest and Lowest Bars, maximum and minimum peak of Awesome Oscillator, and signal alerts based on Bill Williams' Profitunity strategy.
MFI and Awesome Oscillator
According to the Market Facilitation Index Oscillator, the Squat bar is colored blue, all other bars are colored according to the Awesome Oscillator color, except for the Fake bars, colored with a lighter AO color. In the indicator settings, you can enable the display of "Green" bars (in the "Green Bars > Show" field). In the indicator style settings, you can disable changing the color of bars in accordance with the AO color (in the "AO bars" field), including changing the color for Fake bars (in the "Fake AO bars" field).
MFI is calculated using the formula: (high - low) / volume.
A Squat bar means that, compared to the previous bar, its MFI has decreased and at the same time its volume has increased, i.e. MFI < previous bar and volume > previous bar. A sign of a possible price reversal, so this is a particularly important signal.
A Fake bar is the opposite of a Squat bar and means that, compared to the previous bar, its MFI has increased and at the same time its volume has decreased, i.e. MFI > previous bar and volume < previous bar.
A "Green" bar means that, compared to the previous bar, its MFI has increased and at the same time its volume has increased, i.e. MFI > previous bar and volume > previous bar. A sign of trend continuation. But a more significant trend confirmation or warning of a possible reversal is the Awesome Oscillator, which measures market momentum by calculating the difference between the 5 Period and 34 Period Simple Moving Averages (SMA 5 - SMA 34) based on the midpoints of the bars (hl2). Therefore, by default, the "Green" bars and their opposite "Fade" bars are colored according to the color of the Awesome Oscillator.
According to Bill Williams' Profitunity strategy, using the Awesome Oscillator, the third Elliott wave is determined by the maximum peak of AO in the range from 100 to 140 bars. The presence of divergence between the maximum AO peak and the subsequent lower AO peak in this interval also warns of a possible correction, especially if the AO crosses the zero line between these AO peaks. Therefore, the chart additionally displays the prices of the highest and lowest bars, as well as the maximum or minimum peak of AO in the interval of 140 bars from the last bar. In the indicator settings, you can hide labels, lines, change the number of bars and any parameters for the AO indicator - method (SMA, Smoothed SMA, EMA and others), length, source (open, high, low, close, hl2 and others).
Bullish Divergent bar
🟢 A buy signal (Long) is a Bullish Divergent bar with a green circle displayed above it if such a bar simultaneously meets all of the following conditions:
The high of the bar is below all lines of the Alligator indicator.
The closing price of the bar is above its middle, i.e. close > (high + low) / 2.
The low of the bar is below the low of 2 previous bars or below the low of one previous bar, and the low of the second previous bar is a lower fractal (▼). By default, Divergent bars are not displayed, the low of which is lower than the low of only one previous bar and the low of the 2nd previous bar is not a lower fractal (▼), but you can enable the display of any Divergent bars in the indicator settings (by setting the value "no" in the " field Divergent Bars > Filtration").
The following conditions strengthen the Bullish Divergent bar signal:
The opening price of the bar, as well as the closing price, is higher than its middle, i.e. Open > (high + low) / 2.
The high of the bar is below all lines of the open Alligator indicator, i.e. the green line (Lips) is below the red line (Teeth) and the red line is below the blue line (Jaw). In this case, the color of the circle above the Bullish Divergent bar is dark green.
Squat Divergent bar.
The bar following the Bullish Divergent bar corresponds to the green color of the Awesome Oscillator.
Divergence on Awesome Oscillator.
Formation of the lower fractal (▼), in which the low of the Divergent bar is the peak of the fractal.
Bearish Divergent bar
🔴 A signal to sell (Short) is a Bearish Divergent bar under which a red circle is displayed if such a bar simultaneously meets all the following conditions:
The low of the bar is above all lines of the Alligator indicator.
The closing price of the bar is below its middle, i.e. close < (high + low) / 2.
The high of the bar is higher than the high of 2 previous bars or higher than the high of one previous bar, and the high of the second previous bar is an upper fractal (▲). By default, Divergent bars are not displayed, the high of which is higher than the high of only one previous bar and the high of the 2nd previous bar is not an upper fractal (▲), but you can enable the display of any Divergent bars in the indicator settings (by setting the value "no" in the " field Divergent Bars > Filtration").
The following conditions strengthen the Bearish Divergent bar signal:
The opening price of the bar, as well as the closing price, is below its middle, i.e. open < (high + low) / 2.
The low of the bar is above all lines of the open Alligator indicator, i.e. the green line (Lips) is above the red line (Teeth) and the red line is above the blue line (Jaw). In this case, the color of the circle under the Bearish Divergent bar is dark red.
Squat Divergent bar.
The bar following the Bearish Divergent bar corresponds to the red color of the Awesome Oscillator.
Divergence on Awesome Oscillator.
Formation of the upper fractal (▲), in which the high of the Divergent bar is the peak of the fractal.
Alligator lines crossing
Bars crossing the green line (Lips) of the open Alligator indicator is the first warning of a possible correction (price rollback) if one of the following conditions is met:
If the bar closed below the Lips line, which is above the Teeth line, and the Teeth line is above the Jaw line, while the closing price of the previous bar is above the Lips line.
If the bar closed above the Lips line, which is below the Teeth line, and the Teeth line is below the Jaw line, while the closing price of the previous bar is below the Lips line.
The intersection of all open Alligator lines by bars is a sign of a deep correction and a warning of a possible trend change.
Frequent intersection of Alligator lines with each other is a sign of a sideways trend (flat).
Signal Alerts
To receive notifications about signals when creating an alert, you must select the condition "Any alert() function is call", in which case notifications will arrive in the following format:
D — timeframe, for example: D, 4H, 15m.
🟢 BDB⎾ - a signal for a Bullish Divergent bar to buy (Long), triggers once after the bar closes and includes additional signals:
/// — if Alligator is open.
⏉ — if the opening price of the bar, as well as the closing price, is above its middle.
+ Squat 🔷 - Squat bar or + Green ↑ - "Green" bar or + Fake ↓ - Fake bar.
+ AO 🟩 - if after the Divergent bar closes, the oscillator color change for the next bar corresponds the green color of the Awesome Oscillator. ┴/┬ — AO above/below the zero line. ∇ — if there is divergence on AO in the interval of 140 bars from the last bar.
🔴 BDB⎿ - a signal for a Bearish Divergent bar to sell (Short), triggers once after the bar closes and includes additional signals:
/// — if Alligator is open.
⏊ — if the opening price of the bar, as well as the closing price, is below its middle.
+ Squat 🔷 - Squat bar or + Green ↑ - "Green" bar or + Fake ↓ - Fake bar.
+ AO 🟥 - if after the Divergent bar closes, the oscillator color change for the next bar corresponds to the red color of the Awesome Oscillator. ┴/┬ — AO above/below the zero line. ∇ — if there is divergence on AO in the interval of 140 bars from the last bar.
Alert for bars crossing the green line (Lips) of the open Alligator indicator (can be disabled in the indicator settings in the "Alligator > Enable crossing lips alerts" field):
🔴 Crossing Lips ↓ - if the bar closed below the Lips line, which is above than the other lines, while the closing price of the previous bar is above the Lips line.
🟢 Crossing Lips ↑ - if the bar closed above the Lips line, which is below the other lines, while the closing price of the previous bar is below the Lips line.
The fractal signal is triggered after the second bar closes, completing the formation of the fractal, if alerts about fractals are enabled in the indicator settings (the "Fractals > Enable alerts" field):
🟢 Fractal ▲ - upper (Bearish) fractal.
🔴 Fractal ▼ — lower (Bullish) fractal.
⚪️ Fractal ▲/▼ - both upper and lower fractal.
↳ (H=high - L=low) = difference.
If you redirect notifications to a webhook URL, for example, to a Telegram bot, then you need to set the notification template for the webhook in the indicator settings in the "Webhook > Message" field (contains a tooltip with an example), in which you just need to specify the text {{message}}, which will be automatically replaced with the alert text with a ticker and a link to TradingView.
‼️ A signal is not a call to action, but only a reason to analyze the chart to make a decision based on the rules of your strategy.
***
Индикатор включает в себя Williams Alligator, Williams Fractals, Дивергентные бары, Market Facilitation Index, самый высокий и самый низкий бары, максимальный и минимальный пик Awesome Oscillator, а также оповещения о сигналах на основе стратегии Profitunity Билла Вильямса.
MFI и Awesome Oscillator
В соответствии с осциллятором Market Facilitation Index Приседающий бар окрашен в синий цвет, все остальные бары окрашены в соответствии с цветом Awesome Oscillator, кроме Фальшивых баров, которые окрашены более светлым цветом AO. В настройках индикатора вы можете включить отображение "Зеленых" баров (в поле "Green Bars > Show"). В настройках стиля индикатора вы можете выключить изменение цвета баров в соответствии с цветом AO (в поле "AO bars"), в том числе изменить цвет для Фальшивых баров (в поле "Fake AO bars").
MFI рассчитывается по формуле: (high - low) / volume.
Приседающий бар означает, что по сравнению с предыдущим баром его MFI снизился и в тоже время вырос его объем, т.е. MFI < предыдущего бара и объем > предыдущего бара. Признак возможного разворота цены, поэтому это особенно важный сигнал.
Фальшивый бар является противоположностью Приседающему бару и означает, что по сравнению с предыдущим баром его MFI увеличился и в тоже время снизился его объем, т.е. MFI > предыдущего бара и объем < предыдущего бара.
"Зеленый" бар означает, что по сравнению с предыдущим баром его MFI увеличился и в тоже время вырос его объем, т.е. MFI > предыдущего бара и объем > предыдущего бара. Признак продолжения тренда. Но более значимым подтверждением тренда или предупреждением о возможном развороте является Awesome Oscillator, который измеряет движущую силу рынка путем вычисления разницы между 5 Периодной и 34 Периодной Простыми Скользящими Средними (SMA 5 - SMA 34) по средним точкам баров (hl2). Поэтому по умолчанию "Зеленые" бары и противоположные им "Увядающие" бары окрашены в соответствии с цветом Awesome Oscillator.
По стратегии Profitunity Билла Вильямса с помощью осциллятора Awesome Oscillator определяется третья волна Эллиота по максимальному пику AO в интервале от 100 до 140 баров. Наличие дивергенции между максимальным пиком AO и следующим за ним более низким пиком AO в этом интервале также предупреждает о возможной коррекции, особенно если AO переходит через нулевую линию между этими пиками AO. Поэтому на графике дополнительно отображаются цены самого высокого и самого низкого баров, а также максимальный или минимальный пик АО в интервале 140 баров от последнего бара. В настройках индикатора вы можете скрыть метки, линии, изменить количество баров и любые параметры для индикатора AO – метод (SMA, Smoothed SMA, EMA и другие), длину, источник (open, high, low, close, hl2 и другие).
Бычий Дивергентный бар
🟢 Сигналом на покупку (Long) является Бычий Дивергентный бар над которым отображается зеленый круг, если такой бар соответствует одновременно всем следующим условиям:
Максимум бара ниже всех линий индикатора Alligator.
Цена закрытия бара выше его середины, т.е. close > (high + low) / 2.
Минимум бара ниже минимума 2-х предыдущих баров или ниже минимума одного предыдущего бара, а минимум второго предыдущего бара является нижним фракталом (▼). По умолчанию не отображаются Дивергентные бары, минимум которых ниже минимума только одного предыдущего бара и минимум 2-го предыдущего бара не является нижним фракталом (▼), но вы можете включить отображение любых Дивергентных баров в настройках индикатора (установив значение "no" в поле "Divergent Bars > Filtration").
Усилением сигнала Бычьего Дивергентного бара являются следующие условия:
Цена открытия бара, как и цена закрытия, выше его середины, т.е. Open > (high + low) / 2.
Максимум бара ниже всех линий открытого индикатора Alligator, т.е. зеленая линия (Lips) ниже красной линии (Teeth) и красная линия ниже синей линии (Jaw). В этом случае цвет круга над Бычьим Дивергентным баром окрашен в темно-зеленый цвет.
Приседающий Дивергентный бар.
Бар, следующий за Бычьим Дивергентным баром, соответствует зеленому цвету Awesome Oscillator.
Дивергенция на Awesome Oscillator.
Образование нижнего фрактала (▼), у которого минимум Дивергентного бара является пиком фрактала.
Медвежий Дивергентный бар
🔴 Сигналом на продажу (Short) является Медвежий Дивергентный бар под которым отображается красный круг, если такой бар соответствует одновременно всем следующим условиям:
Минимум бара выше всех линий индикатора Alligator.
Цена закрытия бара ниже его середины, т.е. close < (high + low) / 2.
Максимум бара выше маскимума 2-х предыдущих баров или выше максимума одного предыдущего бара, а максимум второго предыдущего бара является верхним фракталом (▲). По умолчанию не отображаются Дивергентные бары, максимум которых выше максимума только одного предыдущего бара и максимум 2-го предыдущего бара не является верхним фракталом (▲), но вы можете включить отображение любых Дивергентных баров в настройках индикатора (установив значение "no" в поле "Divergent Bars > Filtration").
Усилением сигнала Медвежьего Дивергентного бара являются следующие условия:
Цена открытия бара, как и цена закрытия, ниже его середины, т.е. open < (high + low) / 2.
Минимум бара выше всех линий открытого индикатора Alligator, т.е. зеленая линия (Lips) выше красной линии (Teeth) и красная линия выше синей линии (Jaw). В этом случае цвет круга под Медвежьим Дивергентным Баром окрашен в темно-красный цвет.
Приседающий Дивергентный бар.
Бар, следующий за Медвежьим Дивергентным баром, соответствует красному цвету Awesome Oscillator.
Дивергенция на Awesome Oscillator.
Образование верхнего фрактала (▲), у которого максимум Дивергентного бара является пиком фрактала.
Пересечение линий Alligator
Пересечение барами зеленой линии (Lips) открытого индикатора Alligator является первым предупреждением о возможной коррекции (откате цены) при выполнении одного из следующих условий:
Если бар закрылся ниже линии Lips, которая выше линии Teeth, а линия Teeth выше линии Jaw, при этом цена закрытия предыдущего бара находится выше линии Lips.
Если бар закрылся выше линии Lips, которая ниже линии Teeth, а линия Teeth ниже линии Jaw, при этом цена закрытия предыдущего бара находится ниже линии Lips.
Пересечение барами всех линий открытого Alligator является признаком глубокой коррекции и предупреждением о возможной смене тренда.
Частое пересечение линий Alligator между собой является признаком бокового тренда (флэт).
Оповещения о сигналах
Для получения уведомлений о сигналах при создании оповещения необходимо выбрать условие "При любом вызове функции alert()", в таком случае уведомления будут приходить в следующем формате:
D — таймфрейм, например: D, 4H, 15m.
🟢 BDB⎾ — сигнал Бычьего Дивергентного бара на покупку (Long), срабатывает один раз после закрытия бара и включает дополнительные сигналы:
/// — если Alligator открыт.
⏉ — если цена открытия бара, как и цена закрытия, выше его середины.
+ Squat 🔷 — Приседающий бар или + Green ↑ — "Зеленый" бар или + Fake ↓ — Фальшивый бар.
+ AO 🟩 — если после закрытия Дивергентного бара, изменение цвета осциллятора для следующего бара соответствует зеленому цвету Awesome Oscillator. ┴/┬ — AO выше/ниже нулевой линии. ∇ — если есть дивергенция на AO в интервале 140 баров от последнего бара.
🔴 BDB⎿ — сигнал Медвежьего Дивергентного бара на продажу (Short), срабатывает один раз после закрытия бара и включает дополнительные сигналы:
/// — если Alligator открыт.
⏊ — если цена открытия бара, как и цена закрытия, ниже его середины.
+ Squat 🔷 — Приседающий бар или + Green ↑ — "Зеленый" бар или + Fake ↓ — Фальшивый бар.
+ AO 🟥 — если после закрытия Дивергентного бара, изменение цвета осциллятора для следующего бара соответствует красному цвету Awesome Oscillator. ┴/┬ — AO выше/ниже нулевой линии. ∇ — если есть дивергенция на AO в интервале 140 баров от последнего бара.
Сигнал пересечения барами зеленой линии (Lips) открытого индикатора Alligator (можно отключить в настройках индикатора в поле "Alligator > Enable crossing lips alerts"):
🔴 Crossing Lips ↓ — если бар закрылся ниже линии Lips, которая выше остальных линий, при этом цена закрытия предыдущего бара находится выше линии Lips.
🟢 Crossing Lips ↑ — если бар закрылся выше линии Lips, которая ниже остальных линий, при этом цена закрытия предыдущего бара находится ниже линии Lips.
Сигнал фрактала срабатывает после закрытия второго бара, завершающего формирование фрактала, если оповещения о фракталах включены в настройках индикатора (поле "Fractals > Enable alerts"):
🟢 Fractal ▲ — верхний (Медвежий) фрактал.
🔴 Fractal ▼ — нижний (Бычий) фрактал.
⚪️ Fractal ▲/▼ — одновременно верхний и нижний фрактал.
↳ (H=high - L=low) = разница.
Если вы перенаправляете оповещения на URL вебхука, например, в бота Telegram, то вам необходимо установить шаблон оповещения для вебхука в настройках индикатора в поле "Webhook > Message" (содержит подсказку с примером), в котором в качестве текста сообщения достаточно указать текст {{message}}, который будет автоматически заменен на текст оповещения с тикером и ссылкой на TradingView.
‼️ Сигнал — это не призыв к действию, а лишь повод проанализировать график для принятия решения на основе правил вашей стратегии.

Power Bar SMA Directional (Trade Your Edge)GENERAL OVERVIEW:
The Power Bar SMA Directional (Trade Your Edge) indicator identifies high-momentum Power Bars and uses a structured SMA-based breakout model to generate Long and Short trading signals. Once a signal appears, the indicator automatically places a Stop-Loss and three Take-Profit levels, with an optional dynamic trailing stop-loss. Alerts are available for every trade event.
This indicator was developed by Flux Charts in collaboration with Steven Adams (Trade Your Edge).
What is the purpose of the indicator?:
The purpose of the Power Bar SMA Indicator is to turn an unusually strong candle (Power Bar) into a complete, rule-based trade setup. The indicator does three main things, very specifically:
It spots “power bars”. These are candles where the body is both large compared to the candle’s own range and large compared to nearby candles.
It only cares about power bars when they align with the trend’s direction: bullish or bearish.
When that happens, the indicator gives a buy or sell signal with an entry at the signal candle, a stop-loss at the low/high of the power bar, and three take-profit targets placed at fixed multiples of the entry to stop-loss distance. You can also have the stop move up/down after each target is hit with the trailing stop-loss feature.
What’s the theory behind the indicator?:
The theory behind this indicator is that large, one-sided candles often mark the start of directional strength. When a candle’s body takes up most of its total range and exceeds the average size of recent candlesticks, it shows clear control from either buyers or sellers. The indicator combines this concept with a simple moving average to confirm trend direction, ensuring signals only align with the current bias. It then checks if price breaks a recent swing high or low to confirm momentum is continuing rather than consolidating inside a range. By combining three core elements: trend bias, momentum identification, and confirmation that price has room for new discovery beyond prior ranges, the indicator can focus on finding trade setups that have multiple market factors in alignment.
POWER BAR SMA DIRECTIONAL FEATURES:
The Power Bar SMA Directional indicator includes 4 main features:
Power Bars
Trend Bias
Long / Short Signals + Risk Management
Alerts
POWER BARS:
🔹What are Power Bars?:
Power Bars are large, high-momentum candles that show strength in one direction of the market. They form when a candle’s body (the distance between open and close) dominates most of the candle’s total range (the distance between high and low), meaning price moved strongly in one direction with little to no pullback. To qualify, the candle must also be large relative to nearby candles. This size difference confirms that the candle is a burst of momentum.
🔹How to interpret and use Power Bars:
When a Power Bar forms, it signals that price has just made a strong directional move with little to no pullback. Traders can use these bars to identify momentum shifts and potential trade setups.
A bullish Power Bar means buyers controlled the entire candle, marking the start of upward momentum. A bearish Power Bar means sellers were in control of the entire candle, signaling the start of downwards momentum. In the Power Bar SMA Directional indicator, these candles are only used for signals when they align with the market trend and satisfy other entry requirements, mentioned later on.
Bullish Power Bars forming above the Simple Moving Average (SMA) can signal potential long opportunities.
Bullish Power Bars forming below the SMA can signal potential short opportunities.
🔹How are Power Bars identified:
Power Bars are detected and confirmed only after the candle closes, ensuring that the full candlestick body and range can be measured. The indicator does not repaint or change past bars. Once a Power Bar is confirmed, it stays fixed on the chart. Power Bars can be detected on any timeframe or symbol that produces standard candlestick data.
The indicator identifies Power Bars using two user-defined inputs: Sensitivity and Body %.
◇ Sensitivity:
The Sensitivity setting determines how large a candle’s body must be relative to nearby candles. It uses the Average True Range (ATR) to compare the current candle’s size with recent candles, and the Sensitivity value acts as a multiplier of that ATR. A higher Sensitivity value means the candle must be much larger than recent candles to qualify, so fewer Power Bars will form. A lower value makes the filter less strict, allowing more candles to qualify.
◇ Body %:
The Body % setting controls what percentage of the candle’s total range must be body rather than Wick. A higher value requires the body to take up more of the candle’s total range, so fewer candles pass the filter. A lower value allows candles with more wick to qualify, so more Power Bars will form.
Body % Example:
If Body % is set to 50, the candle body must cover at least half of the candle’s total range. For example, if a candle’s high is $11, its low is $10, its open is $10.20, and its close is $10.80, then the total range is $1 ($11 - $10) and the body is $0.60 ($10.80 - $10.20). Body % = (Body / Total Range) * 100 = (0.60 ÷ 1.00 × 100) = 60%. Since 60% is greater than the input of 50%, this candle passes the Body % criteria.
Once a candlestick closes and it meets both the Sensitivity and Body % requirements, it will be plotted in a different color, using barcolor() function. Users can adjust the bullish/bearish colors of Power Bars by adjusting the ‘Candle Coloring’ setting. The Power Bar candle coloring is purely visual and does not affect signal logic or strategy calculations.
TREND BIAS:
The indicator uses a Simple Moving Average (SMA) to determine overall trend direction and ensure that long/short signals align with the market bias.
When the SMA is sloping upward and price is trading above it, the market is considered to be in a bullish trend. In this case, only long setups are allowed. When the SMA is sloping downward and price is below it, the market is considered bearish, and only short setups are valid. This filtering ensures that every signal follows the current trend rather than fighting it.
Within the settings, the SMA length can be customized to match different trading styles. A shorter SMA period reacts more quickly to price changes, making it better suited for scalping or lower timeframes where traders want faster entries and exits. A longer SMA period responds more slowly, which smooths out smaller fluctuations and is more useful for day traders or swing traders who focus on larger trends. By default, the SMA length is set to 20.
Signals on SEED_ALEXDRAYM_SHORTINTEREST2:NQ 5-minute timeframe with a 10 SMA vs. 100 SMA:
🔹Why does the indicator include a trend filter?:
This indicator is built around the assumption that markets tend to continue moving in their current direction. Thus, if the trend is bullish, it’s assumed that price will continue moving higher. If the trend is bearish, it’s assumed that price will continue moving lower. By combining the SMA filter with the momentum logic of the power bars, the indicator avoids countertrend setups. This keeps signals focused on continuation setups where both the trend and short-term strength (momentum) are in agreement.
LONG/SHORT SIGNALS:
This indicator identifies potential trade setups by combining momentum, trend alignment, and structural confirmation. It detects when a Power Bar candle appears, and then looks for confirmation that the move is valid through trend alignment and a structure break.
There are three long setups and three short setups:
Momentum Breakout
Proximity Breakout
Delayed Breakout
All setups require:
A valid Power Bar forming in the correct context relative to the SMA.
A break of nearby structure (defined by the Swing Length setting).
🔹Signal Settings:
◇ SMA Distance:
This setting defines how close a Power Bar must be to the SMA to qualify for the proximity breakout setup type. It measures the maximum allowed distance between the Power Bar’s open price and the SMA, expressed as a multiple of the Average True Range (ATR).
This setting only affects Setup #2 (Proximity Breakout) and sometimes Setup #3 (Delayed Breakout). Setup #1 does not use this filter because its logic depends on price crossing the SMA or confirming later. In proximity setups, the power bar candle must both open and close on the same side of the SMA (bullish or bearish) while still being within the allowed SMA Distance range. This condition prevents signals when price is stretched too far away from the SMA, which could indicate exhaustion or a potential pullback rather than continuation.
A lower SMA Distance value tightens this filter, allowing only Power Bars that form very close to the SMA, resulting in fewer but more conservative signals. A higher SMA Distance value gives wiggle room and allows setups that form farther from the SMA, generating more frequent signals.
In the example below, when the SMA Distance is set to 0.5 (left chart), the bullish Power Bar does not trigger a long signal because its opening price is too far from the SMA. When the SMA Distance is increased to 1.0 (right chart), the same candle now falls within the allowed range, making the setup valid and displaying a long signal label.
◇ Swing Length:
The Swing Length setting defines how the indicator identifies recent structure levels used for breakout confirmation. These structure levels are swing highs and swing lows, which represent points where price reversed direction over a specified number of bars. The indicator uses these high/low levels to determine whether price has broken past a meaningful area of prior support or resistance before confirming a trade setup.
The Swing Length value determines how far back the indicator looks when calculating these points. Internally, it uses the Highest/Lowest method, scanning the last N bars (where N is the Swing Length input) to find the highest high and lowest low within that range.
The highest high becomes the immediate resistance level for potential long setups.
The lowest low becomes the immediate support level for potential short setups.
A lower Swing Length value makes the indicator reference closer levels. This increases the number of potential signals because nearby highs and lows are easier for price to reach.
A higher Swing Length value references farther structure levels, typically major swing points, which reduces signal frequency.
Every setup requires a structure break for confirmation. The Swing Length setting directly affects how strict or lenient the entire indicator behaves for each setup type.
In Setup #1 (Baseline Momentum Breakout) and Setup #2 (Trend-Aligned Proximity Breakout), the Power Bar must break the structure level during or immediately after its formation.
In Setup #3 (Delayed Breakout Confirmation), the same Swing Length level is referenced for a limited number of candles defined by the Candles Between Confirmation setting.
◇ Candles Between Confirmation:
The Candles Between Confirmation setting defines how long the indicator will wait for price to confirm a breakout after a qualifying Power Bar forms. It represents the maximum number of bars allowed between the Power Bar’s close and the moment when price breaks the nearby structure level, which is derived from the Swing Length setting. The structure level is defined as the most recent swing high (for long setups) or swing low (for short setups).
If a structure break occurs within the specified window, a valid signal is triggered, and the Long or Short label is plotted at the close of the breakout candle. If price fails to break through the level within a certain number of candles, the setup is invalidated. This ensures that signals only appear when momentum follows through promptly, and not when price stalls or consolidates for an extended period.
Lower values make confirmations stricter, capturing only quick momentum breakouts. Higher values allow more time for slower markets or higher timeframes to complete structure breaks. Adjust this setting based on market volatility and trading style.
In the example below, when Candles Between Confirmation is set to 10, no signal appears because price breaks the swing high after 15 bars, which is greater than the allowed limit. When the setting is increased to 15, the same move qualifies, and a long signal is triggered as price breaks the swing high 15 candles after the initial bullish Power Bar that crossed the SMA.
🔹Long Setups:
Long Setup #1: Momentum Breakout
A bullish Power Bar opens below the SMA, and closes above it, showing buyer strength.
A breakout must occur during this bullish Power Bar candle through a nearby resistance level derived from the Swing Length setting.
When this breakout occurs, a Long Signal appears at bar close.
After a signal appears, three take-profit levels and one stop-loss level are also plotted.
Stop-Loss: Placed at the Power Bar’s low.
Take-Profit 1: Set using a 1:1 risk distance from the Stop-Loss to entry.
Take-Profit 2: Extends to 1:1.5 risk-to-reward.
Take-Profit 3: Extends to 1:2 risk-to-reward.
(Power Bars are white in this image)
Long Setup #2: Proximity Breakout
A bullish Power Bar opens and closes above the SMA, but is still close enough to it to show price hasn’t extended too far. (Refer to SMA Distance setting). As long as the opening of that candle is within the SMA Distance threshold, the setup remains valid.
The bullish Power Bar candle must break through the recent swing high (refer to Swing Length setting).
A Long Signal triggers when that breakout is confirmed.
After a signal appears, three take-profit levels and one stop-loss level are also plotted, similar to Long Setup #1.
(Power Bars are white in this image)
Long Setup #3: Delayed Breakout
A bullish Power Bar appears in a valid location (Refer to Long Setup #1 or Long Setup #2), but structure is not broken immediately.
The indicator waits for confirmation within the maximum Candles Between Confirmation window. If price breaks structure within that time, a Long Signal appears. If price fails to break structure in time, the setup is discarded.
Risk Management:
Same Stop-Loss, TP 1, TP 2, and TP 3 logic as Long Setup #1
(Power Bars are white in this image)
🔹Short Setups:
Short Setup #1: Momentum Breakout
A bearish Power Bar opens above the SMA, and closes below it, showing seller strength.
A breakout must occur during this bearish Power Bar candle through a nearby support level derived from the Swing Length setting.
When this breakout occurs, a Short Signal appears at bar close.
After a signal appears, three take-profit levels and one stop-loss level are also plotted.
Stop-Loss: Placed at the Power Bar’s high.
Take-Profit 1: Set using a 1:1 risk distance from the Stop-Loss to entry.
Take-Profit 2: Extends to 1:1.5 risk-to-reward.
Take-Profit 3: Extends to 1:2 risk-to-reward.
(Power Bars are white in this image)
Short Setup #2: Proximity Breakout
A bearish Power Bar opens and closes below the SMA, but is still close enough to it to show price hasn’t extended too far. (Refer to SMA Distance setting). As long as the opening of that candle is within the SMA Distance threshold, the setup remains valid.
The bearish Power Bar candle must break through the recent swing low (refer to Swing Length setting).
A Short Signal triggers when that breakout is confirmed.
After a signal appears, three take-profit levels and one stop-loss level are also plotted, similar to Short Setup #1.
(Power Bars are white in this image)
Short Setup #3: Delayed Breakout
A bearish Power Bar appears in a valid location (Refer to Short Setup #1 or Short Setup #2), but structure is not broken immediately.
The indicator waits for confirmation within the maximum Candles Between Confirmation window. If price breaks structure within that time, a Short Signal appears. If price fails to break structure in time, the setup is discarded.
Risk Management:
Same Stop-Loss, TP 1, TP 2, and TP 3 logic as Long Setup #1
(Power Bars are white in this image)
🔹Trailing Stop-Loss Feature:
When the Trailing Stop-Loss setting is enabled, the Stop-Loss (SL) automatically adjusts as price reaches take-profit levels. This feature helps secure profits while keeping the trade logic completely rule-based and non-discretionary.
Here’s exactly how it works step-by-step:
Initial Stop-Loss placement:
For a Long trade, the initial SL is set at the low of the bullish Power Bar that triggered the setup.
For a Short trade, the initial SL is set at the high of the bearish Power Bar that triggered the setup.
This level stays fixed until one of the Take-Profit targets is reached.
After TP 1 is hit:
The SL automatically moves to the entry price (breakeven).
After TP2 is hit:
The SL automatically moves to TP 1
Final exit condition:
The trade is considered complete once either the trailing Stop-Loss or TP 3 is reached.
🔹Visualization:
Users can enable or disable:
Long Signals
Short Signals
Take-Profit Lines
Take-Profit Labels
Stop-Loss Lines
Stop-Loss Labels
Signal Line
SMA
◇ Signal Line:
The Signal Line is an optional visual feature that helps users see exactly which structure level the indicator is using to confirm a breakout. It does not change how signals are generated. It only displays the reference point on the chart.
Users can customize the Signal Line style (Dashed, Dotted, Solid) and choose different colors for bullish and bearish signal lines. The Signal Line can also be turned off completely. When disabled, signals will not be affected.
ALERTS:
The indicator supports alerts, so you never miss a key market move. You can choose to receive alerts for each of the following conditions:
Long Signal
Short Signal
TP 1 (Take-Profit 1)
TP 2 (Take-Profit 2)
TP 3 (Take-Profit 3)
SL (Stop-Loss)
UNIQUENESS:
This indicator automates a strategy that is normally managed manually using multiple steps: identifying large momentum candles, validating trend direction, confirming breakout strength through structure, and then projecting clean risk-based targets. The SMA Distance filter, confirmation window, and swing structure rules work together to ensure signals only trigger when momentum (Power Bars) aligns with technical levels. This indicator turns Power Bars into complete trade ideas with real-time SL/TP management and alerts.

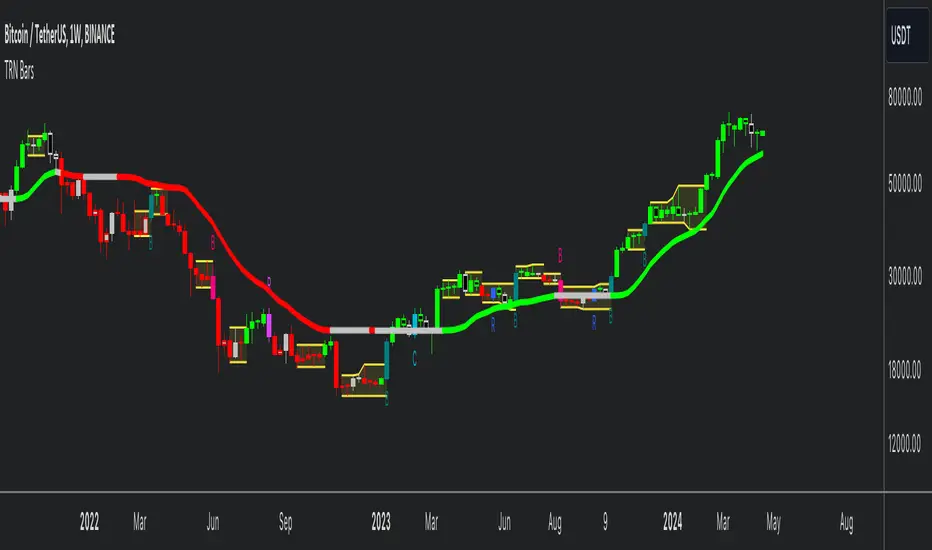
TRN BarsThe innovative TRN Bars are designed to help traders to analyze markets in an intuitive way. It combines three core concepts:
TRN Bars to see the current trend and reversals (replaces the default chart bars)
Bar Ranges to highlight consolidations
Dynamic Trend to see the overall trend.
First, let's have a look at each of these concepts individually. Afterwards, we describe how a combination of all three gives you a crystal-clear picture of the market.
TRN Bars
They show bullish and bearish trends and reversals based on color coding the bars and give high probability trade opportunities with special colors. The trend analysis is based on a new algorithm that includes several different inputs:
classical and advanced bar patterns and their statistical frequency
probability distributions of price expansions after certain bar patterns
bar information such as wick length in %, overlapping of the previous bar in % and many more
historical trend and consolidation analysis
The algorithm weighs these concepts and outputs a color scheme for the chart bars or candlesticks.
Bar Types
Trend bars in green and red
Reversal Bars in blue and fuchsia
Continuation Bars in turquoise and orange
Breakout Bars in dark green and pink
Green Bars signify a sustained uptrend, indicating bullish market sentiment. On the other hand, Red Bars indicate a persistent downtrend, representing bearish market sentiment. The transition from red to green denotes a bullish trend reversal, suggesting a shift from bearish to bullish sentiment. Conversely, the shift from green to red signals a bearish trend reversal, indicating a transition from bullish to bearish sentiment. By monitoring these color changes, traders can identify potential trend reversals and make informed trading decisions.
The presence of gray and black bars indicates a neutral market state, often observed before an impending color change from red to green or green to red. These neutral bars serve as a transition phase between the previous trend and the potential reversal.
The TRN Bars incorporate Signal Bars, distinguished by their distinct colors, to offer potential buy and sell signals and deeper insights into market dynamics.
Reversal Bars
The presence of blue Reversal Bars indicates a trend reversal to the upside, while pink Reversal Bars indicate a reversal to the downside. These bars not only serve as signals for potential trend shifts but also present favorable opportunities to enter the market or increase one's position size.
Continuation Bars
In addition to the reversal bars, TRN Bars also include bullish continuation bars (colored turquoise) and bearish continuation bars (colored orange). These bars act as signals for the continuation of an existing trend. Like the reversal bars, they can be utilized as entry points or opportunities to augment one's position size.
Breakout Bars
The dark green breakout bars within TRN Bars show a powerful breakout from a price range detected by our integrated bar range feature. They signify the continuation or potential change in a trend following a consolidation phase. As such, these bars hold dual functionality, serving as reversal signals and validating the persistence of an ongoing trend.
Bar Ranges
The bar range feature automatically finds consolidations where the price range of several consecutives bars is rather small. The detection of the bar ranges includes among other things the overlapping percentage of these bars.
How to Use Price Ranges
Here are a few ways you can use the bar ranges in your trading:
Identify Support and Resistance Levels
The price ranges can help you identify key support and resistance levels on a chart. By observing price ranges and identifying these levels, you can make more informed decisions about entering or exiting trades.
Breakout Trading
Price ranges can also provide insights into potential breakout opportunities. Breakouts occur when the price breaks out of a defined range, signaling a potential shift in market sentiment and the start of a new trend. The Color highlighted Breakout Bars from the TRN Bars are signaling a powerful breakout of a price range. Traders can enter positions in the direction of the breakout and set appropriate stop-loss orders to manage risk. Note that not every price range is left by a powerful breakout.
Dynamic Trend
The Dynamic Trend combines elements from standard trend strength indicators (e.g. DI-, DI+, Parabolic SAR) and volatility indicators (e.g. ATR, Standard Deviation). It produces a moving average line that adapts to changing market volatility. It is inspired by the ideas of the programmer and trader Fat Tails. The adaptive behavior provides more relevant information for traders when compared to traditional moving averages which do not consider volatility and trend strength together. This makes the Dynamic Trend completely unique, and no other moving average indicator can give you this precision.
How to use Dynamic Trend
Generally, a rising Dynamic Trend line, displayed in green, indicates that an uptrend is strong, while a falling Dynamic Trend, displayed in red, suggests that the downtrend is sharp. The Dynamic Trend turns gray when there is insufficient clarity to establish a distinct trend and especially when there is not volatility in the market.
Identify potential trade entries and exits: When used in conjunction with price action, the Dynamic Trend can provide potential trade signals. For example, if the price crosses above the Dynamic Trend, it may be a bullish sign, suggesting a potential buy entry. Conversely, if the price crosses below the Dynamic Trend, it may indicate bearish conditions and a potential sell signal.
Trend Identification and Pullback trading
Observe the Dynamic Trend's color. When it's on the rise and appears green, it indicates a bullish trend. Conversely, if it's in decline and displayed in red, it signals a bearish trend.
If Dynamic Trend is green and price pulls from above back to the Dynamic Trend, then this can be considered as a bullish signal.
If Dynamic Trend is red and price pulls from below back to the Dynamic Trend, then this can be considered as a bearish signal.
In the event of a bearish signal, such as a bearish TRN Signal Bar, and the Dynamic Trend is red, it provides additional confirmation to the bearish signal. Likewise, bullish signals gain added conviction when the Dynamic Trend is green.
Crossovers
As with other moving averages, crossovers between the Dynamic Trend and the price can be significant.
If price is crossing above the Dynamic Trend, then this can be considered as a bullish signal.
If price is crossing below the Dynamic Trend, then this can be considered as a bearish signal.
If you currently hold a position, both bullish and bearish crossovers can serve as potential exit signals. For instance, in the case of a long position, a bearish crossover can indicate a potential shift in sentiment, signaling a bearish reversal and a potential opportunity to close your long position.
Filtering Noise
Due to its adaptive nature, the Dynamic Trend can be a useful tool to filter out market noise. When the market is choppy or consolidating, the Dynamic Trend tends to remain flat and colored gray, signaling traders to potentially stay out of the market.
Stop Losses
The Dynamic Trend can also be used as a dynamic stop loss. For instance, in a long trade, traders can use the Dynamic Trend as a trailing stop, selling their position if the price crosses below the Dynamic Trend.
Combining TRN Bars, Bar Ranges and Dynamic Trend together
Combining all three concepts gives you a crystal-clear picture of the market. The Dynamic Trend shows you the overall trend. If price pulls back to the dynamic trend line and then price picks up the trend direction again, then the TRN Bars immediately switch the color to the trend direction. Therefore, you can easily identify high probability entry signals based on the bar color.
As a simple trading model, you can set the stop loss below the last swing or below a TRN signal bar (vice versa for short entries) and use 2.5 R or 3 R as target.
You can increase the success rate of the high probability TRN signal bars entries even more if they are in line with the Dynamic Trend line.
On the other hand, the TRN Bar Ranges help you to stay out of the market in case the price does not really change. As a confluence signal to stay flat in this period the dynamic trend line tends to be grey as well. If the price breaks out of the range, then the TRN Bars print a breakout bar which serves as a high probability entry signal.
Although it is possible to switch off any of these concepts, it is highly recommended to use all three in combination to get a crystal-clear picture of the market.
Alerts
Experience the power of our TRN Bars Alerts, delivering real-time notifications for trend changes, price range breakouts, and signal bar formations or confirmations. Stay on top of the market with these versatile alerts, customizable to your preferred assets and timeframes.
Conclusion
While signals from TRN Bars can be informative, it is important to recognize that their reliability may vary. Various external factors can impact market prices, and it is essential to consider your risk tolerance and investment goals when executing trades.
Opening Power Bar Strategy (Trade Your Edge)💎 GENERAL OVERVIEW:
The Opening Power Bar Strategy indicator identifies high-momentum “Power Bars” during the first 60 minutes of the New York session and generates Long/Short signals using levels from the pre-market session. The indicator plots Stop-Loss and three Take-Profit levels, manages dynamic trailing stop-loss logic (optional), displays pre-market levels, and supports alerts.
This indicator was developed by Flux Charts in collaboration with Steven Adams (Trade Your Edge).
🔹What is the purpose of the Opening Power Bar Strategy?:
The purpose of the Opening Power Bar Strategy is to trade the most active and meaningful part of the trading day, the opening move. It’s designed to take advantage of the volume and volatility that happens right after the market opens, when traders react to overnight news and pre-market movement. The indicator helps identify when that early move has real strength by looking for a large, decisive candle (a Power Bar) forming around key pre-market levels. Once it detects one, it builds a full trade plan automatically with entry, stop-loss, and take-profits.
🔹Why are signals only during the first 60 minutes?:
Most of the day’s total trading volume happens within the first 60 minutes after the market opens. This period usually sets the high or low of the day and defines the bias: whether the market will trend or stay in a range. After this first hour, volume and volatility typically decrease, and price movement becomes less consistent.
🔹What’s the theory behind the Opening Power Bar Strategy?:
The Opening Power Bar Strategy is built on a simple principle: the first hour after the market open sets the tone for the rest of the day. This period consistently shows the highest trading volume, as traders react to overnight news, economic data releases, pre-market movements, etc.
These early reactions often establish the day’s high/low, revealing where buyers or sellers are strongest. When a large, decisive candle (a Power Bar) forms during this time near the pre-market high or low, it confirms that one side is taking control. The pre-market high and low define the range that institutions and short-term traders had already reacted to before the market open. Thus, when a Power Bar forms near one of these levels during the first hour, it often marks the start of a breakout or rejection that shapes the rest of the session.
🎯 OPENING POWER BAR STRATEGY FEATURES:
The Opening Power Bar Strategy indicator includes 5 main features:
Power Bars
Pre-Market High / Low / Mid Levels
Long / Short Signals + Risk Management
Simple Moving Average (SMA)
Alerts
1️⃣ Power Bars:
🔹What are Power Bars?:
Power Bars are large, high-momentum candles that show strength in one direction of the market. They form when a candle’s body (the distance between open and close) dominates most of the candle’s total range (the distance between high and low), meaning price moved strongly in one direction with little to no pullback. To qualify, the candle must also be large relative to nearby candles. This size difference confirms that the candle is a true burst of momentum. In short, Power Bars reveal where real strength has just entered the market and where momentum is most likely to continue.
🔹How to interpret and use Power Bars:
When a Power Bar forms, it signals that price just made a strong directional move with little to no pullback. Traders can use these bars to identify momentum shifts and potential trade setups during the opening session.
A bullish Power Bar means buyers controlled the entire candle, often marking the start of upward momentum. A bearish Power Bar means sellers were in control the entire candle, often signaling the start of downwards momentum. In the Opening Power Bar Strategy, these candles are only used for signals when they appear within the pre-market high and low range. Their location relative to the pre-market midline determines direction bias:
Bullish Power Bars forming near the pre-market low can signal potential long opportunities.
Bearish Power Bars forming near the pre-market high can signal potential short opportunities.
🔹How are Power Bars identified?:
Power Bars are detected and confirmed only after the candle closes, ensuring that the full candlestick body and range can be measured. The indicator does not repaint or change past bars. Once a Power Bar is confirmed, it stays fixed on the chart. Power Bars can be detected on any timeframe or symbol that produces standard candlestick data. However, since the Opening Power Bar Strategy focuses on the first 60 minutes of the trading session, they’re most meaningful on lower intraday timeframes such as 1-minute to 5-minute charts.
The indicator identifies Power Bars using two user-defined inputs: Sensitivity and Body %.
🔹Sensitivity:
The Sensitivity setting determines how large a candle’s body must be relative to nearby candles. It uses the Average True Range (ATR) to compare the current candle’s size with recent candles, and the Sensitivity value acts as a multiplier of that ATR. A higher Sensitivity value means the candle must be much larger than recent candles to qualify, so fewer Power Bars will form. A lower value makes the filter less strict, allowing more candles to qualify.
🔹Body %:
The Body % setting controls what percentage of the candle’s total range must be body rather than Wick. A higher value requires the body to take up more of the candle’s total range, so fewer candles pass the filter. A lower value allows candles with more wick to qualify, so more Power Bars will form.
Body % Example:
If Body % is set to 50, the candle body must cover at least half of the candle’s total range. For example, if a candle’s high is $11, its low is $10, its open is $10.20, and its close is $10.80, then the total range is $1 ($11 - $10) and the body is $0.60 ($10.80 - $10.20). Body % = (Body / Total Range) * 100 = (0.60 ÷ 1.00 × 100) = 60%. Since 60% is greater than the input of 50%, this candle passes the Body % criteria.
Once a candlestick closes and it meets both the Sensitivity and Body % requirements, it will be plotted in a different color, using barcolor() function. Users can adjust the bullish/bearish colors of Power Bars by adjusting the ‘Candle Coloring’ setting. The Power Bar candle coloring is purely visual and does not affect signal logic or strategy calculations.
🔹Do Power Bars form outside the first 60 minutes?:
Power Bars can technically form at any time of day, but the Opening Power Bar Strategy only uses those formed between 9:30 AM and 10:30 AM ET for trade signals.
2️⃣ Pre-Market Levels
The indicator tracks pre-market price action from 4:10 AM EST until 9:29 AM EST to determine the session’s High and Low. When pre-market ends, both levels are drawn and continuously projected to the right throughout the regular session. A midline is calculated as the midpoint between those levels and is used to determine bullish or bearish bias at the open. This midline is calculated in the indicator’s background and not visually plotted.
Long signals require price to be positioned below the midline before breaking upward, and Short signals require price to be positioned above the midline before breaking downward.
Users can enable retest labels, which appear if price touches the pre-market low, and closes above it, or if price touches the pre-market high, and closes below it. Users can also enable/disable the pre-market levels. If disabled, the pre-market high and pre-market low levels will not be displayed.
3️⃣Long/Short Signals:
Long and Short signals only trigger during the first hour of the New York trading session, between 9:30 AM and 10:30 AM EST. These signals form between the Pre-Market Low (PML) and Pre-Market High (PMH).
▫️ A Long entry requires:
1) A bullish power bar forms
1.a) The candle’s low is < the 50% area or Midpoint of the PML/PMH range
1.b) The candle closes above the PML, but below the PMH
2) If this candle occurs between 09:30 AM and 10:30 AM, a long signal will appear.
▫️ A Short Entry requires:
1) A bearish power bar forms
1a) The candle’s high is > the 50% area or Midpoint of the PML/PMH range
1b) The candle closes below the PMH, but above the PML
2) If this candle occurs between 09:30 AM and 10:30 AM, a short signal will appear.
Only one trade can be active at a time. Users can enable or disable Long Signals and Short Signals independently. Entry markers appear directly on the chart at confirmation.
When a signal is plotted on the Power Bar’s candle close, the indicator automatically builds a rule-based trade structure and plots the following information:
Stop-Loss (SL)
Take-Profit 1 (TP 1)
Take-Profit 2 (TP 2)
Take-Profit 3 (TP 3)
For Long signals, the SL is placed at the low of the bullish Power Bar and TP 1 is placed at the PMH. The distances for TP 2 and TP 3 are then measured using the move from the entry price to TP 1. That same distance is added once above TP 1 to set TP 2, and added again above TP 2 to set TP 3.
For Short signals, the SL is placed at the high of the bearish Power Bar, and TP 1 is placed at the PML. The distances for TP 2 and TP 3 are then measured using the absolute value of the move from the entry price to TP 1. That same distance is subtracted once below TP 1 to set TP 2, and subtracted again below TP 2 to set TP 3.
🔹Trailing Stop-Loss Feature:
When the Trailing Stop-Loss setting is enabled, the Stop-Loss (SL) automatically adjusts as price reaches take-profit levels. This feature helps secure profits while keeping the trade logic completely rule-based and non-discretionary.
Here’s exactly how it works step-by-step:
▫️ Initial Stop-Loss placement:
For a Long trade, the initial SL is set at the low of the Power Bar that triggered the entry.
For a Short trade, the initial SL is set at the high of the Power Bar that triggered the entry.
This level stays fixed until one of the Take-Profit targets is reached.
▫️ After TP 1 is hit:
The SL automatically moves to the entry price (breakeven).
This eliminates all downside risk on the trade.
▫️ After TP2 is hit:
The SL automatically moves to TP 1
This locks in a partial profit while allowing the trade to continue toward TP 3.
▫️ Final exit condition:
The trade is considered complete once either the trailing Stop-Loss or TP 3 is reached.
4️⃣Simple Moving Average (SMA)
In addition to the core trade logic, the indicator includes an optional Simple Moving Average (SMA) that provides extra confirmation and context for interpreting Power Bar signals. The SMA is not related to any of the signal generation logic. It does not influence when or where Power Bars or trade signals appear. Instead, it serves as a contextual confirmation tool and should be used as an additional way to interpret the strength and quality of a setup once a signal is triggered.
There are a few ways the SMA can be used for extra context with the Opening Power Bar Strategy:
▫️ #1 Directional Confirmation:
The SMA is mainly used as a confirmation tool for countertrend Power Bar setups. It helps traders identify when a strong reversal may be developing against the prior trend.
When the SMA is sloping downward but a bullish Power Bar closes above it, that can signal a potential shift from bearish to bullish momentum.
When the SMA is sloping upward but a bearish Power Bar closes below it, that can indicate a possible transition from bullish to bearish conditions.
▫️ #2 Timing Entries
When a large Power Bar prints a signal far away from the SMA, it often indicates that price has moved quickly and temporarily extended away from its average level. In these cases, the SMA can be used as a pullback area where price may retrace before resuming its move. Waiting for this pullback can often lead to a better risk-to-reward trade setup.
For example, in the chart below, a strong bullish Power Bar formed and triggered a Long signal while closing well above the SMA. Entering immediately after the signal would have produced a 0.22 risk-to-reward to TP 1. However, waiting for price to retrace back toward the SMA before entering would have resulted in a much stronger 2.46 risk-to-reward ratio.
The SMA provides a simple way to identify areas for safer pullback entries when a Power Bar signal forms too far from its average level. This helps traders maintain consistency with their risk-to-reward targets and align entries with their trading plan.
▫️ #3 Risk/Trade Management:
During active trades, the SMA can also be used to gauge the healthiness of a trend.
If price continues to respect the SMA after entry, it supports holding the position toward later Take-Profit levels. Additionally, the SMA can highlight areas where traders may consider adding to existing positions if price respects it.
If price closes strongly back through the SMA in the opposite direction, traders may use that as an early exit or a signal that momentum has shifted.
▫️ Optional and Visual Only:
The SMA is an optional visual overlay that can be turned on or off in the indicator’s settings. It is purely there for traders who want an added layer of confirmation and structure when evaluating setups from the Opening Power Bar Strategy.
Users can customize the length of the SMA and the color within the settings.
📢 Alerts:
The indicator supports alerts, so you never miss a key market move. You can choose to receive alerts for each of the following conditions:
Long Signal
Short Signal
TP 1 (Take-Profit 1)
TP 2 (Take-Profit 2)
TP 3 (Take-Profit 3)
SL (Stop-Loss)
Pre-Market Low Retest
Pre-Market High Retest
🚩UNIQUENESS:
This indicator automates a structured opening-range strategy that traders typically manage manually each morning. It identifies valid Power Bars only when they occur inside the pre-market high/low range, confirms direction using pre-market midline context, and automatically builds risk targets using the pre-market range itself. Once a valid trigger occurs during the defined trade window, the indicator immediately generates a complete trade idea (entry/SL/TP 1-3) with built-in trailing logic and alerts.

BeeQuant - Hive Bars🔶 OVERVIEW
The "Hive Bars" indicator is a truly revolutionary analytical instrument, meticulously engineered to transcend the limitations of conventional price charting and unveil the profound, underlying essence of market dynamics. Imagine possessing a sophisticated visual engine that intelligently reconstructs raw price data into unique, dynamically consolidated "Hive Bars." These specialized constructs intuitively reveal the dominant market momentum and highlight high-conviction signals often obscured by the ubiquitous noise of traditional candlesticks. This indicator acts as a precision filter, illuminating exactly when pivotal shifts are occurring by coloring these reconstructed units with an adaptive, unparalleled accuracy. It is expertly crafted for the discerning trader seeking an undeniable analytical advantage, offering a fresh, meticulously refined perspective that enables the discernment of concealed patterns, fostering more decisive and confident trading actions. Crucially, "Hive Bars" now feature proactive, real-time alert capabilities, ensuring no critical market inflection point ever goes unnoticed.
__________________________________________________________________________
🧠 CONCEPTS
At its intellectual core, the "Hive Bars" indicator operates upon an advanced, proprietary framework that fundamentally reinterprets market data. It presents this refined information through its unique "Hive Bars"—specialized visual constructs that dynamically encapsulate the consolidated spirit and true directional bias of price action, delivering unparalleled clarity.
⬜ Smart Bar Reconstruction: Hive Bars don’t follow time, they follow the market. They are derived through a sophisticated, multi-faceted internal process that precisely captures the dominant price influence and momentum over variable periods. This structure adapts dynamically to changing conditions, letting you see the real pressure behind price moves with consistency that time-based candles can’t match. This proprietary reconstruction creates a new, inherently consistent, and highly focused visual narrative of underlying market flow, effectively stripping away extraneous "noise" and revealing the market's authentic directional intent.
⬜ Multi-Layered Internal Analysis: A dynamic and live, adaptive line powers the core of Hive Bars. It recalibrates constantly, tracking market structure in real time. Every bar is formed in relation to this internal baseline, giving immediate context to price behavior. You choose the data that drives this line—open, close, high, low, or custom blends—to match your style.
⬜ Intelligent Bar Formation Sequences: Bars are created when the market speaks, not when the clock ticks. A built-in pattern engine reads the flow and waits for real structure to form. This allows the indicator to autonomously consolidate price action, presenting a cleaner, more coherent visualization of trend development as it truly unfolds, rather than fragmented snapshots based on time.
⬜ Visual Signal Precision: "Hive Bars" spring to life with an intuitively powerful coloring system. While primary colors (Green for upward bias, Red for downward bias) denote the prevailing market direction, the "Hive Bars" indicator introduces distinctively colored "Signal Hive Bars". These specialized bars emerge when the market price exhibits a particularly robust, high-conviction interaction with the adaptive internal baseline, standing out instantly and often mark key turning points or breakouts you want to act on.
⬜ Daily Reset Option: For intraday traders, there’s a reset feature that clears the internal build-up at the start of each new trading day. This ensures fresh, unbiased perspectives that are meticulously tailored to the distinct market dynamics and cyclic rhythms of the current trading day.
⬜ Adjustable Sensitivity: With Hive Smoothing, you’re in full control. This setting lets you fine-tune how sensitive the bars are to price movement. Want tighter, faster signals? Dial it down. Prefer broader, more filtered setups? Turn it up. You decide when a new Hive Bar forms—and when a Signal Bar confirms. It’s all based on how you trade and how your asset moves. No guesswork, no one-size-fits-all defaults. Hive Bars adapts to your strategy and trading style, not the other way around.
__________________________________________________________________________
✨ FEATURES
The "Hive Bars" indicator is equipped with a comprehensive suite of cutting-edge features, designed for unparalleled clarity, adaptive responsiveness, augmented analytical depth, seamless interoperability with your broader analytical toolkit, and proactive real-time notifications:
🔹Proprietary Hive Bar Reconstruction
Experience a uniquely advanced visual representation of price action that dynamically consolidates market data, leading to enhanced trend and momentum clarity that goes beyond standard charting and candlestick data.
🔹Customizable Internal Analysis Line
Gain precise control over the underlying adaptive baseline's calculation by selecting various internal price source options, ensuring its alignment with your specific analytical focus.
🔹 Smart Alerts for Key Events 🔔
Get notified in real time when:
◦ A new Hive Bar completes – signaling a fresh structural range reset
◦ A new Signal Hive Bar closes – identifying a potential overbought or oversold condition
Built-in alert conditions make it easy to stay ahead of shifts without watching every candle manually.
🔹Intelligent Bar Formation Sequencing
Diamond-shaped markers clearly indicate the start of the indicator's internal combination logic for enhanced visual understanding.
🔹High-Conviction "Signal Hive Bars" (Distinct Colors)
Receive specialized, uniquely colored visual alerts when Hive Bars exhibit strong, decisive movements relative to the adaptive baseline, indicating moments of heightened market conviction and potential opportunity.
🔹Session-Based Reconstruction
Opt for the "Daily New Start" to intelligently reset the indicator's perspective with each new trading day, providing fresh, session-aligned insights tailored for intraday precision.
🔹Unrivaled External Indicator Collaboration
A truly unique and powerful advantage of "Hive Bars" is its capability to seamlessly integrate and profoundly enhance the performance of other external indicators. By outputting clean, smoothed price data, it lets you feed a higher-quality source into tools like RSI, MACD, moving averages etc. Use close for indicators like RSI, and close for moving averages. The result is better clarity, fewer false signals, and a stronger edge across your setup. Hive Bars isn’t just an indicator, it’s an upgrade for everything you use.
🔹Non-Repainting Historical Integrity
Hive Bars never repaints. Each bar is locked in only after all internal conditions are fully met. This means you can trust every historical signal—it won’t shift or vanish after the fact. What you see in hindsight is exactly what was shown in real time.
🔹Universal Timeframe Compatibility
Whether you're scalping on the 1-minute chart or analyzing multi-month trends, Hive Bars delivers consistent, clean insights. Its architecture adapts to any timeframe without losing fidelity, making it a reliable tool for any strategy or style.
🔹Cross-Market Versatility
Hive Bars is engineered to perform with precision across all major markets—whether you're trading forex, commodities, stocks, or indices. Its adaptive logic automatically aligns with the unique volatility and structure of each asset class, delivering consistently reliable insights no matter where you trade.
__________________________________________________________________________
⚙️ USAGE
Integrating the "Hive Bars" indicator into your daily analytical regimen is an intuitive process that will profoundly enhance your ability to discern crucial market dynamics and spot high-conviction opportunities with unprecedented clarity:
💁 Effortless Application
Simply add the "Hive Bars" indicator to any chart within your TradingView platform. Note that it plots on a separate panel below your main price chart to provide its unique visual output without obscuring the primary price action.
📊 Strategic Calibration
Access the indicator's comprehensive settings panel to meticulously calibrate its powerful engines and unlock its full potential:
⚙ "Internal EMA Config"
Configure the internal adaptive baseline by choosing its source (e.g., CLOSE, HL/2) and its specific EMA length. This shapes the core reference point for the dynamic formation of the "Hive Bars."
🤖 "CONFIG Group"
Here, you decide if you want "Daily New Start" for session-based analytical resets (particularly beneficial for intraday strategies). The "Hive Smoothing" input allows you to control a further layer of consolidation for the "Hive Bars."
🟩🟥 "Color": Customize the appearance of both standard "Hive Bars" and "Signal Hive Bars" to suit your visual preferences, enhancing their immediate interpretability.
🧭 Empirical Exploration
Experimentation with these parameters is paramount. Dedicate time to exploring different combinations across various assets and timeframes to discover the optimal configuration that resonates with your unique trading methodology and the inherent volatility of the market being analyzed.
👀 Interpreting the Unveiled Market Reality: Once calibrated, the "Hive Bars" will present a strikingly clear and actionable picture of market dynamics:
+ Green/Red Hive Bars: These visually denote the consolidated directional bias of the market over the reconstructed period. A sustained sequence of Green "Hive Bars" suggests pervasive bullish pressure and an upward path of least resistance, while a series of Red "Hive Bars" indicates dominant bearish control and a clear downward momentum.
+ "Signal Hive Bars" (Distinct Colors): Pay close attention to these specially colored "Hive Bars." They signify critical moments where the reconstructed price action exhibits a particularly strong, high-conviction interaction with its adaptive internal baseline. These often precede or confirm significant market movements and serve as your clearest, most reliable visual triggers for potential shifts in market control.
⛓️ Intermittent Appearance: Observe that "Hive Bars" do not necessarily appear for every single native time unit of your chart. They are intelligently reconstructed and consolidated representations of price action, appearing only when specific internal conditions are met to present a coherent, high-impact view of distinct market phases.
🔗 Harnessing Advanced External Synergy: To unlock a new dimension of analytical power, profoundly enhance your existing indicator suite by integrating the output of "Hive Bars" as the data source for other external indicators. When adding or configuring indicators such as RSI, Stochastic Oscillators, various Moving Averages (EMA, SMA), or any other indicator that prompts for a 'source' input, you can now select the purified output of the "Hive Bars" as your desired data stream.
For oscillators (e.g., RSI, MACD), select the close or a similar relevant output from "Hive Bars" as your source. This allows the oscillator to react to the purified, consolidated momentum of the "Hive Bars" rather than the potentially noisy raw price data, leading to smoother and more meaningful oscillator signals.
For moving averages (e.g., EMA, SMA), utilize the close or other pertinent "Hive Bar" output as your source. This provides an exceptionally smooth, highly responsive, and less choppy average that precisely tracks the true underlying trend as identified by "Hive Bars." This unique capability allows for the construction of powerfully layered and synergistic trading strategies.
📢 Setting Up Proactive Alerts for Critical Events: Leverage the newly incorporated alert capabilities to maintain real-time awareness of pivotal market developments, even when not actively monitoring your charts.
You can now choose to be alerted specifically when a "New Hive Bar Closed" (signifying the definitive completion of a major market phase as identified by the indicator) or when a "New Signal Hive Bar Closed" (highlighting a high-conviction market event that warrants immediate attention due to its pronounced significance).
__________________________________________________________________________
⚠️ LIMITATIONS
While the "Hive Bars" indicator is an incredibly powerful and advanced tool for dissecting market dynamics, it is vital to understand its inherent design parameters and the prevailing platform-specific constraints for optimal and informed utilization:
👉 Visual Gaps in Plotting: Due to current platform limitations pertaining to custom candle plotting functionality, you may occasionally observe visual gaps or intermittent non-contiguous plotting between "Hive Bars" on the chart. They’re not missing data, but a result of strict plotting rules. A bar is only drawn when all internal conditions are met. This ensures accuracy, even if the chart shows some spacing.
👉 Complementary Tool: This indicator excels at providing high-conviction directional insights and identifying significant market phases. However, it is fundamentally designed as a sophisticated complementary tool to a broader trading strategy, not as a standalone, all-encompassing system. Its true power is unlocked when integrated with other analytical methods.
👉 Input Calibration Essential: The efficacy and depth of insights derived from the "Hive Bars" are highly dependent on the careful and thoughtful calibration of its input parameters, including the "Internal EMA Config," "Hive Smoothing" setting. Optimal results necessitate empirical user experimentation and fine-tuning to discover the configurations best suited for specific assets, analytical objectives, and market conditions.
👉 Exclusion of Auxiliary Data: The "Hive Bars" indicator's primary focus is exclusively on transforming and presenting price data. It does not natively incorporate other vital market information such as fundamental economic data, or news events. Integrating these additional analytical layers remains an essential aspect of constructing a truly comprehensive and robust trading strategy.
█ ▒▒▒▒▒▒▒▒▒▒▒▒▒▒▒▒▒▒▒▒▒▒▒ 『•••• ✎ ••••』 ▒▒▒▒▒▒▒▒▒▒▒▒▒▒▒▒▒▒▒▒▒▒▒▒ █
🎯 CONCLUSION
The "Hive Bars" indicator offers an unparalleled, intuitively accessible, and highly adaptable framework for instantly grasping true price momentum and direction through its intelligent, non-repainting reconstruction of market data. By transforming chaotic raw data into strikingly clear, high-conviction "Hive Bars" and dynamic signals, and now with proactive alerts to highlight critical moments, it empowers you to cut through distractions and identify market currents with unprecedented ease. Think of it as a custom lens for the market. It filters out the clutter and shows you the real structure—bars formed not by time, but by intent. It's about seeing the unseen, with enhanced clarity and a deeper understanding of market forces, now with the power to supercharge all your other tools and keep you informed. No fluff. No hype. Just an edge you can actually see—and use.
▣▣▣▣▣▣▣▣▣▣▣▣▣▣▣▣▣▣▣▣▣▣▣▣▣▣▣▣▣▣▣▣▣▣▣▣▣▣▣▣▣▣▣▣▣▣▣▣▣▣▣
🚨 RISK DISCLAIMER
Engagement in financial market speculation inherently carries a substantial degree of inherent risk, and the potential for capital diminution, potentially exceeding initial deposits, is a pervasive and non-trivial consideration. All content, algorithmic tools, scripts, articles, and educational materials disseminated by "Hive Bars" are exclusively purposed for informational and pedagogical objectives, strictly for reference. Historical performance data, whether explicitly demonstrated or implicitly suggested, offers no infallible assurance or guarantee of future outcomes. Users bear sole and ultimate accountability for their individual trading decisions and are emphatically urged to meticulously assess their financial disposition, risk tolerance parameters, and conduct independent due diligence prior to engaging in any speculative activity.
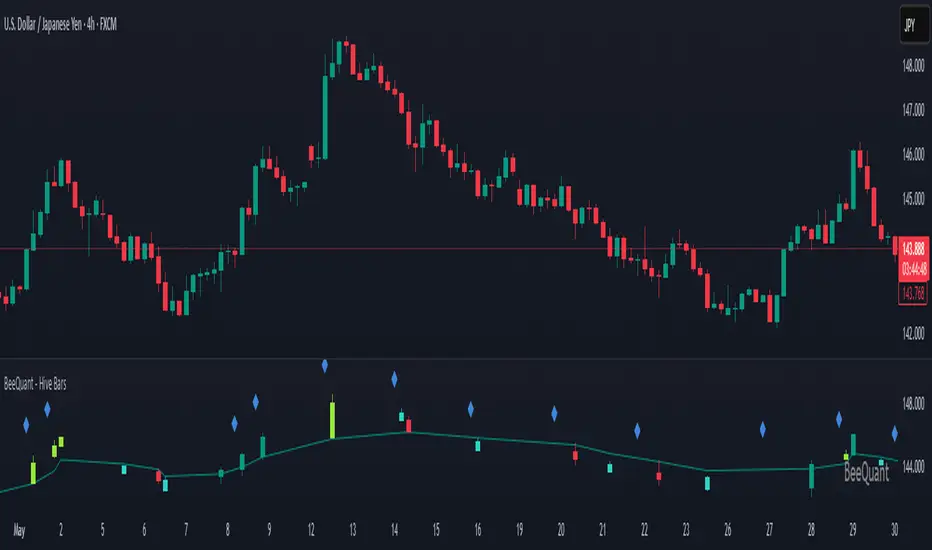
Trend Bars Pro (HTF PO3)Hello Traders!
The innovative TRN Trend Bars Pro are designed to help traders to analyze markets in an intuitive way and provide high probability entry and exit signals. It combines three core concepts:
TRN Trend Bars to see the current trend and reversals (replaces the default chart bars)
Bar Ranges to highlight consolidations
Dynamic Trend to see the overall trend.
First, let's have a look at each of these concepts individually. Afterwards, we describe how a combination of all three gives you a crystal-clear picture of the market.
TRN Trend Bars Pro
They show bullish and bearish trends and reversals based on color coding the bars and give high probability trade opportunities with special colors. The trend analysis is based on a new algorithm that includes several different inputs:
classical and advanced bar patterns and their statistical frequency
probability distributions of price expansions after certain bar patterns
bar information such as wick length in %, overlapping of the previous bar in % and many more
historical trend and consolidation analysis
The algorithm weighs these concepts and outputs a color scheme for the chart bars or candlesticks.
Bar Types
Trend bars in green and red
Reversal Bars in blue and fuchsia
Continuation Bars in turquoise and orange
Breakout Bars in dark green and pink
Green Bars signify a sustained uptrend, indicating bullish market sentiment. On the other hand, Red Bars indicate a persistent downtrend, representing bearish market sentiment. The transition from red to green denotes a bullish trend reversal, suggesting a shift from bearish to bullish sentiment. Conversely, the shift from green to red signals a bearish trend reversal, indicating a transition from bullish to bearish sentiment. By monitoring these color changes, traders can identify potential trend reversals and make informed trading decisions.
The presence of gray and black bars indicates a neutral market state, often observed before an impending color change from red to green or green to red. These neutral bars serve as a transition phase between the previous trend and the potential reversal.
The TRN Trend Bars Pro incorporate signal bars, distinguished by their distinct colors, to offer potential buy and sell signals and deeper insights into market dynamics.
Reversal Bars
The presence of blue Reversal Bars indicates a trend reversal to the upside, while pink Reversal Bars indicate a reversal to the downside. These bars not only serve as signals for potential trend shifts but also present favorable opportunities to enter the market or increase one's position size.
Continuation Bars
In addition to the reversal bars, the indicator also includes bullish continuation bars (colored turquoise) and bearish continuation bars (colored orange). These bars act as signals for the continuation of an existing trend. Like the reversal bars, they can be utilized as entry points or opportunities to augment one's position size.
Breakout Bars
The dark green breakout bars within TRN Trend Bars Pro show a powerful breakout from a price range detected by our integrated bar range feature. They signify the continuation or potential change in a trend following a consolidation phase. As such, these bars hold dual functionality, serving as reversal signals and validating the persistence of an ongoing trend.
Bar Ranges
The bar range feature automatically finds consolidations where the price range of several consecutives bars is rather small. The detection of the bar ranges includes among other things the overlapping percentage of these bars.
How to Use Price Ranges
Here are a few ways you can use the bar ranges in your trading:
Identify Support and Resistance Levels
The price ranges can help you identify key support and resistance levels on a chart. By observing price ranges and identifying these levels, you can make more informed decisions about entering or exiting trades.
Breakout Trading
Price ranges can also provide insights into potential breakout opportunities. Breakouts occur when the price breaks out of a defined range, signaling a potential shift in market sentiment and the start of a new trend. The Color highlighted Breakout Bars from the TRN Trend Bars Pro are signaling a powerful breakout of a price range. Traders can enter positions in the direction of the breakout and set appropriate stop-loss orders to manage risk. Note that not every price range is left by a powerful breakout.
Dynamic Trend
The Dynamic Trend combines elements from standard trend strength indicators (e.g. DI-, DI+, Parabolic SAR) and volatility indicators (e.g. ATR, Standard Deviation). It produces a moving average line that adapts to changing market volatility. It is inspired by the ideas of the programmer and trader Fat Tails. The adaptive behavior provides more relevant information for traders when compared to traditional moving averages which do not consider volatility and trend strength together. This makes the Dynamic Trend completely unique, and no other moving average indicator can give you this precision.
How to use Dynamic Trend
Generally, a rising Dynamic Trend line, displayed in green, indicates that an uptrend is strong, while a falling Dynamic Trend, displayed in red, suggests that the downtrend is sharp. The Dynamic Trend turns gray when there is insufficient clarity to establish a distinct trend and especially when there is not volatility in the market.
Identify potential trade entries and exits: When used in conjunction with price action, the Dynamic Trend can provide potential trade signals. For example, if the price crosses above the Dynamic Trend, it may be a bullish sign, suggesting a potential buy entry. Conversely, if the price crosses below the Dynamic Trend, it may indicate bearish conditions and a potential sell signal.
Trend Identification and Pullback trading
Observe the Dynamic Trend's color. When it's on the rise and appears green, it indicates a bullish trend. Conversely, if it's in decline and displayed in red, it signals a bearish trend.
If Dynamic Trend is green and price pulls from above back to the Dynamic Trend, then this can be considered as a bullish signal.
If Dynamic Trend is red and price pulls from below back to the Dynamic Trend, then this can be considered as a bearish signal.
In the event of a bearish signal, such as a bearish TRN Signal Bar, and the Dynamic Trend is red, it provides additional confirmation to the bearish signal. Likewise, bullish signals gain added conviction when the Dynamic Trend is green.
Crossovers
As with other moving averages, crossovers between the Dynamic Trend and the price can be significant.
If price is crossing above the Dynamic Trend, then this can be considered as a bullish signal.
If price is crossing below the Dynamic Trend, then this can be considered as a bearish signal.
If you currently hold a position, both bullish and bearish crossovers can serve as potential exit signals. For instance, in the case of a long position, a bearish crossover can indicate a potential shift in sentiment, signaling a bearish reversal and a potential opportunity to close your long position.
Filtering Noise
Due to its adaptive nature, the Dynamic Trend can be a useful tool to filter out market noise. When the market is choppy or consolidating, the Dynamic Trend tends to remain flat and colored gray, signaling traders to potentially stay out of the market.
Stop Losses
The Dynamic Trend can also be used as a dynamic stop loss. For instance, in a long trade, traders can use the Dynamic Trend as a trailing stop, selling their position if the price crosses below the Dynamic Trend.
Combining TRN Trend Bars Pro, Bar Ranges and Dynamic Trend together
Combining all three concepts gives you a crystal-clear picture of the market. The Dynamic Trend shows you the overall trend. If price pulls back to the dynamic trend line and then price picks up the trend direction again, then the TRN Trend Bars Pro immediately switches the color to the trend direction. Therefore, you can easily identify high probability entry signals based on the bar color.
As a simple trading model, you can set the stop loss below the last swing or below a TRN signal bar (vice versa for short entries) and use 2.5 R or 3 R as target.
You can increase the success rate of the high probability TRN signal bars entries even more if they are in line with the Dynamic Trend line.
On the other hand, the TRN Bar Ranges help you to stay out of the market in case the price does not really change. As a confluence signal to stay flat in this period the dynamic trend line tends to be grey as well. If the price breaks out of the range, then the indicator prints a breakout bar which serves as a high probability entry signal.
Although it is possible to switch off any of these concepts, it is highly recommended to use all three in combination to get a crystal-clear picture of the market.
Alerts
Experience the power of our TRN Trend Bars Pro alerts, delivering real-time notifications for trend changes, price range breakouts, and signal bar formations or confirmations. Stay on top of the market with these versatile alerts, customizable to your preferred assets and timeframes.
Conclusion
While signals from TRN Trend Bars Pro can be informative, it is important to recognize that their reliability may vary. Various external factors can impact market prices, and it is essential to consider your risk tolerance and investment goals when executing trades.
Risk Disclaimer
The content, tools, scripts, articles, and educational resources offered by TRN Trading are intended solely for informational and educational purposes. Remember, past performance does not ensure future outcomes.

(Quartile Vol.; Vol. Aggregation; Range US Bars; Gaps) [Kioseff]Hello!
This indicator is a multifaceted tool that's, hopefully, useful for price action and volume analysis.
(This script makes use of the newly introduced "text_font" parameter)
With this script you'll have access to:
Range US Chart
Volume Aggregation Chart
Gaps Chart
Volume by Quartile
Consequently, you'll have access to:
First Quartile Volume Threshold
Second Quartile Volume Threshold
Third Quartile Volume Threshold
90th Percentile Volume Threshold
Fourth Quartile Volume Threshold
Q2 - Q1 Dispersion
Q3 - Q2 Dispersion
Q4 - Q3 Dispersion
Quartile Deviation
Interquartile Range
Avg. "n" bar return following "high" volume
Avg. "n" bar positive return following "high" volume
Avg. "n" bar negative following "high" volume
# of Positive Returns Following a Gap
# of Negative Returns Following a Gap
# of Gaps
# of Up Gaps
# of Down Gaps
Average # of bars to fill Up Gaps
Average # of bars to dill Down Gaps
Average Gap Up % increase
Average Gap Down % decrease
Cumulative % increase of all Up Gaps
Cumulative % decrease of all Down Gaps
Sort gaps by distance from price
Hide gaps that price substantially deviates from (gaps will reappear when price trades near the gap)
Segment Range US bars by date
Manually configure Range US price thresholds
Identify "congestion" areas with Range US bars
Range US Levels that must be exceeded for a new Range US bar to produce
Manually configure cumulative volume threshold for Volume Aggregation bars
Segment Volume Aggregation bars by date
Largest Volume Aggregation bar increases
Largest Volume Aggregation bar decreases
Calculate log returns after "high" volume sessions
Quartile Volume
The Quartile Volume portion of the script segments price/volume intervals by quartile.
The image above shows features of the indicator.
For statistics, the following metrics are recorded:
First Quartile
Second Quartile
Third Quartile
90th Percentile
Fourth Quartile
Q2 - Q1 Dispersion
Q3 - Q2 Dispersion
Q4 - Q3 Dispersion
Quartile Deviation
Interquartile Range
Color-coordinated price bars (by volume quartiles)
The percent rank for the volume of the current bar
Avg. "n" bar return following "high" volume
Avg. "n" bar positive return following "high" volume
Avg. "n" bar negative following "high" volume
The script colors bars via gradient.
By default, bars are colored lime when volume for the interval is "high" (exceeds upper quartile thresholds). The greener the bar, the higher the volume for the interval.
Bars are colored red when volume for the interval is "low" (fails to exceed lower quartile thresholds). The redder the bar, the lower the volume for the interval.
Naturally, brownish-colored bars reflect a volume interval that concluded near the median.
The image above exemplifies the process. This feature might be useful to categorize / objectively define high-volume clusters, low-volume clusters, high-volume price moves, low-volume price moves, etc.
For greater precision, you can select to color bars by volume quartile they belong to.
The image above shows color-coordinated price bars. More details shown in the image.
Additionally, you can select to plot the quartile/percentile that a price bar belongs to on the chart.
The image above shows price bars numbered by the volume quartile they belong to.
The script will distinguish successive 90th percentile violations, superimpose a linear regression channel atop the data sequence, and record pertinent statistics.
The image above shows the process.
Lastly, the user can plot an anchored VWAP using a built-in time function.
The image above shows the anchored VWAP.
Range US Chart
A Range US chart operates irrespective of time and volume - simply - bars produce after a user-defined price move is achieved/exceeded in either direction. A range us chart produces “trend candles” and “reversal candles”. A reversal candle always moves against the most immediate bar; a trend candle always moves in favor of the most immediate bar. The user defines the dollar amount price must travel up/down for a trend candle to fulfill, and for a reversal candle to fulfill.
Note: if a “down reversal” candle (red) Is produced, it’s impossible for the next candle to also be a down reversal candle - for the downside move to continue the criteria for a down trend candle must be fulfilled. Similarly, if an “up reversal” candle (green) Is produced, it’s impossible for the next candle to also be an up reversal candle - for the upside move to continue, the criteria for an uptrend trend candle must be fulfilled. Consequently, Range US bars frequently trade at the same level for extended periods. This is intentional, as this chart type is theorized to “filter noise” (whether Range US charts fulfill this theory is to your discretion).
Lastly, if an up trend candle (green) is produced, the next candle cannot be up a reversal up candle - only a trend up candle or reversal down candle can produce - vice versa for a trend down candle (the subsequent candle cannot be a reversal down candle). In this sense, an uptrend continues on successive trend up candles; a down trend continues on successive trend down candles.
The image above exemplifies Range US chart functionality.
The lower-right stats table shows the requisite price move for a "Trend" candle to produce and for a "Reversal" candle to produce.
The default settings for this chart time automatically calculate the required "Trend" candle price move and the required "Reversal" candle price move. However, both settings are configurable.
The image above shows manually configured parameters for a trend bar and reversal bar to produce. This feature allows the user to replicate the Range US chart hosted on extrinsic charting platforms.
However, please consider that this script does not use tick data; 1-minute OHLC data is used for calculations.
Consequently, configuring the trend bar and reversal bar requirement too low may return inaccurate data. For instance, if you set trend candles to form after a $1 price move then trend candles will form if price moves up $1 from a green Range US bar or down $1 from a red Range US bar. This is sufficient for lower priced assets; however, if you were trading, for instance, Bitcoin - a $1 price move can happen numerous times in one minute. This script can’t plot bars and record data until a 1-minute bar closes and a new 1-minute bar opens. Further, if Bitcoin moves up $1 twenty times and down $1 twenty times in a 1-minute bar - your Range US chart will record such variations as one price move. This data is inaccurate and likely useless.
To counter this quandary, a warning message will appear if you configure trend bar price moves or reversal bar price moves too low.
The image above shows the concealable warning message.
The image above is a flow diagram (made with shaky hands) illustrating the Range US bar formation process.
A google search will return additional information on the Range US chart type.
Volume Aggregation Bars
TradingView user and member of the TradingView Discord server @ferreirajames informed me of the Volume Aggregation chart type. The user commented in the "Suggestions" channel for the TradingView Discord server asking for the Volume Aggregation chart type. As an interim fix, I tried my hand at recreating the process, which is available in this script.
Similar to the Range US chart type, Volume Aggregation bars aren’t bound to a time-axis; the bars form after a user-defined, cumulative amount of volume is achieved or exceeded. Consequently, once the cumulative amount of volume is achieved or exceeded - a bar is produced at the corresponding price level.
Underlying theory: The chat type is conducive to identifying price levels where traders are “trapped”. Whether the process adequately distinguishes this circumstance is to your discretion.
The image above exemplifies the Volume Aggregation chart type.
Regardless of the current price, Volume Aggregation bars for after a requisite amount of volume is achieved/exceeded. Tick data isn't used; therefore, remainder values are carry over.
By default, the script automatically calculates a proportional cumulative volume total to dictate the formation of Volume Aggregation bars. However, the cumulative threshold is configurable.
The image above shows Volume Aggregation bars forming subsequent a user-defined cumulative volume total being exceeded.
Note: This chart type uses OHLC data from the timeframe of your chart. Therefore, for instance, setting the volume threshold too low will produce inaccurate, useless data.
A warning message will appear for such occurrence.
Gaps
The indicator incorporates a "Gaps" chart type.
The image above shows accompanying features.
A list of all unfilled gaps is accessible - gaps for this list are sorted by distance from current price.
Partially filled gaps are displayed in the corresponding gap box - the percentage amount the gap was filled is also displayed.
Gap statistics show:
# of Gaps
# of Up Gaps
# of Down Gaps
Average # of bars to fill Up Gaps
Average # of bars to dill Down Gaps
Average Gap Up % increase
Average Gap Down % decrease
Cumulative % increase of all Up Gaps
Cumulative % decrease of all Down Gaps
Naturally, there may be gaps formed thousands of bars ago that aren't close to price. Showing these gaps on the chart will "scrunch" the y-axis and make prices indistinguishable.
I've added a setting that allows the user to hide gaps that are "n" % away from the current price. The gap, if unfilled, will reappear when price trades within the user-defined percentage.
The image above shows an example. There's an unfilled down gap that's "hidden" because the current price is a further % away from price than what I've specified in the settings (1%). When prices trade back within 1% of the gap - it will reappear.
The image above shows the process in action. Prices moved back within 1% (can be any %) of the gap; therefore, it reappeared on the chart.
You can also set the % distance a gap must achieve for it to be considered a gap, recorded and plotted. Additionally, you can select to "visualize" gaps. Similar to the Range US chart and the Volume Aggregation chart, this setting will bars reflecting the most recent sequence of gaps - date and percentage distance of the gap are superimposed atop the bar.
Let me know if there's anything else you'd like included!
Note: The initial compilation time for this script is.... high. However, once the script's compiled, calculation load times are quick and you can sift through assets and timeframes relatively quick.
There's also a setting to "Improve Load Times" in the user-inputs table. This setting only improves the load times for post-compilation calculations and plots. The initial compilation load time is unchanged. Simply, once the indicator has "first loaded", all subsequent loads are quick.
Thank you! (:

Emmanuel Optuma Bar Colors v2This script colours TradingView’s Bar Chart to follow a simple, powerful bar-type logic used in Optuma-style analysis.
It makes the chart easier to read by showing the relationship between:
Up bars
Down bars
Outside bars
Inside bars
🔍 Bar Type Detection
Up Bar
Close > Previous close
→ Indicates upward strength
→ Coloured Green
Down Bar
Close < Previous close
→ Indicates downward pressure
→ Coloured Red
Outside Bar
High > Previous high and Low < Previous low
→ Market expands its range
→ Coloured Blue
Inside Bar
High < Previous high and Low > Previous low
→ Market contracts inside the previous bar
→ Follows previous bar’s colour
🎨 Colour Rules Summary
Bar Type Colour Meaning
Up Bar 🟩 Green Bullish pressure
Down Bar 🟥 Red Bearish pressure
Outside Bar 🔵 Blue Range expansion, bar resets structure
Inside Bar Same as previous bar Market indecision, continuation
🧠 Inside Bar Logic (Very Important)
Inside bars always copy the colour of the previous bar, which means:
If the previous bar was Green → inside bar becomes Green
If the previous bar was Red → inside bar becomes Red
If the previous bar was Blue → inside bar becomes Blue
This keeps the structure visually consistent and easy to read.
📈 Why This Helps Traders
This approach makes it easier to see:
✔ Trend continuation
Inside bars keep the trend colour, making swings clearer.
✔ Trend weakness
Inside bars after outside bars show contraction.
✔ Breakouts
Blue outside bars stand out as moments of range expansion.
✔ Market rhythm
The chart becomes easier to follow for beginners and advanced traders.
🧩 How to Use It
Set chart type to Bars
Add the script
Hide default colours (barcolor replaces them)
This instantly transforms TradingView into a teaching-friendly chart like Optuma.

Trapper Magnifying Glass - Bar Decomposer — Last Visible BarHeadline
Decompose any higher-timeframe bar into lower-timeframe candles directly on the chart. Zoom/pan reactive, session-accurate, auto-fit inset, and compliant with TradingView placement limits.
Quick Start
Add the indicator and choose a Child TF (minutes) (e.g., 1, 5, 10, 15).
The inset follows the last visible bar on your screen. Adjust Right separation / Mini width / Gap / Vertical exaggeration as needed.
Leave Show HUD label OFF by default. Turn it on only if you want a compact readout.
Overview
This tool draws a miniature, on-chart inset of lower-timeframe candles that make up the currently viewed higher-timeframe bar. It stays on the main price chart (not in a separate pane), respects zoom/pan, compresses itself to fit available space, and adheres to TradingView’s 500-bar object placement limit.
The design goal is micro-structure inspection without changing the chart timeframe.
What Makes It Different
On-chart inset (not a separate indicator panel) for true visual context.
Zoom/Pan reactive to the last visible bar — works naturally as you navigate.
Auto-fit logic keeps the inset readable while staying inside TradingView’s future-bars limit.
Session-accurate decomposition: uses TradingView’s own lower-timeframe OHLC, exactly within the parent bar’s time window.
Strictly compliant: no synthetic bars, no repaint tricks, no lookahead.
How It Works
Child data is fetched with request.security_lower_tf(syminfo.tickerid, , open/high/low/close).
Only closed lower-TF bars inside the parent bar’s time window are returned by TradingView.
The script maps each child bar to an inset candle (body + wick) scaled to the parent bar’s price range and placed to the right of the parent’s position.
The inset tracks the last visible bar so it always stays relevant to what you’re inspecting.
Inputs (Defaults)
Timeframes
Child TF (minutes): 1 (min 1, max 1440)
Layout
Right separation (bars): 10
Mini candle width (bars): 2
Gap between mini candles (bars): 0
Vertical exaggeration ×: 1.6
Auto-Fit
Auto-fit inset width: ON
Max bars ahead to use: 120
Minimum mini width: 1
Minimum gap: 0
Style
Bull/Bear colors: ON
Body Bull / Body Bear / Wick Bull / Wick Bear: configurable
Body Fill Opacity (0–100): 12
Outline color: dark grey
Outline width: 1
Wick width: 2
HUD
Show HUD label: OFF (recommended default; enable only when you need a summary)
Session Behavior (Important)
TradingView constructs bars strictly by exchange sessions. For US equities (regular session 09:30–16:00, 390 minutes):
On a 1h chart you will see 7 bars per day:
09:30–10:00 (30 minutes)
10:00–11:00, 11:00–12:00, 12:00–13:00, 13:00–14:00, 14:00–15:00 (five full hours)
15:00–16:00 (full hour)
Decomposing the 09:30–10:00 bar into 1m returns 30 minis (not 60).
Decomposing 10:00–11:00 returns 60 minis, as expected.
The last hour (15:00–16:00) decomposes to 60 minis once they exist (i.e., immediately after each child bar closes). If you are mid-session, you will see only the minis that have closed so far.
This is by design and ensures the inset reflects the true lower-timeframe structure TradingView has for that exact bar window. Nothing is synthesized.
Live vs Confirmed Bars
Confirmed bars (historical) always decompose to a full, correct count of child minis for that parent window.
Live bars (currently forming) only return child minis that have already closed. Mid-hour on a 1h chart with 10m children, you might see 3, 4, or 5 minis depending on elapsed time.
This script’s default experience focuses on the last visible bar and displays whatever the platform provides at that moment. The HUD (when enabled) includes the parent bar duration in minutes to make short session bars explicit.
Auto-Fit and Placement Limits
TradingView prevents drawing objects beyond 500 bars into the future. The inset’s right edge is automatically clamped to stay within that boundary. If the requested number of minis would overflow the allowed space, the script proportionally compresses mini width/gap (down to your configured minimums). If necessary, it draws only as many minis as safely fit — favoring stability over clutter.
Styling Tips
For dense decompositions (e.g., 1m inside 1h), set:
Mini width = 1, Gap = 0, Auto-fit = ON, Right separation = 7–12.
Increase Vertical exaggeration to highlight wick-to-body differences when the parent bar is narrow.
Keep HUD OFF for publishing and screenshots unless you’re highlighting counts or session duration.
Notes & Limitations
Child arrays show closed bars only. No forming mini is displayed to avoid misleading totals.
If you reload a chart or switch symbols/timeframes, the most recent confirmed bar’s arrays may be empty on the very first calculation frame; the script guards against this and will draw on the next update.
The tool is an overlay visualization, not a signal generator; there are no alerts or trading advice.
Performance: heavy decompositions on very fast symbols/timeframes can add many objects. Auto-fit and minimal widths help.
Compliance
Uses only native TradingView data (request.security_lower_tf).
No repainting and no lookahead.
No external feeds, synthetic candles, or hidden calculations that would misrepresent the underlying data.
Fully respects TradingView’s object placement constraints.
Recommended Defaults (for broad usability)
Child TF: 5 or 15 (depending on your HTF).
Right separation: 7–12
Mini width / Gap: 2 / 0 for clarity, 1 / 0 for dense fits.
Auto-fit: ON
HUD: OFF
Troubleshooting
“Why aren’t there 60 one-minute minis in this 1h bar?”
Either the parent bar is a session-short bar (09:30–10:00 = 30 minutes) or you are viewing a live bar mid-hour; only closed minis appear.
Inset clipped or not visible to the right:
Increase Max bars ahead to use (Auto-Fit group), reduce Mini width/Gap, or reduce Right separation.
Nothing draws on first load:
Wait for the next bar update, or navigate the chart so the last visible bar changes; arrays refresh as data becomes available.
Change Log
v1.0 – Initial public release.
On-chart inset, zoom/pan reactive, auto-fit width.
Session-accurate lower-TF decomposition.
HUD label toggle (off by default) with child TF, bar count, and parent duration.
Hardened array handling for confirmed snapshots.
Disclaimer
This script is provided strictly for educational and informational purposes only.
It does not constitute financial advice, investment advice, trading signals, or a recommendation to buy or sell any security, asset, or instrument. Trading and investing involve risk; always do your own research and consult with a licensed financial professional before making decisions.
High Threshold Volume BarHigh Threshold Volume Bar (HP Vol Bar) has the following features highlighted below.
Overview:
The High Threshold Volume Bar (HP Vol Bar) is an advanced technical analysis tool designed to identify statistically significant price bars based on volume, range, and trend dynamics. It helps traders spot high-probability continuation or reversal setups by analyzing bar size relative to historical volatility, volume spikes, and trend strength.
Key Features
1. Adaptive Threshold Detection
.Uses standard deviation bands and moving averages to dynamically adjust the significance threshold based on recent market conditions.
.Bars exceeding this threshold are flagged as "significant" and color-coded for easy identification.
2. Volume & Range Normalization
.Adjusts bar size calculations by factoring in volume spikes (relative to SMA-smoothed volume) and full price range (high-low or just body size).
.Prevents false signals by capping extreme volume outliers.
3. Trend Strength & Direction
Incorporates Directional Movement (DMI) to assess trend strength.
Classifies signals as continuation or reversal based on trend alignment.
4. Percentile Ranking
.Compares current bar size against a lookback period (default: 100 bars) to determine its statistical rarity (top 20% = high significance).
5. Consecutive Signal Filtering
.Requires multiple consecutive significant bars (configurable) to confirm high-probability setups, reducing noise.
6. Visual & Alert System
.Color-coded bars:
.Blue (Bullish Continuation) / Pink (Bearish Continuation) for high-probability signals.
.Teal (Bullish) / Maroon (Bearish) for significant but unconfirmed bars.
.Info Table: Displays real-time metrics (signal type, percentile, trend strength, volatility regime).
.Alerts: Triggers when a high-probability sequence is detected.
Input Parameters
1. Parameter Description Default
2. SMA Length Smoothing period for average bar size. 50
3. Standard Deviation Period Lookback for volatility calculation. 20
4. Standard Deviation Multiplier Adjusts sensitivity of threshold. 2.5
5. Factor in Volume Normalizes bar size using volume. true
6. Use Full Range Measures high-low instead of open-close. true
7. Min Consecutive Bars Required confirmations for high-probability signals. 2
8. Historical Comparison Period Lookback for percentile ranking. 100
9. Trend Strength Period Smoothing for DMI-based trend assessment. 14
How It Works
1. Calculates Bar Size:
.Uses either full range (high-low) or body size (open-close).
.Adjusts for volume spikes via EMA-normalized volume.
2. Determines Significance:
.Bar size must exceed:
.Adaptive threshold = SMA + (StdDev × Multiplier × Volatility Factor).
.Percentile rank > 80% (top 20% of recent bars).
.Trend strength > 20% (DMI-derived).
3. Classifies Signals:
.Continuation: Significant bar aligns with prior trend.
.Reversal: Significant bar contradicts prior trend.
4. Confirms High-Probability Setups:
.Requires consecutive significant bars (user-defined) to filter noise.
7. Usage Guidelines
.Bullish Signals: Look for blue bars (confirmed) or teal bars (unconfirmed) in uptrends.
.Bearish Signals: Look for pink bars (confirmed) or maroon bars (unconfirmed) in downtrends.
.Alerts: Use built-in alerts to notify when a high-probability sequence forms.
.Combine With: Support/resistance levels, candlestick patterns, or momentum oscillators for confluence.
8. Why This Script?
.Dynamic Adaptation: Adjusts to changing volatility and volume regimes.
.Statistical Rigor: Uses percentile ranking to avoid overfitting.
.Clear Visuals: Intuitive color-coding and table for quick analysis.
Note: This is a closed-source script, but the logic is transparently explained to ensure traders understand its methodology.
How to Use "High Threshold Volume Bar" for Trade Entries
The HP Vol Bar indicator identifies high-probability trade setups based on statistically significant price bars. Here’s how to use it for entries, exits, and trade management:
1. Trade Entry Rules (Table Values to consider to trade)
A) Bullish Continuation Setup (Trend Following)
Conditions:
✅Signal Status: Active
✅ Signal Type: bullish_cont (Blue,Teal bar)
✅Size percentile: 90%
✅ Trend Strength: > 20% (Strong trend)
✅ Consecutive Bars: ≥ 1or2
✅ Volume Regime : High
Entry:
.Buy at the close of the second (or Nth) confirmed blue bar.
.Stop Loss (SL): Below the lowest bar in the sequence.
.Take Profit (TP):
1.5× to 2× the bar size (adaptive to volatility).
Example:
Bearish Continuation Example
B) Bearish Continuation Setup (Trend Following)
Conditions:
✅Signal Status: Active
✅ Signal Type: bearish_cont (Pink bar)
✅Size percentile: 90%
✅ Trend Strength: > 20%
✅ Consecutive Bars: ≥ 1or2
✅ Volume Regime : High
Entry:
Sell Short at the close of the second (or Nth) confirmed pink bar.
Stop Loss (SL): Above the highest bar in the sequence.
Take Profit (TP): Similar to bullish (1.5-2× bar size).
C) Bullish/Bearish Reversal Setup (Counter-Trend)
Conditions:
✅Signal Status: Active
✅ Signal Type: bullish_rev or bearish_rev
✅Size percentile: 90%
✅ Trend Strength: > 20%
✅ Consecutive Bars: ≥ 1or2
✅ Volume Regime : High
Entry:
Wait for confirmation (next bar closes in reversal direction).
SL: Opposite extreme of the signal bar.
Example:
Reversal Example
2. Filtering & Confluence (Improving Accuracy)
Trend Alignment: Only trade in the direction of the higher timeframe trend (e.g., use EMA 50/200)
Support/Resistance: Enter near key levels for better risk-reward.
Volume Confirmation: Avoid signals with below-average volume.
3. Advanced Strategies
A) Breakout Confirmation
If a significant bar breaks a key level, enter on retest.
Example: Blue bar breaks resistance → Buy on pullback.
B) Mean Reversion (Range Markets)
Use low volatility mode (volRegimeText = "LOW") + reversal signals.
Fade extreme moves back to the mean (e.g., SMA).

Bullish/Bearish Reversal Bars Indicator [Skyrexio]Introduction
Bullish/Bearish Reversal Bars Indicator leverages the combination of candlestick reversal bar pattern and the Williams Alligator indicator to help traders in understanding where there is a high probability of market reversal or correction. Indicator works for both bearish and bullish cases. It visualizes the bearish and bullish reversal bars with red and green dots and also plots the Alligator's lips to make it more convenient for traders to understand if price is above or below lips line (more information in "Methodology and it's justification" paragraph).
Features
Market Facilitation Index(MFI) filter: with the specified parameter in settings user can choose to filter bullish and bearish reversal bars which passed the MFI condition.
Awesome Oscillator(AO) filter: with the specified parameter in settings user can choose to filter bullish and bearish reversal bars which passed the AO condition.
Alerts: user can set up the alert and have notifications when bullish/bearish reversal bar has been printed.
Methodology and it's justification
In the script’s methodology, we apply the concepts of bullish and bearish reversal bars introduced by Bill Williams in his book Trading Chaos. So, what exactly is a bullish or bearish reversal bar? At its core, it’s a candlestick pattern. A bullish reversal bar is a bar that closes in its upper half, while a bearish reversal bar closes in its lower half.
Why is this type of bar significant? Let’s look at the bullish reversal bar as an example. When the price is trending upward, forming higher highs with each candle, and we suddenly see a bullish bar that makes a new high but ultimately closes in its lower half, it signals a shift in control. Bears have taken control toward the end of that candle's period, pushing the price back down. This can be interpreted as a sign of trend weakness and a potential reversal (or at least a correction).
An additional key point is that a reversal bar often indicates a possible end to the trend. Therefore, for a reversal bar to be valid, several preceding candles should show lower highs (for bullish bars) or higher lows (for bearish bars), reinforcing the likelihood of a trend change.
The second step on methodology is the location of the bar related to Williams Alligator. The Williams Alligator Indicator, developed by Bill Williams, is a technical analysis tool that helps traders identify trends and potential turning points in the market. It consists of three lines, often called the jaw, teeth, and lips of the alligator, each representing different moving averages:
Jaw (Blue Line): A slower moving average, typically a 13-period smoothed moving average shifted 8 bars into the future.
Teeth (Red Line): A medium moving average, typically an 8-period smoothed moving average shifted 5 bars into the future.
Lips (Green Line): A faster moving average, usually a 5-period smoothed moving average shifted 3 bars into the future.
When the three lines are spread out and moving in the same direction, it suggests a strong trend (the "alligator" is "awake and feeding"). When they intertwine, the indicator suggests that the market is moving sideways, or in a range, signaling a lack of clear trend (the "alligator" is "sleeping"). Traders use the Alligator Indicator to enter trades in trending markets and avoid trades in choppy, non-trending markets.
If bullish reversal bar's high is not below and bearish reversal bar's low is not above all three Alligator's lines (jaw, lips, teeth) they cannot be interpreted as these types of bars. It can be explained as following: if we are waiting for the bullish reversal bar it shall be reversal from downtrend. If price is not below all three lines it can't be interpret as the downtrend according to this method. The opposite is true for the bearish reversal bar.
All described above are obligatory conditions for reversal bar, now let's discuss two not obligatory conditions. The first one is Market Facilitation Index (MFI) restriction. Let's briefly look what is MFI. The Market Facilitation Index (MFI) is a technical indicator that measures the price movement per unit of volume, helping traders gauge the efficiency of price movement in relation to trading volume. Here's how you can calculate it:
MFI = (High−Low)/Volume
MFI can be used in combination with volume, so we can divide 4 states. Bill Williams introduced these to help traders interpret the interaction between volume and price movement. Here’s a quick summary:
Green Window (Increased MFI & Increased Volume): Indicates strong momentum with both price and volume increasing. Often a sign of trend continuation, as both buying and selling interest are rising.
Fake Window (Increased MFI & Decreased Volume): Shows that price is moving but with lower volume, suggesting weak support for the trend. This can signal a potential end of the current trend.
Squat Window (Decreased MFI & Increased Volume): Shows high volume but little price movement, indicating a tug-of-war between buyers and sellers. This often precedes a breakout as the pressure builds.
Fade Window (Decreased MFI & Decreased Volume): Indicates a lack of interest from both buyers and sellers, leading to lower momentum. This typically happens in range-bound markets and may signal consolidation before a new move.
For our purposes we are interested in squat bars. This is the sign that volume cannot move the price easily. This type of bar increases the probability of trend reversal. In this indicator we added to enable the MFI filter of reversal bars. If potential reversal bar or two preceding bars have squat state this bar can be interpret as a reversal one.
The second additional filter is Awesome Oscillator. The Awesome Oscillator (AO), developed by Bill Williams, is a momentum indicator that measures market momentum by comparing recent price action to a longer historical context. It helps traders identify potential trend reversals and the strength of trends. Formula:
AO = SMA5(Median Price) − SMA34(Median Price)
where:
Median Price = (High + Low) / 2
SMA5 = 5-period Simple Moving Average of the Median Price
SMA 34 = 34-period Simple Moving Average of the Median Price
If AO is decreasing momentum is bearish, if increasing - bullish. According to Bill Williams approach reversal bars are the potential trades against the trend. As a result we added second filter for bullish reversal bars AO shall be decreasing, for bearish increasing.
How to use indicator
Apply it to desired chart and time frame. It works on every time frame.
Setup the filters with the "Enable MFI" and "Enable AO" checkboxes in the settings. By default they are turned on.
Analyze the price action. Indicator plotted the white line, this is the lips of an Alligator. It will help you to understand how price is moving in comparison to lips line. Indicator will print the green dot and text "BULL" below it current bar is bullish reversal. It will print the red dot and text "BEAR" above it if current bar is interpreted by algorithm as a bearish reversal.
Set up the alerts if it's needed. Indicator has two custom alerts called "Bullish reversal bar has been printed" and "Bearish reversal bar has been printed"
Disclaimer:
Educational and informational tool reflecting Skyrex commitment to informed trading. Past performance does not guarantee future results. Test indicators before live implementation.

Time - Bar StatusCandlestick analysis
The Indicator "Bar Status" will display the current open candle state and the last three close candles state based on the logic below.
Abbreviations.
OC = Open Candle (if in no state listed below)
FB = False Break
BO = Break Out
IN = Inside Bar
FBR = False Break Reversal
Logic:
OC = This is the current open candle yet to close. Its status will change as it progresses through time until close.
Green False Break Revers (FBR) = bar Close is higher than previous bar Close AND bar High is higher than previous bar High AND bar Low is lower than previous bar Low.
Green False Break (FB) = bar Close is lower than previous bar High AND bar High is higher than previous bar High.
Green Breakout (BO) = bar Close is higher than previous bar Close AND bar High is higher than previous bar High.
Green Inside Bar (IN) = bar High is lower than previous bar High AND bar Low is higher than previous bar Low.
Red False Break Revers (FBR) = bar Close is lower than previous bar Close AND bar Low is lower than previous bar Low AND bar High is Higher than previous bar High.
Red False Break (FB) = bar Close is higher than previous bar Low AND bar Low is lower than previous bar Low.
Red Breakout (BO) = bar Close is lower than previous bar Close AND bar Low is lower than previous bar Low.
Red Inside Bar (IN) = bar High is lower than previous bar High AND bar Low is higher than previous bar Low.
The end column is the current open candle/bar.
The second from the end column is the last closed candle/bar.
The third from the end column is the second closed candle/bar.
The forth from the end column is the third closed candle/bar.
=============================================================
Also Includes candle countdown timer, of various candles. i.e. 4 hour, 1 hour, 15min, 5 min.

RedK Bar Strength Inspector / Bar Strength Index (BSI)Summary
=========
The Bar Strength Inspector / Bar Strength Index (BSI) is an indicator that evaluates each price bar against a user-selectable set of "strength categories" - BSI then calculates a combined score from these categories and provides an index - plotted as a centered oscillator - roughly similar to the way Relative Strength Index (RSI) works, which can be used to evaluate the strength of price move and the possibilities of trend continuation or reversal.
Background
=============
BSI is like a Swiss-army knife with many components - so apologies upfront if this guide gets long - and i know i will still miss few pieces that needs explaining. please alert me if something is not clear.
BSI is an advanced / re-built version of my Ultimate Trader Oscillator (UTO)
I continue to believe that one of the best trading tools that i can use, is a tool that can automate the visual inspection of the price chart - a tool that simulates (and quantifies in numbers/score) the way we visually look at a certain price bar, and make a judgement that "this is a strong bar, so I expect the trend down to possibly reverse" - BSI is a an attempt to achieve that. An attempt to answer a simple question (in a quantifiable manner):
how strong / weak is this price bar - how does it compare to previous bars ? what is the average of that strength (or weakness) for the last few bars ?(based on the trader's preferred timeframe)
How does BSI work
====================
* BSI will inspect and evaluate each bar against various (selectable) strength categories.
* BSI will give a -100/+100 score against each "strength category", then combine these scores into an index and create an average of that index
* the average index (also called BSI) will be calculated for both a short and long lengths
* the short length represents "local / short-term" strength - plotted as a blue/orange line (with an additional signal line to make easier to "read")
* the long-term reflects the broader bias (sentiment) - plotted as green/red area (or mountain)
How is BSI different from UTO
=============================
- I wrote BSI from the ground up to validate each scoring calculation and the resulting outcomes - so i would consider BSI to be more accurate than UTO
- i wrote BSI in a way to make it a lot more flexible. BSI allows me to choose which category to include in the "inspection"
- the strength categories are streamlined to reflect single bar strength, strength from bar-to-bar, and relative strength (range and volume) - they have also been chosen in a way that map to commonly used Technical Analysis concepts, to increase the value of BSI and the ability to compare with other common indicators (for example, BoP, Stochastic, Relative Volume and RSI)
- added the table view - which i use mainly to track the action within the current bar - and to learn more about how to evaluate strength vs weakness with various chart patterns
- UTO still represents the foundation of this work - but i will not update UTO any longer so all changes will be applied to the BSI- i have been using both UTO and BSI to guide my trading for the past few months.
- couple of other features in BSI:
- support for instruments with no volume data (even if the user chooses volume) - number of inspection categories will show as "7" in that case
- ability to plot the individual category scores, and the total weighted score (for the selected categories) - these plots are hidden by default
- ability to see the total score for all 8 (or 7 in case no volume data) categories regardless of how many are active - but only in the table view
- ability to be used as both a lower (independent) and a top indicator (on the price chart) -- see below examples.
Structure of the BSI Strength Categories
=====================================
The first 3 inspected strength categories focus on "single bar strength", they evaluate how the bar closes compared to the low, the Balance of Power (BoP) and the relative BoP
The next 3 categories focus on evaluating the bar-to-bar strength: how the bar closes compared to the low of the 2-bar range, how the bar closes compared to prior close - and the relative "shift"
The last 2 "strength" categories evaluate the relative range of bar compared to recent average range and the relative volume.
Understanding the bar inspection & scoring approach
==================================
During inspection for each category, a score is calculated with a value between 0 to 100, then it will be made "directional" - which means that +100 represents highest possible strength score and a value of -100 is the highest possible "weakness" score
Note that a 0 score doesn't mean "weak" - but rather "neutral" - this can be a bit confusing until we get used to the way BSI scoring works.
Example: in relative volume, a bar associated with the lowest volume observed during the lookback length, will have a 0 relative volume score -- while a bar associated with the highest volume observed will have either a +100 or a -100 score (depending on whether it's an up or down bar) - same thing for relative range.. and so on
Here are the 8 strength categories evaluated by the BSI
1 Bar closing score
2 Body : Spread (BoP) ratio
3 Relative BoP
4 2-bar Closing Score
5 2-bar Shift Ratio (Shift : 2R)
6 Relative Shift
7 Relative Range
8 Relative Volume
Specific meaning of keywords / concepts (within BSI context):
======================================================
Relative : compared to recently observed values (= within Lookback # bars)
Shift : the change in closing value vs prior bar
Bar Spread : high - low
Range : True Range ..... as in the tr() Pine function, so not to be confused with "spread"
More detailed notes about scoring and calculations for each strength category are included within the code
BSI Settings:
=============
Here is a chart showing the main sections in the BSI Settings box and how to configure it to your preference
Using the BSI:
================
- I use BSI for 2 main scenarios
(1) Guiding my Day-to-day trading: the usage here is roughly similar to a volume-weighted dual-period RSI .. with a lot more options - picking and choosing between the 8 strength categories in BSI allows for 255 variations of "strength evaluations" - a trader can choose to focus only on "single bar strength" score categories, so only picks the top 3 in the settings - another trader wants to track only the strength reflected by the relative range and relative volume, so picks the lower 2 categories. another trader wants to use BSI as a volume weighted Balance of Power.. and so on. Many combinations are possible.
i have added couple of charts that explain some of the "signals" we can expect from BSI (below chart) - note that i use the "Green/Red mountain plot" as the "prevailing sentiment" - as it confirms the longer term strength (or weakness). the BSI line plot reflects the short term strength and not necessarily tied directly to how the price is moving (see example in the chart - and also compare to how RSI works)
- 2 important points here if you plan to use BSI in trading: set BSI up on a 1-min or 5-min chart and watch how it works to learn how it evaluates each bar - and always use BSI in combination with other indicators that you are familiar with to validate and confirm any signals
(Important note: do not react to the values in the table as they change in real time - i found that to be very tempting - rather look at the broader context and the flow of the BSI / sentiment) - you can also test BSI with Paper Trading in TV - it's like a new car that you need some time to get used to :)
(2) Use BSI to help learn chart / pattern analysis - watch BSI print scores against the various categories in real time to hone your chart (pattern) reading skills and how to evaluate strength of various bar shapes - for example, a bar that closes at the high but does not reach the mid point of the prior bar - strong or weak ? how about a doji or a hammer ? ...etc
Chart showing main usage scenarios
Example BSI in real time:
======================
I hope this work helps few fellow traders hone their trading skills, or help inspire other ideas - please let me know if you have feedback or suggestions.

Red and Green Ignored Bar by Oliver VelezOn this occasion I present a script that detects Ignored Red Candles and Ignored Green Candles, basically it is a Price Action event that indicates a possible continuation of the current trend and gives the opportunity to climb it with a Very tight risk, before delving into detail I would like to leave this note:
Note: the detection of this event does not guarantee that the signal will be good, the trader must have the ability to determine its quality based on aspects such as trend, maturity, support / resistance levels, expansion / contraction of the market, risk / benefit, etc, if you do not have knowledge about this you should not use this indicator since using it without a robust trading plan and experience could cause you to partially or totally lose your money, if this is your case you should train before If you try to extract money from the market, this script was created to be another tool in your trading plan in order to configure the rules at your discretion, execute them consistently and have AUTOMATIC ALERTS when the event occurs, which is where I find more value because you can have many instruments waiting for the event to be generated, in the time frame you want and without having to observe the mer When the alert is generated, the Trader should evaluate the quality of the alert and define whether or not to execute it (higher timeframes, they can give you more time to execute the operation correctly).
Let's continue….
This event was created by Oliver Velez recognized trader / mentor of price action, the event has a very interesting particularity since it allows to take a position with a very limited risk in trend movements, this achieves favorable operations of good ratio and small losses when taking An adjusted risk, if the trade works, a good ratio is quickly achieved and we agree with a key point in the “Keep small losses and big profits” trading, this makes it easier to have a positive mathematical hope when your level of Success is not very high, so leave you in the field of profitability.
THE EVENT:
The event has a bullish configuration (Ignored Red Candle) and a bearish configuration (Ignored Green Candle), below I detail the “Hard” rules (later I explain why “Hard”):
1- Last 3 bars have to be GREEN-RED-GREEN (possible bullish configuration) or RED-GREEN-RED (possible bearish configuration), the first bar is called Control Bar, the second is called Ignored Bar and the third Signal Bar as shown in the following image:
2- Be in a trend determined by simple moving averages (Slow of 20 periods and Fast of 8 periods), as a general rule you can take the direction of MA20 but the Trader has to determine if there is a trend movement or not.
3- Control bar of good range, little tail and with a body greater than 55%.
4- Ignored bar preferably narrow range, little tail and that is located in the upper 1/3 of the control bar.
5- Signal bar cannot override the minimum of the ignored bar.
6- Activation / Confirmation of event by means of signal bar in overcoming the body of the ignored bar.
Some examples of ignored bars (with “Hard” and “Flexible” rules):
Features and configuration of the indicator:
To access the indicator settings, press the wheel next to the indicator name VVI_VRI "Configuration options".
- Operation mode (Filtering Type):
• Filtering Complete: all filters activated according to the configuration below.
• Without Filtering: all filters deactivated, all VRI / VVI are displayed without any selection criteria.
• Trend Filter only: shows only VRI / VVI that are in accordance with what is set in “Trend Settings”
- Configuration Moving Averages:
• See Slow Media: slow moving average display with direction detection and color change.
• See Fast Media: display of fast moving average with direction detection and color change.
• Type: possibility to choose the type of media: DEMA, EMA, HullMA, SMA, SSMA, SSMA, TEMA, TMA, VWMA, WMA, ZEMA)
• Period: number of previous bars.
• Source: possibility to choose the type of source, open, close, high, low, hl2 hlc3, ohlc4.
• Reaction: this configuration affects the color change before a change of direction, 1 being an immediate reaction and higher values, a more delayed reaction obtaining les false "changes of direction", a value of 3 filters the direction quite well.
- Trend Configuration
• Uptrend Condition P / VRI: possibility to select any of these conditions:
o Bullish MA direction
o Quick bullish MA direction
o Slow and fast bullish MA direction
o Price higher than slow MA
o Price higher than fast MA
o Price higher than slow and fast MA
o Price higher than slow MA and bullish direction
o Price higher than fast MA and bullish direction
o Price higher than slow, fast MA and bullish direction
o No condition
• Condition P / VVI bear trend: possibility of selecting any of these conditions:
o Slow bearish MA direction
o Fast bearish MA direction
o Slow and fast bearish MA direction
o Price less than slow MA
o Price less than fast MA
o Price less than slow and fast MA
o Price lower than slow MA and bearish direction
o Price less than fast MA and bearish direction
o Price less than slow, fast MA and bearish direction
o No condition
- Control bar configuration
• Minimum body percentage%: possibility to select what body percentage the bar must have.
• Paint control bar: when selected, paint the control bar.
• See control bar label: when selected, a label with the legend BC is plotted.
- Configuration bar ignored
• Above X% of the control bar: possibility to select above what percentage of the control bar the ignored bar must be located.
• Paint ignored bar: when selected, paint the ignored bar.
- Signal bar configuration
• You cannot override the minimum of the ignored bar: when selected, the condition is added that the signal bar cannot override the minimum of the ignored bar.
• Paint signal bar: when selected, paint the signal bar.
• See arrow: when selected it shows the direction arrow of the possible movement.
• See bear and arrow: when selected it shows bear and arrow label
• See bull and arrow: when selected it shows bull and arrow label
The following image shows the ignored bar and painted signal:
- Take profit / loss
The profit / loss taking varies depending on the trader and its risk / monetary plan, the proposal is a recommendation based on the nature of the event that is to have a small risk unit (stop below the minimum of the ignored bar), look for objectives in ratios greater than 2: 1 and eliminate the risk in 1: 1 by taking the stop to BE, all parameters are configurable and are the following:
• See recommended stop loss and take profit: trace the levels of Stop, BE, TP1 and TP2, as well as their prices to know them quickly based on the assumed risk
• To: select which event you want to draw the SL and TP (VRI, VVI)
• Extend stop loss line x bars: allows extending the stop line by x number of bars
• Extend take profit line x bars: allows extending the stop line by x number of bars
• Ratio to move to break even: allows you to select the minimum ratio to move stop to break even (default 1: 1)
• Take profit 1 ratio: allows you to select the ratio for take profit 1 (default 2: 1)
• Take profit 2 ratio: allows you to select the ratio for take profit 2 (default 4: 1)
- Alerts
• It is possible to configure the following alerts:
-VRI DETECTED
-VVI DETECTED
-VRI / VVI DETECTED
Final Notes:
- The term hard rules refers to the fact that an event is sought with the rules detailed above to obtain a high quality event but this brings 2 situations to consider, less
number of events and events that are generated in a strong impulse may be leaked, a very large control bar followed by an ignored narrow body away from moving averages, despite having a good chance of continuing, taking a stop very tight in a strong impulse you can touch it by the simple fact of the own volatility at that time.
- The setting of the parameters “Minimum body percentage% (control bar)”, “Above x% of the control bar (bar ignored)” and “Cannot override the minimum of the ignored bar” can bring large Benefits in terms of number of events and that can also be of high quality, feel free to find the best configuration for your instrument to operate.
- It is recommended to look for trending events, near moving averages and at an early stage of it.
- The display of several nearby VRIs or VVIs in an advanced trend may indicate a depletion of it.
- The alerts can be worked in 2 ways: at the closing of the candle (confirms event but the risk unit may be larger or smaller) or immediately the body of the ignored bar is exceeded, in case you are operating from the mobile and miss many events because of the short time I recommend that you operate in a superior time frame to have more time.
- The indicator is configured with “flexible” rules to have more events, but without any important criteria, each trader has to look for the best configuration that suits his instrument.
- It is recommended to partially close the operation based on the ratio and always keep a part of the position to apply manual trailing stop and try to maximize profits.
The code is open feel free to use and modify it, a mention in credits is appreciated.
If you liked this SCRIPT THUMB UP!
Greetings to all, I wish you much green!

Bullish Divergent Bar DCA Strategy [Skyrexio]Overview
Bullish Divergent Bar DCA Strategy is a long-only, multi-layer Dollar-Cost Averaging (DCA) strategy that builds positions around bullish divergent bars formed below the Williams Alligator. It detects potential local bottoms and then scales into the move using up to four pyramiding entries, each with its own size and price threshold. The strategy optionally incorporates Market Facilitation Index (MFI) and Awesome Oscillator (AO) momentum to strengthen reversal confirmation and uses ATR-based take profit on the averaged entry price.
Unique Features
Layered DCA entries with equity-based sizing . It supports up to four DCA layers, where each additional layer is opened only after a configurable percentage drawdown from the first entry and position size is computed as a fraction of current equity via a geometric weighting scheme.
Optional AO and MFI confirmation . Users can require Awesome Oscillator momentum divergence, MFI/volume “squat” bars, or both to confirm that the reversal bar is accompanied by capitulation and weakening downside momentum.
ATR-based dynamic take profit . Take profit is defined as a multiple of ATR added to the current average entry price, automatically adjusting exits to prevailing volatility.
Built-in DCA visualization . The script can plot the initial entry level and all DCA thresholds to make the averaging structure and risk visually transparent on the chart.
Methodology
The core entry logic starts from a bullish divergent bar definition: the bar must close above its midpoint (close > hl2) and be the lowest low within the user-defined lookback window, flagging a local swing low. On top of this, the bar must form entirely below all three Alligator lines, ensuring that the pattern appears after a sustained downside move rather than inside noise.
If enabled, AO adds a momentum filter by requiring the Awesome Oscillator difference to be negative (descending bar on AO histogram), signaling fading downside momentum at the potential bottom. If the MFI filter is enabled, the bar (or one of the last two bars) must be a “squat” bar where spread narrows while volume increases, approximating effort vs. result exhaustion.
Once a valid bullish reversal bar is detected and the time is within the configured trading window, the strategy opens the first DCA layer using a stop entry at the bar’s high (confirmation level), only entering if price actually breaks the bar high. Additional layers (second, third, and fourth entries) are only allowed if price trades below percentage thresholds from the first entry price and a new valid bullish reversal bar forms, thereby averaging down into deep pullbacks while still requiring fresh reversal evidence.
While any DCA position is open, the strategy continuously recalculates the take profit as the current volume-weighted average entry price plus ATR multiplied by a user-defined factor. All individual entries share the same take profit level through separate strategy exit calls, so the entire stacked position exits together once price has moved sufficiently above the averaged entry.
Strategy settings
In the inputs window, users can configure the following strategy settings:
sourceUuid / secretToken: Identifiers used to format JSON alerts for automated execution through webhooks.
Trade Start Date/Time: Beginning of the backtest/live-trading window.
Trade Stop Date/Time: End of the backtest/live-trading window.
Show DCA Levels (default = false): Toggles plotting of the initial entry level and all three DCA thresholds on the chart.
Enable MFI (default = false): Enables the MFI-style volume/spread filter.
Enable AO (default = false): Enables Awesome Oscillator confirmation.
Number Of Bar For Lowest Bar (default = 7): Lookback window used to identify the lowest low bar for the bullish reversal bar condition.
Layer 2 Threshold Percent (default = 4.0): Percentage drop from the first layer price that must be reached to allow the second DCA entry.
Layer 3 Threshold Percent (default = 10.0): Percentage drop from the first layer price required to unlock the third DCA layer.
Layer 4 Threshold Percent (default = 22.0): Percentage drop from the first layer price required to unlock the fourth DCA layer.
Position Size Multiplier (default = 2.0): Multiplier used in the geometric weighting scheme to determine how much equity is allocated to each additional DCA layer.
Number Of ATR For Take Profit (default = 2.0): ATR multiple added to the current average entry price to calculate the shared take profit for all open layers.
Users can refine these parameters during backtesting to fit the volatility profile and structure of the specific asset and timeframe.
Justification of Methodology
Before understanding why this particular combination of indicator has been chosen let's briefly explain what is Williams Alligator, MFI and AO.
let’s start with the Williams Alligator. Developed by Bill Williams, the Alligator is a technical indicator that identifies trends and potential market reversals. It consists of three smoothed moving averages:
Jaw (Blue Line): The slowest of the three, based on a 13-period smoothed moving average shifted 8 bars ahead.
Teeth (Red Line): The medium-speed line, derived from an 8-period smoothed moving average shifted 5 bars forward.
Lips (Green Line): The fastest line, calculated using a 5-period smoothed moving average shifted 3 bars forward.
When the lines diverge and align in order, the "Alligator" is "awake," signaling a strong trend. When the lines overlap or intertwine, the "Alligator" is "asleep," indicating a range-bound or sideways market. This indicator helps traders determine when to enter or avoid trades.
The Awesome Oscillator (AO), developed by Bill Williams, is a momentum indicator designed to measure market momentum by contrasting recent price movements with a longer-term historical perspective. It helps traders detect potential trend reversals and assess the strength of ongoing trends.
The formula for AO is as follows:
AO = SMA5(Median Price) − SMA34(Median Price)
where:
Median Price = (High + Low) / 2
SMA5 = 5-period Simple Moving Average of the Median Price
SMA 34 = 34-period Simple Moving Average of the Median Price
The Market Facilitation Index (MFI) is a technical indicator that measures the price movement per unit of volume, helping traders gauge the efficiency of price movement in relation to trading volume. Here's how you can calculate it:
MFI = (High−Low)/Volume
MFI can be used in combination with volume, so we can divide 4 states. Bill Williams introduced these to help traders interpret the interaction between volume and price movement. Here’s a quick summary:
Green Window (Increased MFI & Increased Volume): Indicates strong momentum with both price and volume increasing. Often a sign of trend continuation, as both buying and selling interest are rising.
Fake Window (Increased MFI & Decreased Volume): Shows that price is moving but with lower volume, suggesting weak support for the trend. This can signal a potential end of the current trend.
Squat Window (Decreased MFI & Increased Volume): Shows high volume but little price movement, indicating a tug-of-war between buyers and sellers. This often precedes a breakout as the pressure builds.
Fade Window (Decreased MFI & Decreased Volume): Indicates a lack of interest from both buyers and sellers, leading to lower momentum. This typically happens in range-bound markets and may signal consolidation before a new move.
For our purposes we are interested in squat bars. This is the sign that volume cannot move the price easily. This type of bar increases the probability of trend reversal. In this indicator we added to enable the MFI filter of reversal bars. If potential divergent bar or two preceding bars have squat state this bar can be interpret as a reversal one.
The strategy intentionally focuses on bullish divergent bars forming at local lows and below the Alligator to catch potential exhaustion points in downtrends where risk/reward becomes asymmetric. The Alligator (Jaw, Teeth, Lips) acts as a dynamic structure filter: requiring price to be below all three lines before reversal helps avoid chasing minor pullbacks inside an ongoing uptrend and instead concentrates entries on deeper corrections where mean reversion potential is higher.
The custom bullish divergent bar rule (close above midpoint and being the lowest low over N bars) approximates a local capitulation candle, which often precedes short squeezes or at least strong reactions. By combining this with AO and MFI-style filters, the strategy further increases the likelihood that the pattern coincides with downside momentum(as a confirmation that current trend is downward, AO difference < 0) and effort vs. result anomalies (squat bars), which is common signatures of trend exhaustion.
The DCA structure is designed to deploy capital progressively rather than all at once: the first entry is triggered only if price confirms the reversal by breaking above the bar’s high, while subsequent layers require both a deeper discount relative to the initial entry and a new bullish reversal signal. Percentage thresholds from the first entry ensure that each additional allocation is made at meaningfully better prices, improving the blended entry level and reducing the break-even distance.
Finally, using ATR as the basis for take profit aligns exits with current volatility. A fixed-percentage target can be too tight in volatile regimes or too loose in quiet markets, whereas ATR-based targets scale with average bar range. Applying ATR to the evolving average entry price of all open layers keeps the risk/reward framework consistent across different volatility regimes and DCA configurations.
Backtest Results
Operating window: Date range of backtests is 2025.01.01 - 2026.01.01. It is chosen to let the strategy to close all opened positions.
Commission and Slippage: Includes a standard Binance commission of 0.1% and accounts for possible slippage over 5 ticks.
Initial capital: 10000 USDT
Maximum Single Position Loss: -6.56%
Maximum Single Profit: +4.92%
Net Profit: +934.08 USDT (+9.34%)
Total Trades: 121 (82.64% win rate)
Profit Factor: 2.948
Maximum Accumulated Loss: 624.72 USDT (-6.15%)
Average Profit per Trade: 7.72 USDT (+0.37%)
Average Trade Duration: 60 hours
These results are obtained with realistic parameters representing trading conditions observed at major exchanges such as Binance and with realistic trading portfolio usage parameters.
You should run your own backtests on the target asset and timeframe (for example, BTC/USDT on intraday charts) and adjust threshold percentages, layer sizing, and ATR take profit factor to match your risk tolerance and market conditions.
How to Use
Add the script to favorites for easy access.
Apply to the desired timeframe and chart.
Configure settings using the dropdown choice list in the built-in menu.
Set up alerts to automate strategy positions through web hook with the text: {{strategy.order.alert_message}}
Disclaimer:
Educational and informational tool reflecting Skyrex commitment to informed trading. Past performance does not guarantee future results. Test strategies in a simulated environment before live implementation

Session Opening Bar RangeSession Opening Bar Range (OBR) - Advanced Opening Range Indicator with Statistical Analysis
Overview
The Session First Bar Range (FBR) indicator is a comprehensive tool that captures and projects key levels based on the first bar of a user-defined trading session. Unlike traditional daily opening range indicators, this script allows traders to focus on specific session windows (New York RTH, London, Asia, etc.) and analyze price behavior relative to the initial momentum established in that session's opening bar.
What makes this indicator unique is its combination of three distinct projection methodologies: statistical analysis based on historical range data, Fibonacci extensions, and fixed-point rotation levels commonly used by institutional traders. To our knowledge, this is the only opening range indicator that incorporates statistical standard deviation levels calculated from historical first bar ranges, making it both a technical and probabilistic tool.
Core Concept
The opening range concept is based on the principle that the initial price action of a trading session often sets the tone for the remainder of that session.
Professional traders have long observed that:
The first bar's high and low act as key reference points
Price often respects or breaks these levels with significance
Expansion beyond the opening range tends to occur in measurable increments
This indicator takes these observations and enhances them with:
Historical probability analysis - "Based on the last 60 sessions, price typically extends X standard deviations beyond the opening range"
Proportional projections - Fibonacci-based extensions showing where measured moves typically target
Fixed-point rotations - Institutional rotation levels (e.g., 65 points for NQ, 15 points for ES)
How It Works
Session Detection & First Bar Capture
The indicator uses Pine Script's time() function with timezone support to precisely detect when a trading session begins. When the first bar of the selected timeframe occurs within the session window, the script captures:
High (H): The high of the first bar
Low (L): The low of the first bar
Mid (M): The midpoint (hl2) of the first bar
Critical Detail: These levels are fixed from the first bar only - they do not update as the session progresses. This differs from many "opening range" indicators that use a time period (e.g., first 30 minutes). Here, you select the bar timeframe (default 5-minute), and only that single first bar's range is captured.
Statistical Level Calculation
The indicator maintains a rolling array of the last N session's first bar ranges (default: 60 sessions). For each new session, it calculates:
Average Range: Mean of historical first bar ranges
Standard Deviation: Volatility of those ranges
Projection Levels: High/Low ± (Average Range + Std Dev × Multiplier)
This provides probability-based levels. For example, a +2σ level suggests: "Historically, price extending this far beyond the opening range is a 2-standard-deviation event (approximately 95th percentile)."
Fibonacci Extensions
Using the first bar range as the base unit (100%), the indicator projects Fibonacci levels:
100% extension: One full range above the high / below the low
1.618x extension: (Default) Golden ratio projection
2.618x, 3.618x extensions: Additional Fibonacci levels
Calculation: Range = H - L, then Target = H + (Range × Multiplier) for upside projections.
OR Rotation Levels
These are fixed-point increments from the first bar's high and low. Unlike percentage-based methods, rotations use absolute point values:
NQ traders often use 65-point increments
ES traders often use 15-point increments
Gold/bonds use different values
The indicator draws 5 levels above the high (R+1 through R+5) and 5 below the low (R-1 through R-5), each separated by your specified point increment.
Features:
Session Options
Pre-configured Sessions:
New York RTH (9:30am - 4:00pm)
New York Futures (8:00am - 5:00pm)
London (2:00am - 8:00am)
Asia (7:00pm - 2:00am)
Midnight to 5pm
ZB/Gold/Silver OR (8:20am - 4:00pm)
CL OR (9:00am - 4:00pm)
Custom Session: Define your own start/end times in HHMM format
Timezone Support: All sessions respect the selected timezone (default: America/New_York)
Customizable Timeframe
Select any timeframe for the first bar (1min, 5min, 15min, etc.)
Default: 5-minute bars
Important: This is the timeframe for the first bar capture, independent of your chart's timeframe
Display Options
Historical Ranges: Show/hide past session ranges (with configurable limit to manage performance)
Line Styles: Choose between Solid, Dashed, or Dotted for range lines and midline
Label Position: Left or Right side of range
Show Prices: Optionally display actual price values on labels
Custom Colors: Fully customizable colors for all components
Statistical Levels
Lookback Period: Number of historical sessions to analyze (default: 60)
Two Multiplier Levels: Default 1σ and 2σ, fully adjustable
Separate styling: Different line styles (dashed vs dotted) for each sigma level
Optional Labels: Show/hide sigma notation labels
Fibonacci Extensions
Four Extension Levels: 100%, 1.618x, 2.618x, 3.618x (all customizable)
Bidirectional: Projections both above and below the opening range
Optional Labels: Toggle percentage/multiplier labels
OR Rotation Levels
Configurable Increment: Set the point value for your instrument
Five Levels Each Direction: R±1 through R±5
Dynamic Labels: Show both rotation number and point value (e.g., "R+1 (65)")
Three Line Styles: Solid, Dashed, or Dotted
How to Use
Setup
Add the indicator to your chart
Select your trading session from the dropdown
Set the timeframe for first bar capture (typically 5-15 minutes)
Configure which projection methods you want to see (Statistical, Fibonacci, and/or Rotations)
For Day Traders
Scenario: Trading NQ during New York RTH
Session: Select "New York RTH (9:30am - 4:00pm)"
Timeframe: 5-minute (captures 9:30-9:35 bar)
Enable: OR Rotations with 65-point increments
Strategy:
Watch for acceptance/rejection at rotation levels
Use R+1/R-1 as initial profit targets
R+2/R-2 as extended targets
Statistical levels show when price is in "outlier" territory
and rotation levels
Performance Notes
The indicator limits objects to stay within TradingView's constraints (500 max)
If you enable all features, reduce "Maximum Historical Ranges" to prevent slowdown
Typical configuration: 10-20 historical ranges with all features enabled works well
Settings Guide
Session Settings
Session: Choose from pre-configured sessions or "Custom"
Custom Session Start/End: HHMM format (e.g., "0930" for 9:30am)
Timezone: Critical for accurate session detection
Opening Bar Format
Timeframe: The bar size for capturing the first bar's range
Show Midline: Toggle the mid-point line
Show Historical Ranges: Display previous sessions (recommended: leave ON)
Maximum Historical Ranges: Limit history to manage performance (1-500)
Range Style / MidLine Style: Solid, Dashed, or Dotted
Position: Label placement (Left or Right)
Show Prices: Include actual price values on labels
Statistical Levels
Lookback Periods: How many historical first bar ranges to analyze (default: 60)
Std Dev Multiplier 1/2: The sigma levels to project (default: 1.0 and 2.0)
All visual settings (colors, line width, label size)
Fibonacci Extensions
Show Fib Extensions: Enable/disable Fibonacci projections
Measured Move Extensions 1-4: The multipliers (default: 1.618, 2.618, 3.618, 4.618)
Visual customization options
OR Rotations
Rotation Increment: The point value for your instrument
NQ: 65 points
ES: 15 points
Adjust for other instruments based on their typical rotation behavior
Show Rotation Labels: Display level numbers and point values
Visual customization options
Use Cases
Gap Trading: When price gaps away from previous day's close, the first bar range shows the initial gap acceptance/rejection zone
Breakout Confirmation: Price breaking and holding above the first bar high with volume suggests trend day potential. Rotation levels provide measured targets.
Reversal Identification: Price reaching +2σ statistical level = rare event, potential exhaustion
Range Bound Days: Price oscillating between first bar high/low suggests range-bound session; trade reversals at extremes
Institutional Level Awareness: OR Rotations at 65 points (NQ) align with levels professional traders watch
Technical Notes
The indicator uses request.security() with lookahead=barmerge.lookahead_on to ensure the first bar levels are captured correctly
All drawing objects (lines, labels, fills) are managed in arrays with automatic cleanup to prevent memory issues
The statistical calculations use array.avg() and array.stdev() for accurate probability estimates
Rotation levels use individual line variables (like Fibonacci) rather than loops for reliability
Summary
This indicator is original in its combination of three distinct methodologies for projecting levels from a session's opening range:
Statistical Analysis - No other opening range indicator (to our knowledge) calculates standard deviation projections from historical first bar ranges
Time-Based Session Flexibility - Most OR indicators use only daily or fixed time periods; this allows any custom session window
Multiple Projection Methods - Traders can use statistical, Fibonacci, AND rotation levels together or separately

Trend Bars with Counter Table# TradingView Trend Bar Indicator Explained
## Indicator Overview
This is a TradingView indicator designed to identify and count **Trend Bars**. It not only visually marks strong bullish and bearish bars on the chart but also displays a data table in the upper right corner that tracks the distribution of trend bars across different periods, helping traders quickly assess market bias.
## Core Concept: What is a Trend Bar?
The indicator defines two types of trend bars:
### Bull Trend Bar
- **Condition**: Close > Open (bullish candle)
- **Strength Requirement**: Body size ≥ 75% of total candle range
```
Body Length = |Close - Open|
Total Candle Range = High - Low
Criteria: Body Length ≥ 0.75 × Total Candle Range
```
This means both upper and lower wicks are very short, representing a very strong bullish candle.
### Bear Trend Bar
- **Condition**: Close < Open (bearish candle)
- **Strength Requirement**: Body size ≥ 75% of total candle range
Similarly, this represents a strong bearish candle with minimal wicks and a full body.
## Visual Markers
The indicator marks qualifying candles with:
- **Green upward arrow**: Bull trend bar, appears below the candle
- **Red downward arrow**: Bear trend bar, appears above the candle
## Statistical Function
The indicator uses a **rolling array** (storing up to 1000 trend bars) to track historical data, then counts trend bar distribution across 5 different periods:
| Period | Statistical Range |
|--------|------------------|
| Group 1 | Last 7 trend bars |
| Group 2 | Last 15 trend bars |
| Group 3 | Last 21 trend bars |
| Group 4 | Last 29 trend bars |
| Group 5 | Last 35 trend bars |
**Note**: This counts "the last N trend bars," not "the last N candles." Only candles meeting the trend bar criteria are included.
## Data Table Interpretation
The table in the upper right corner contains 5 columns:
1. **Last N**: The set statistical range (7, 15, 21, 29, 35)
2. **Total**: Actual number of trend bars counted (may be less than target initially)
3. **Bull**: Number of bull trend bars (displayed in green)
4. **Bear**: Number of bear trend bars (displayed in red)
5. **Bias**: Market bias
- "bull" (green): More bull trend bars
- "bear" (red): More bear trend bars
## Practical Applications
### 1. Assess Short-term Momentum
Check the distribution of the last 7 trend bars. If bull trend bars dominate (e.g., 5:2), it indicates strong short-term buying pressure.
### 2. Identify Trend Strength
If multiple periods show the same Bias direction, the trend is very clear. For example, all 5 periods showing "bull" is a strong upward signal.
### 3. Spot Trend Reversals
When short-term bias (7 bars) opposes long-term bias (35 bars), it may signal a trend change in progress.
### 4. Combine with Other Indicators
Use this indicator alongside moving averages, support/resistance levels, and other tools to improve trading decision accuracy.
## Technical Highlights
- **Dynamic Array Management**: Uses `array.unshift()` to add new data at the array's beginning, ensuring the latest trend bars are always first
- **Efficient Statistics**: Quickly calculates bull/bear distribution through loop iteration over specified array ranges
- **Adaptive Display**: Shows actual available count when historical data is insufficient
- **Real-time Updates**: Only updates the table on the last bar to avoid unnecessary calculations
## Conclusion
The core value of this indicator lies in **quantifying price action**. By identifying strong candles with full bodies and clear direction, then tracking their distribution, traders can quickly grasp the balance of market forces and make more informed trading decisions. Whether for intraday trading or swing trading, this tool provides valuable reference information.

Enhanced Bar Count IndicatorThe Enhanced Bar Count Indicato r is a versatile tool designed for traders who follow price action methodologies, particularly those inspired by Al Brooks. Built for TradingView and optimized for 5-minute charts during Regular Trading Hours, this indicator combines bar counting with multiple analytical features to help traders identify key market moments, trends, and potential reversal points. While it excels on intraday timeframes, its customizable settings make it adaptable to various trading styles and timeframes.
Key Features
Bar Counting and Diamond Placement
At its core, the indicator numbers each bar starting from the beginning of the trading day, helping traders keep track of bar sequences without manual counting. It highlights specific bars—such as the 7th, 18th, 40th, 48th, 67th, and 73rd bars—with colored diamonds. These bars are significant in Al Brooks’ trading approach for identifying potential reversals or key price action setups:
Bar 7 (Purple Diamond): Occurring around 35 minutes into the session, this bar often marks the end of the initial market open phase, signaling potential opening reversals or the formation of double tops/bottoms.
Bar 18 (Green Diamond): Statistically significant for marking the high or low of the day, making it a critical point for assessing potential trend reversals.
Bar 40 (Red Diamond): Positioned around midday, this bar is often associated with reversal opportunities as the market shifts from morning to afternoon trading.
Bar 48 (Purple Diamond): Around 11:50 AM EST, this bar signals the start of the afternoon swing setup, offering opportunities for midday swing trades.
Bar 67 (Purple Diamond): Appearing in the last hour (around 2:35 PM EST), this bar is key for late-day swing setups, often used for end-of-day strategies like buy-the-close or sell-the-close.
Bar 73 (Purple Diamond): Tied to a 12:30 PM PDT (3:30 PM EST) setup, this bar is significant for US market traders as a late-session decision point for trend continuation or reversal.
This feature allows traders to spot these critical bars at a glance, aligning with Al Brooks’ methodology for intraday trading.
Customizable 10-Period EMA for Scalping
A customizable 10-period Exponential Moving Average (EMA) is included to help scalpers quickly assess short-term trends. By default, it’s set to 10 periods, but users can adjust both the period and color to suit their strategy. When the price is above the EMA, it suggests an uptrend; below it, a downtrend. Scalpers can use pullbacks to the EMA as potential entry points in the direction of the trend. While optimized for 2-minute charts, it also provides valuable context on 5-minute charts for intraday traders.
Multi-Timeframe 20-Period EMAs
To provide a broader trend perspective, the indicator plots 20-period EMAs from three different timeframes—5-minute, 15-minute, and 60-minute—directly on the chart. This allows traders to see how the trend aligns across multiple timeframes, which is crucial for confirming the strength and direction of a move. Each EMA is toggleable and color-coded:
Green for 5m
Orange for 15m
Red for 60m
For instance, if all three EMAs are sloping upwards, it reinforces a strong uptrend, increasing the probability of successful trades in that direction.
Inside/Outside Bar Detection
The indicator automatically detects and marks inside bars with an 'i' and outside bars with an 'O' above the respective bars. Inside bars (where the high is lower than the previous high and the low is higher than the previous low) often signal consolidation and potential breakouts. Outside bars (where the high is higher and the low is lower than the previous bar) indicate increased volatility and possible trend reversals or continuations. These markers help traders quickly spot these patterns, which are essential for timing entries and exits in both range-bound and trending markets.
50% Pullback Retracement
Dynamic support and resistance levels are provided through the 50% retracement (midpoint) of the current and previous day’s price ranges. These levels are plotted as horizontal lines:
A solid line for the current day’s midpoint.
A dashed line for the previous day’s midpoint.
The lines are color-coded—green if below the current price and red if above—helping traders visualize potential reversal or continuation zones. This feature aligns with Fibonacci retracement principles and is particularly useful for intraday traders looking to identify areas where price might stall or reverse.
Customization and Usage
All features in the indicator are toggleable, allowing traders to enable or disable them based on their preferences. The settings are organized into groups—such as 'Bar Counting,' '10 EMA Scalp,' and 'Multi-Timeframe EMAs'—for easy navigation. This flexibility ensures that the indicator can be tailored to various trading styles, from scalping to swing trading. Traders can experiment with different combinations of features to find what works best for their strategy.
The Enhanced Bar Count Indicator is a comprehensive tool that brings together bar counting, trend analysis, pattern recognition, and dynamic support/resistance levels. Inspired by Al Brooks’ price action methodology, it offers traders a multifaceted approach to analyzing the markets. With its customizable and toggleable features, it adapts to different trading styles and timeframes, making it a valuable addition to any trader’s toolkit. Best of all, it’s available for free to the TradingView community—feel free to explore, customize, and integrate it into your trading strategy.
