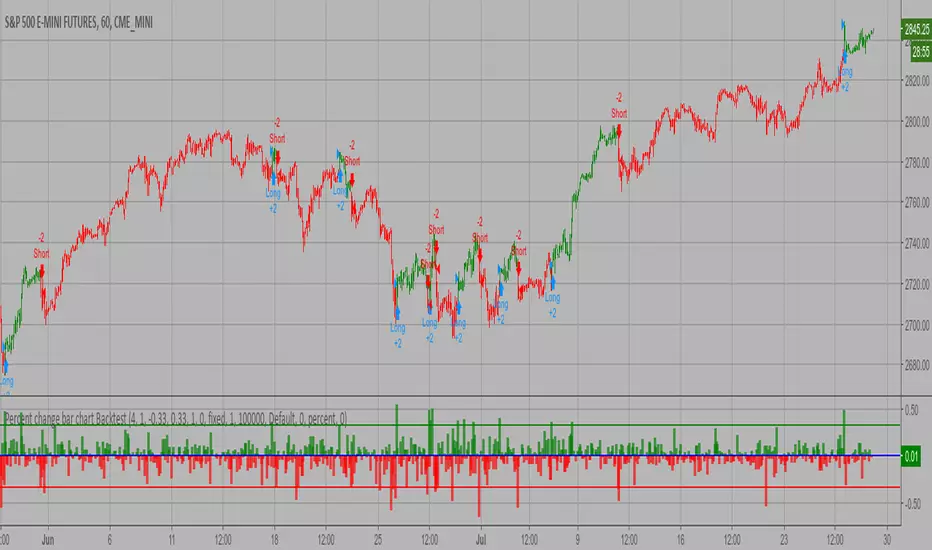
Entry Bars -This algorithm takes in consideration Media averages, Volatility Movements and other Mathematical Properties.
-After adding this signal on TradingView, you will get notified every of potential long and short points triggered by the indicator.
-This signal alerts you anytime bars form a bullish or bearish pattern and price start to move in the suggested direction.
-It works in any time frame or market like Forex, Crypto, Commodities even Stocks.
-Recommended for bots or manual trading.
Do you need an Script or an expert adviser for Forex, contact our coding service
Get this indicator today! contact us
"bar" için komut dosyalarını ara

Color Bars VolumeThe bars are colored exclusively according to volume average:
Ultra high Volume = Volume > Mean Volume * 3.5;
Very high Volume = Volume > (Mean Volume * 2.5) and Volume <= (Mean Volume * 3.5);
High Volume = Volume > (Mean Volume * 1.5) and Volume <= (Mean Volume *2.5);
Medium Volume = Volume > (Mean Volume * 0.5) and volume <= (Mean Volume *1.5);
Low Volume = (Volume > (Mean Volume * 0.5).

candle barsI am trying to count volumes over a period of time. So that turned out awkwardly.
Why is it, I do not understand. I did not see anything special about this topic. If someone digs on this topic, I ask for links. Why publish, well, if I take something from the community, I have to return something). Russian himself, so google translation. With zeros do not know on input. By default I enter numbers of candles, like draws

High Volatility Bar, Wyckoff Trend Tracking Trading SystemHigh Volatility Bar by Wyckoff Trend Tracking Trading System

High Volatility Bar, Wyckoff Trend Tracking Trading SystemHigh Volatility Bar by Wyckoff Trend Tracking Trading System
TGs Inside Bar PlotThis Script is quite simple.
Colors your inside bars on any time frame Blue.
If you would prefer another color. Please contact me thru here
and I will change one specifically for you.
Hope it helps.


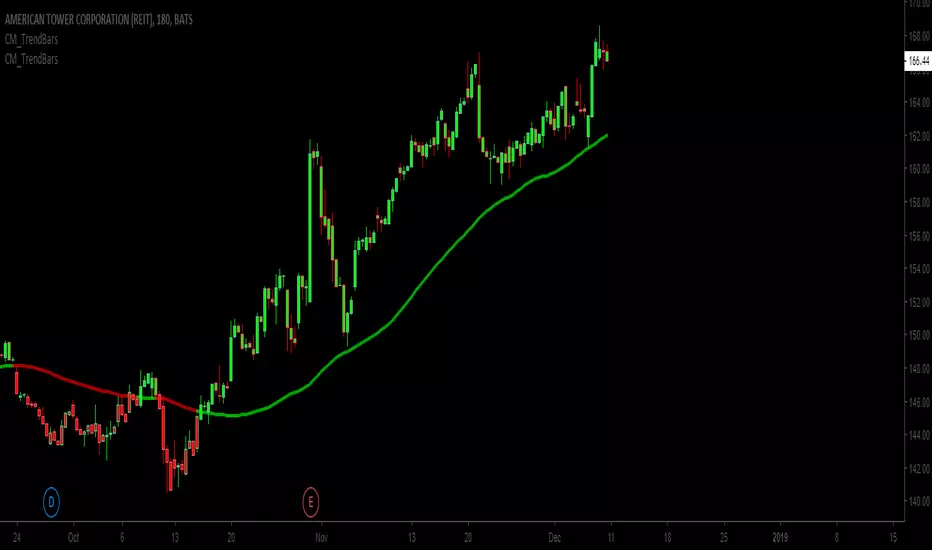
Trend bars with SMA trend linejust changing the colour of the candles based on a SMA trendline
Basic changes made to Chris Moody's trend bars setup
Third attempt by me to do this.
C Volume BarsOk do not take this one as serious as I made it as a joke .Its a volume bar that give you such great results and you can call it with fancy names and even hide the code . as there is no signals no one will pay attention that its repaint . And folks can even pay you money for it as its look so good. I even give you the script to show you how generous I am :)
its even better then the fancy name one as it actually give you time frames to choose from.
but on the other hand who said that repainting is bad?
mine look better:)))


Inside Bar Momentum Alerts v1Alerts for Inside Bar Momentum Strategy
Purple Diamonds show IBs
triangles at top show long alerts
triangles at bot show short alerts

5 Consecutive bars up and down pattern This indicator mark the reversal bar after 5 or more consecutive bars.

My Simple Gaps with overlay (Bar and Candlestick Charts)updated screenshot with some narrative
this is a bar and candlestick chart gap identification tool

Simple Gaps for use on Bar ChartsThis script identifies when price gaps up and gaps down, represented by green and red box icons respectively.
Future enhancements to this script will work across Candle charts and will indicate the size of the script, perhaps with more prominent colours.
Please suggest improvements as you see fit. Thanks, and enjoy.

Deribit ChartsCurious what the price is on Deribit and can't wait for the new charts to be posted on TradingView? This gives you an overlay of their price bars based upon how they calculate their derivative.


Margin Changes Per BarBased on
Made a few changes to better show why price might be going up or down.
Increase in longs (lime) and decrease in shorts (teal) are added up and plotted above 0
Increase in shorts (red) and decrease in longs (gray) are added up and plotted below 0

Percent change bar chart Backtest This histogram displays price or % change from previous bar.
You can change long to short in the Input Settings
WARNING:
- For purpose educate only
- This script to change bars colors.