Visible bars count on chart + highest/lowest bars, max/min AOThe indicator displays the number of visible bars on the screen (in the upper right corner), including the prices of the highest and lowest bars, the maximum or minimum value of the Awesome Oscillator (similar to MACD 5-34-5) for identify the 3-wave Elliott peak in the interval of 100 to 140 bars according to the Profitunity strategy of Bill Williams. The values change dynamically when scrolling or changing the scale of the graph.
In the indicator settings, you can hide labels, lines and change any parameters for the AO indicator - method (SMA, Smoothed SMA, EMA and others), length, source (open, high, low, close, hl2 and others).
‼️ The values are updated within 2-3 seconds after changing the number of visible bars on the screen.
***
Индикатор отображает количество видимых баров на экране (в правом верхнем углу), в том числе цены самого высокого и самого низкого баров, максимальное или минимальное значение Awesome Oscillator (аналогично MACD 5-34-5), чтобы определить пик 3-волны Эллиота в интервале от 100 до 140 баров по стратегии Profitunity Билла Вильямса. Значения меняются динамически при скроллинге или изменении масштаба графика.
В настройках индикатора вы можете скрыть метки, линии и изменить любые параметры для индикатора AO – метод (SMA, Smoothed SMA, EMA и другие), длину, источник (open, high, low, close, hl2 и другие).
‼️ Значения обновляются в течении 2-3 секунд после изменения количества видимых баров на экране.
"bar" için komut dosyalarını ara

Pin Bar PrompterRecognition principle of the Pin Bar
1. The K-Chart has a long shadow line
2. The length of the long shadow line must be greater than 2/3 of the length of the body
3. The shadow line above the body is bearish Pin Bar; the shadow line below the body is bullish Pin Bar.
Pin Bar is just a K-Chart pattern and is only used as a basis for judgment and not as investment advice.
Pin Bar识别的逻辑
1.K线有长影线
2.长影线的长度大于整根K长度的2/3
3.影线在实体上方为:看跌pinbar;影线在实体下方为:看涨pinbar
Pin Bar只是一种K线形态,仅作为一种判断依据,不作为投资建议

BB + Volume Based Coloured BarsVolume Based Coloured Bars:
Most of the time traders are confused about if the price movements were supported by VOLUME .
This indicator colors the bars into volume weighted signals...
When prices go down bars are red and contraversely when up, bars are green. Additionally we have two more colors for each
situation:
PRICE BARS ARE:
DARK RED when prices go down and VOLUME is bigger than 150% of its (default 21 day) average, that indicates us price action is supported by a strong BEARISH VOLUME
RED when prices go down and VOLUME is BETWEEN 50% AND 150% of its (default 21 day) average, at this situation we can think that volume is neither strong nor weak
ORANGE when prices go down and VOLUME is just less than 50% of its (default 21 day) average, so the volume is weak and doesn't support the price action much
DARK GREEN when prices go UP and VOLUME bigger than 150% of its (default 21 day) average, that indicates us price action is supported by a strong BULLISH VOLUME
GREEN when prices go UP and VOLUME is BETWEEN 50% AND 150% of its (default 21 day) average, at this situation we can think that volume is neither strong nor weak
LIGHT GREEN when prices go UP and VOLUME is just less than 50% of its (default 21 day) average, so the volume is weak and doesn't support the price action much
21 day Simple Moving Average used as default value which can be changed in the settings menu,
21 day is considered as a month for STOCK Markets, it would be more accurate to set the value to 30 for CRYPTO CURRENCIES
And Bollinger bands
By Kıvanc Özbilgic thank you

pips barThis indicator displays a line (pips bar) of lengths corresponding to the set number of pips on the chart. This pips bar serves as a reference for assessing the volatility of the displayed chart. One pip for currency pairs is distinguished for JPY pairs and for others.
The horizontal position of the pips bar is offset to the right of the latest bar by the specified bar amount, and the vertical position can be selected from Top, Middle, or Bottom, calculated using the maximum and minimum values visible on the chart.

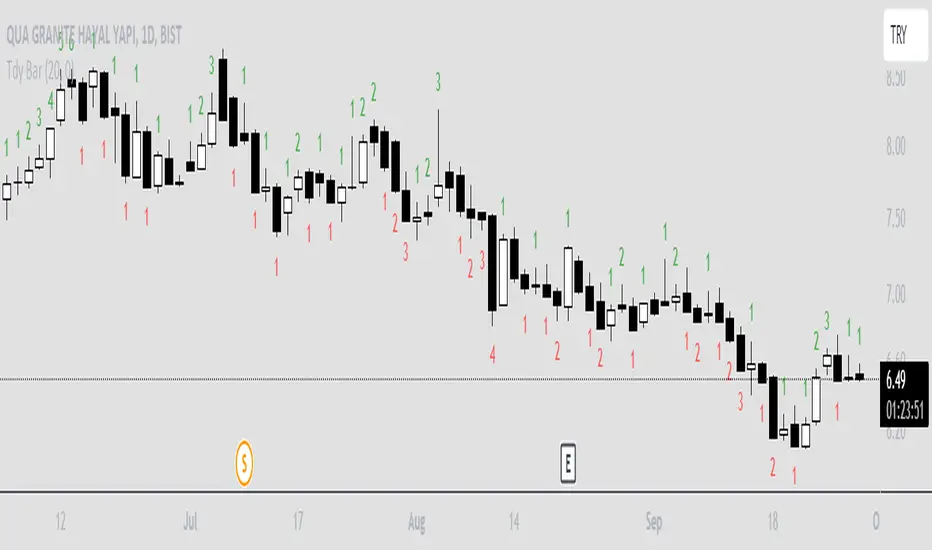
Trendy Bars CounterTrendy Bars Counter indicates the number of bars in trend.
Green: If trend is up
Red: If trend is down
Gray: If there is no trend
Minimum Number Of Trendy Bars: if trendy bars count is greater than this value trendy bars count will be plotted
Session Bar Color (US Time)This script is designed to change the color of bars on a trading chart based on different trading sessions in Eastern Time (ET). It is different from currently published scripts in that it specifically focuses on US time sessions and provides a customizable approach to defining and coloring each session.
To use this script, you can apply it to a chart by selecting it from the list of available indicators or overlays.
The script is meant for traders who are interested in visualizing different trading sessions on their charts. By coloring the bars based on session boundaries, it can help traders quickly identify session changes and potentially adjust their trading strategies accordingly. Mostly it's used to draw the high and low zones of each session.
The markets this script is suitable for are those that operate within the US time zones, as it specifically focuses on Eastern Time (ET) sessions. It can be used for various types of markets, including stocks, futures, and forex.
The conditions for each session are defined using the input. session function, which allows you to specify the start and end times for each session. The script includes four sessions: Asian, London, USA, and New York. By modifying the defval parameter for each session input, you can customize the session times to fit your specific trading preferences or time zone.
The script uses the time function to check if the current bar falls within a particular session. If the condition is met, it sets the color of the bar using the bar color function. Each session is assigned a different color: black for the Asian session, teal for the London session, a custom RGB color (dark red) for the USA session, and red for the New York session.
It's important to note that this script assumes the time zone of the trading platform is set to "Etc/GMT+4" to align with Eastern Time (ET). If your platform uses a different time zone, you may need to adjust the time function calls to match your desired time zone.

Volume Profile Bar-Magnified Order Blocks [MyTradingCoder]Introducing "Volume Profile Bar-Magnified Order Blocks", an innovative and unique trading indicator designed to provide traders with a comprehensive understanding of market dynamics. This tool takes the concept of identifying order blocks on your chart and elevates it by integrating a detailed volume profile within each order block zone.
Unlike standard order block indicators, Volume Profile Bar-Magnified Order Blocks pulls data from lower timeframe bars and assigns it to various segments of the order block. By providing this volume profile inside the order block, the indicator supplies a deeper, multi-dimensional view of market activity that can enhance your trading decisions.
Crucially, users have the ability to fine-tune the detection of order blocks. This is made possible through a single input setting called "Tuning". This integer value allows you to control the significance and frequency of the order blocks. Higher numbers will produce more significant order blocks, though they will appear less frequently. Lower numbers, on the other hand, will yield less significant order blocks, but they will occur more often. This enables you to adjust the sensitivity of the indicator according to your specific trading strategy and style.
Key Settings:
Number of Segments: Customize the level of detail in your volume profile by selecting the number of segments you want inside each order block.
Tuning: Adjust the sensitivity of order block detection to align with your trading strategy. Higher values produce more significant but less frequent order blocks, while lower values yield less significant but more frequent order blocks.
Color Inputs: Personalize the look of your chart by selecting the colors for various elements of the indicator. This ensures a seamless integration with your current chart aesthetics and improves visual clarity.
Here is a s creenshot that beautifully demonstrates the power of this indicator. You'll see how the price rejects perfectly off the highest volume segment in an order block, showcasing the indicator's potential for pinpointing high-impact price levels.
While Volume Profile Bar-Magnified Order Blocks offers many unique features, it should be used in conjunction with other indicators and forms of analysis for a complete trading strategy. As with all tools, it does not guarantee profitable trades but is intended to give traders more information to base their decisions on. Use it to complement your existing analysis and enhance your understanding of market behavior.
Experience a new level of clarity in your trading with Volume Profile Bar-Magnified Order Blocks - an indicator that goes beyond the surface to help you navigate the markets more effectively.

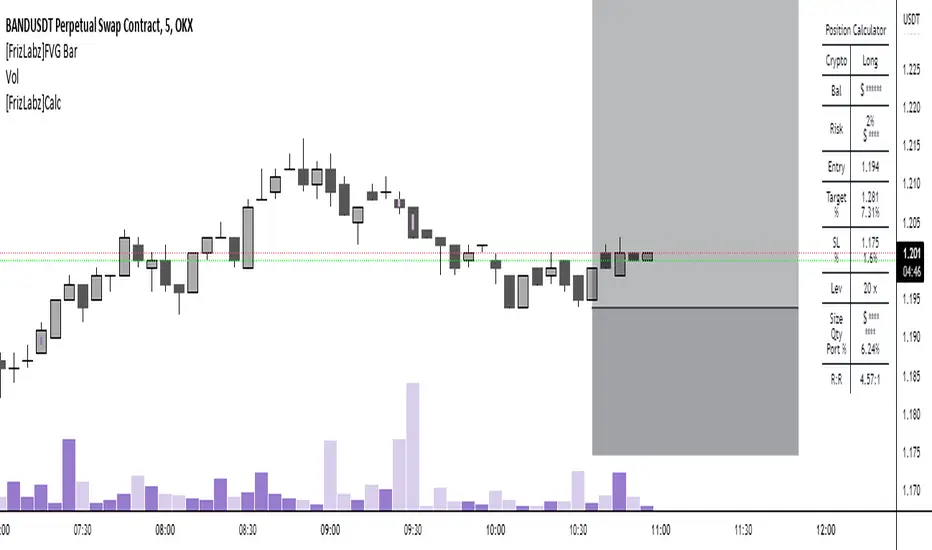
[FrizLabz]FVG Bar
For those of you that like to keep your charts nice and tidy for your Technical Analysis!
FVG = Fair Value Gap
Fair Value Gaps are when impulse movements create an imbalance in price leaving unfilled orders.. they are popular because after one is created we often observe price return to fill these unfilled orders
3 candles make a FVG
When the high/low of most recent candle is lower/high than the low/high of the bar before last
Similar to my other FVG indicator but this one allows you to delete Filled FVGs and have them adjust when filled
Uses a line whose x1 and x2 are on the FVG bar and adjust the size of the FVG with line width because line width on line.new()s doesnt have a cap on line width like plot()s do
Not much too it I made this because a few people were asking if they could delete the FVG after it was Mitigated and since my other uses plots it wasnt possible
so I hope this works for those who were asking about it
hope you enjoy please let me know if you have an idea or find a bug,
Thank You! -
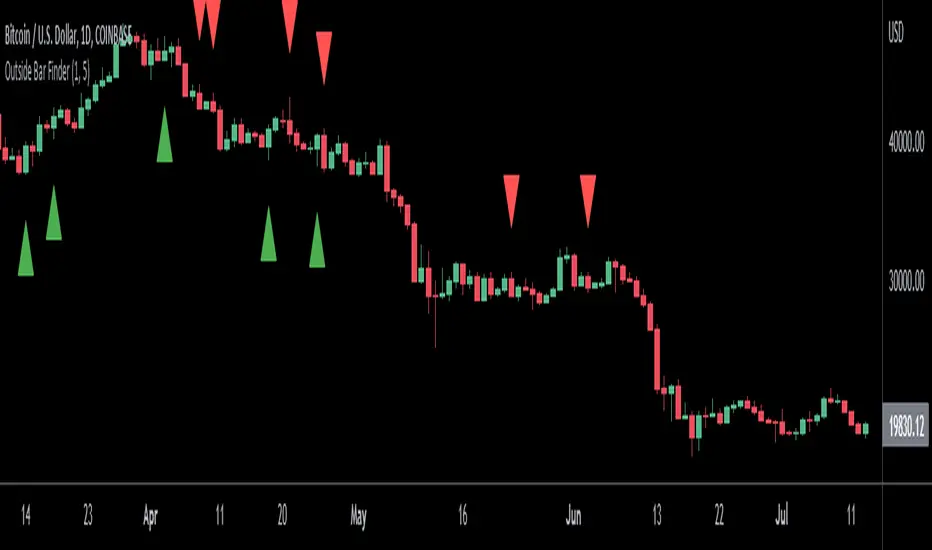
Outside Bar FinderOutside bars occur when the range of a candlestick falls entirely outside of the previous candlestick's range. This indicates indecision and volatility expansion which often leads to changes in trend direction.
This indicator includes options such as:
- The number of consecutive outside bars required to trigger the indicator
- An arrow indicating whether the outside bar is bullish or bearish
- Signal lines to indicate the high and low of the outside bar
Try out this indicator with different options on different timeframes to see if outside bars increase the probability of identifying changes in trend. Breaks or closes outside the signal lines can be used to trigger trade signals.
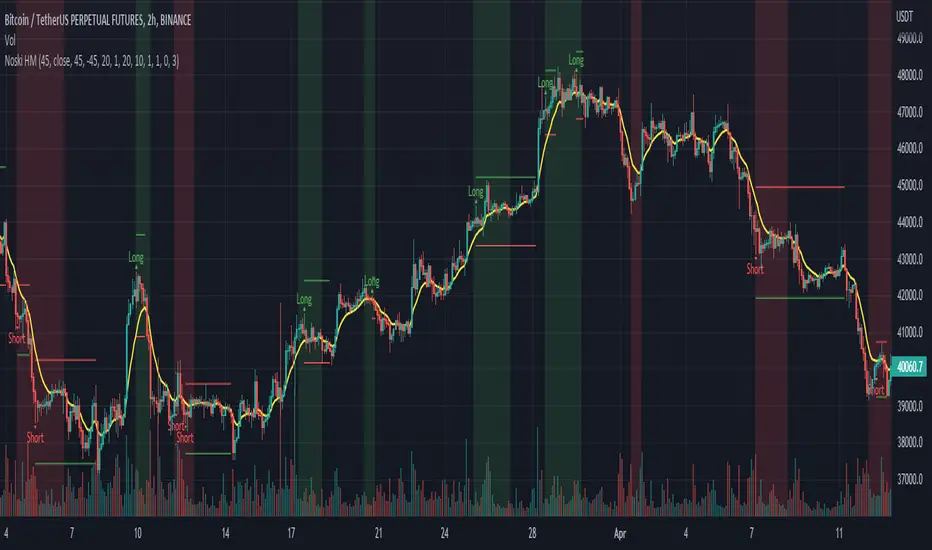
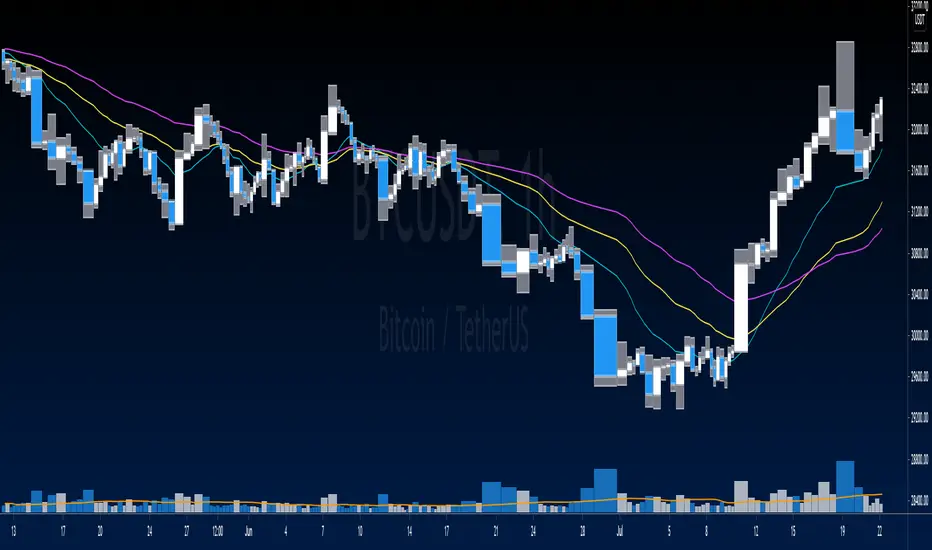
Noski - Rob Hoffman_Inventory Retracement BarStrategy taken directly from Rob Hoffman's award winning strategy. Full credit goes to him
Uses the average angle of the ema over the last 20 bars, in combination with Inventory retracement bars (candles that have retraced at least 45%)
(Please note: the angle calculation default value is calibrated for BTCUSD. There is no way currently to code it to be used across multiple pairs. The price to bar ratio has to be adjusted for other trading pairs. Please research price to bar ratio if unfamiliar)
ATR has been included to set take profit and stop loss.
Separate ATR settings for filtering the size of IRB (can filter out candles which are too large or small)
Red background colour is for when ema is at or below the set -ve angle slope. Green is for positive angle. Default is set at -45 and 45 degrees.
Big thankyou to ZenAndTheArtOfTrading and the following two scripts.
Cosmic Angle - by cosmic_indicators
Rob Hoffman's Inventory Retracement Bar - by ucsgears
Code was borrowed and used directly from these scripts
Capeya Bar ColorColor bars based on price and volume.
Volume can be set dollar denominated.
Change can be set close to close.
Volume can meet a threshold.
Color is bullish if the change is positive & bar's volume is greater than previous bar's volume.
Color is bearish if the change is negative & bar's volume is greater than previous bar's volume.
TEWY - Breadth Based Bar ColorNSE:BANKNIFTY1!
⚠ Important: Before going into details of this script, in order to best use this indicator it is VERY VERY important to make some changes to the chart settings as mentioned below.
• REMOVE CANDLE BORDERS from Symbol settings
• CHANGE WICK COLOR to white/black/gray based on the chart theme you use, from Symbol settings
Make sure you have these settings done.
Detail about this indicator
1. This indicator is used to identify the trend based on the momentum of the counter selected.
2. This indicator is calculated differently for indices NSE:NIFTY and NSE:BANKNIFTY. As I take high weightage stock under these indices to get overall indices momentum.
3. I have used the rate of change and RSI of it to calculate momentum.
4. I would typically use this indicator to see momentum on the Monthly and Weekly first and daily timeframe to get proper entry.
5. Also please try to stay in the long position more than the short position as we all know that, the imminent nature of the market is to go upward only.
6. Please try to keep base inputs as defaults, though it allows you to change input parameters like changing the length of momentum indicator or bar color options. Below is the description of each input
• Smoothen: It changes source from CLOSE to OHLC4.
• Signal Length: It's the length(no of candles) for which the momentum is calculated. Like for RSI the default period/length is 14 or for Moving Average indicator default period/length is 9, I simply use 20 as the default length
• Timeframe: If you want to calculate momentum based on the momentum of different time frames.
• Change bar Color: Use the toggle to change the color of the bar. You can uncheck it so that no bar color is changed if you need so
• Set Bar Color Dynamically: With this even though the oscillator is in opposite direction to the trend it takes the candle close into consideration and sets bar color accordingly.
Always respect RISKS and follow stop loss.
Let's understand how to take a position using this indicator
• Long position:-
• If the latest candle color is GREEN and its preceding candle color is RED, then go long in the counter with the strict stop loss(SL) 1% below the preceding RED colored candle.
• Once you are in a long position, trail stop loss(SL) below each red candle you see on the chart.
• Exit strictly if initial SL or trailing SL is hit. And re-create long positions once you see the next green candle.
• Short Position:-
• If the latest candle color is RED and its preceding candle color is GREEN, then go short IF RED COLORED CANDLE LOW IS TAKEN OUT. Exit short once you see a green colored candle.
• Exit strictly if you see a GREEN-colored candle and create a long position.
If you are really interested and need access to this indicator please DM me.
I have given a sample illustrational image below, which should help you understand this indicator.
Best of luck

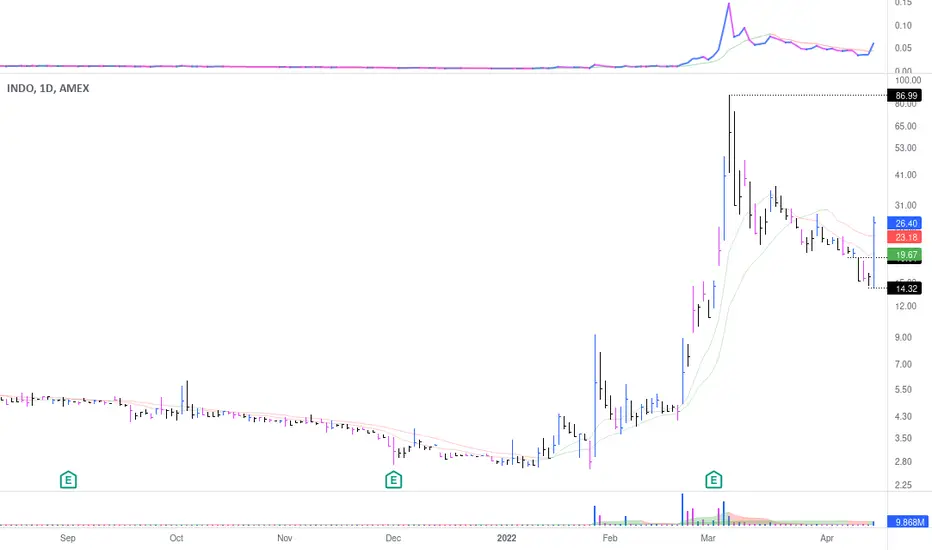
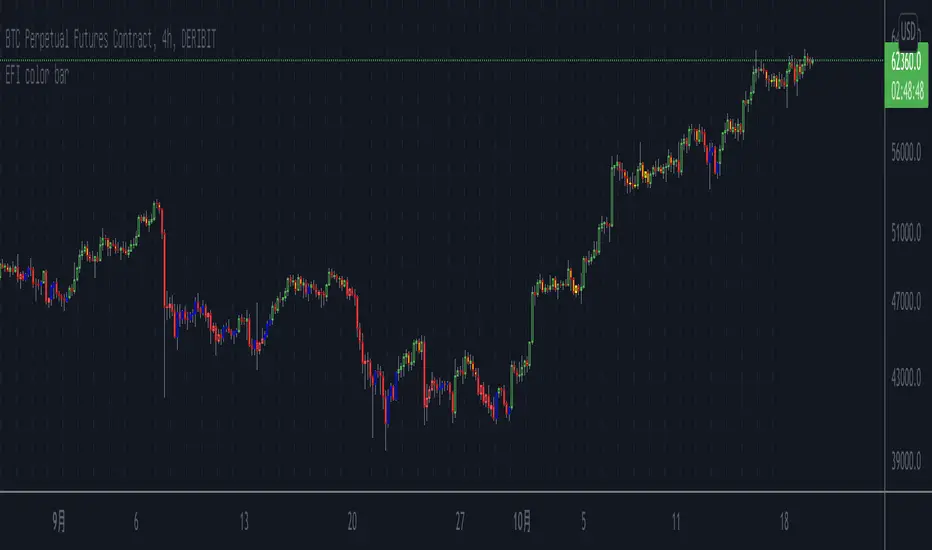
Elder's Force Index Color BarBased on the Elder's Force Index (EFI) , +/- of the EFI and its ema is used to describe the rise, fall or possible reversal of the market, and finally shown by bar color.
The green bar represents a strong bull and the red bar represents a strong bear;
The blue bar indicates that the downtrend is exhausted and may rise. Likewise the yellow bar.
Of course, it is difficult to buy the bottom and sell the top at any time. This indicator needs to be judged together with the pattern or other indicators that predict reversals in order to increase the win rate.
Happy Trading.
根据Elder's Force Index修改而成,取消了幅图指标,仅用bar color来表现上涨,下跌和转折。
绿色k线代表上涨动能充足,红色k线表示下跌动能充足;
蓝色k线表示下跌力竭,可能会上涨;
黄色k线表示上涨力竭,可能会下跌。
当然,任何时候抄底摸顶都是困难的,该指标需要和形态或者其他预测反转的指标一起判断才能增加成功率。
祝交易愉快。
緑は上昇トレンドで、赤は下落トレンドです;
青は下落が尽きて上昇する可能性があることを示すことで、黄色は上昇が終わり、下落の可能性があることを示しています。
成功率を高めるためには、パターンや反転を予測する他の指標と合わせて判断する必要があります。
Happy Trading。
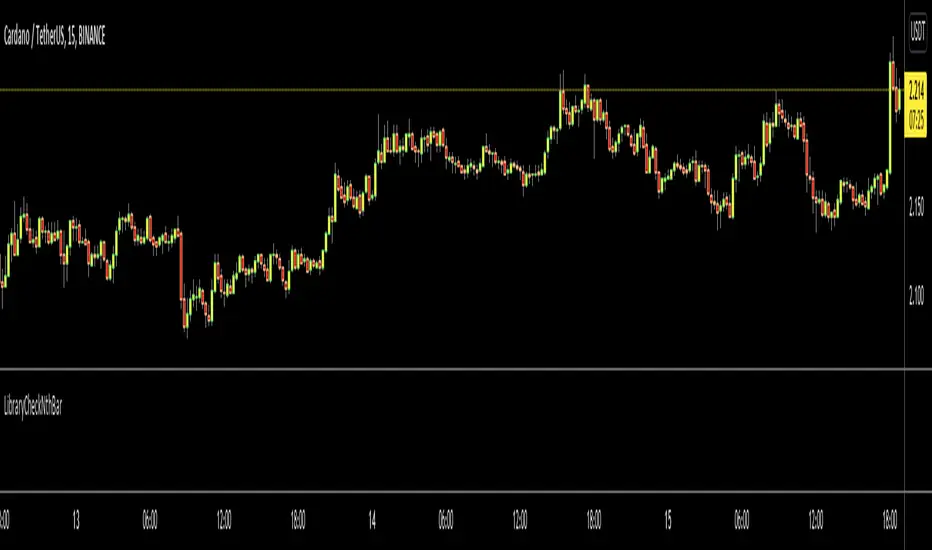
LibraryCheckNthBarLibrary "LibraryCheckNthBar"
TODO: add library description here
canwestart(UTC, prd) this function can be used if current bar is in last Nth bar
Parameters:
UTC : is UTC of the chart
prd : is the length of last Nth bar
Returns: true if the current bar is in N bar
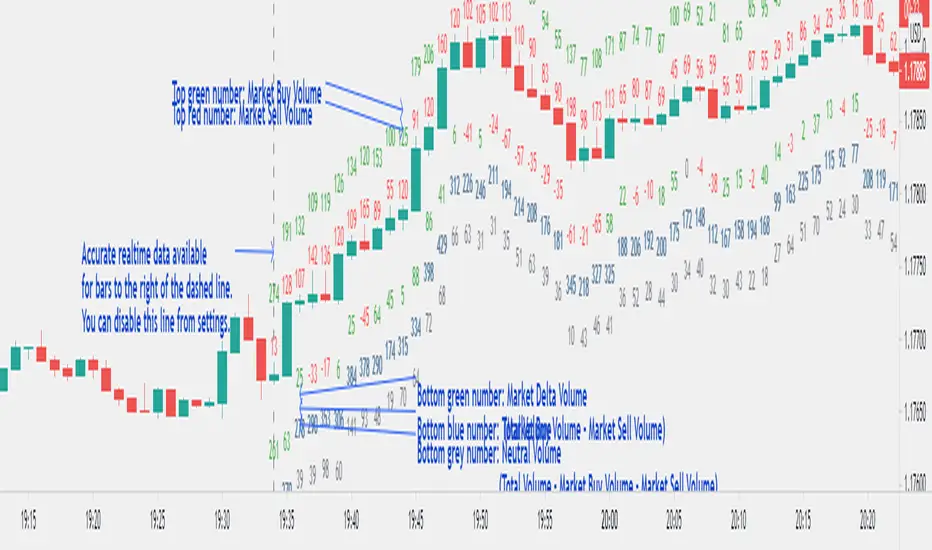
Market Delta Volume for Realtime BarsWhat is it?
Market Delta Volume Tool for real-time bars
A market delta tool that shows, (1) the volume that got transacted on upticks - or the market buy volume; (2) the volume that got transacted on downticks - or the market sell volume (3) the market delta volume (i.e., market buy volume - market sell volume); (4) the total volume (market buy volume + market sell volume + neutral volume); and (4) the volume that got transacted without a change in price - or the neutral volume (total volume = market buy volume + market sell volume + neutral volume)
NOTE: THIS WORKS ONLY ON REAL-TIME BARS, NOT ON HISTORICAL BARS! The dotted line marks the start of real-time data (i.e., the bar from which the indicator started collecting and displaying data). You will see accurate data only for bars to the right of this line.
The longer you keep a chart open with the study enabled, the more data it collects and displays and the better your analysis can potentially be.
Note that the data gets reset every time any of the options is changed, the market is switched, the browser is refreshed, or the script is reloaded.
DATA ISN'T STORED. I.e., every time a new symbol is loaded/or the same symbol is reloaded, data gets refreshed.
Who is it for?
For traders who are used to analyzing buy/sell activity using market delta information. Especially, short-term trader/scalpers who are used to keeping the same chart open through the trading session.
Also for traders to see and study how anomalies in volume can give clues to buyer/seller absorption, initiative buying/selling etc.
Can be used to better understand VSA as well, although not necessary.
Essentially, this gives real-time delta volume information; use it however you see fit.
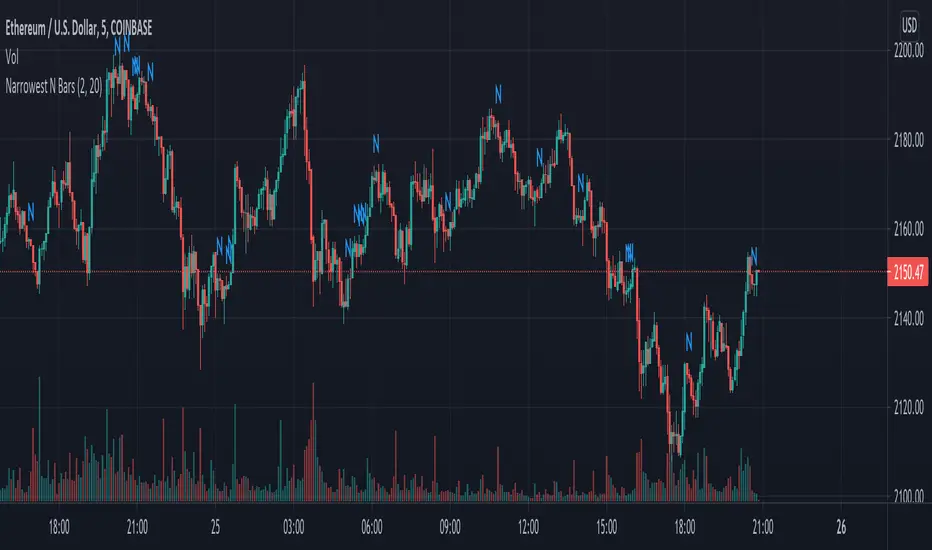
Narrowest N BarsThe indicator is inspired by Toby Crabel's work.
Originally 2-Bar NR pattern is defined as the narrowest range from high to low of any two day period relative to any two day period within the previous 20 market days.
However, this script allows user to look for N Bar narrowest range within user defined numbers of previous days
Settings are as follows:
1. N Bars - sets number of bars in range
2. Lookback period is self-descriptive)
The last bar in the narrowest range is marked with N
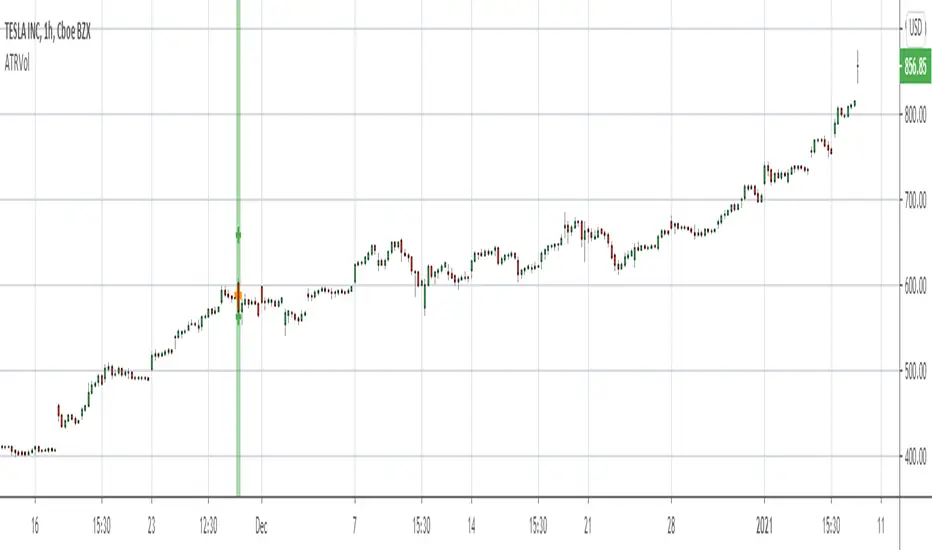
ATR Volatility Bars 1.0This script will be featured in upcoming video ideas about catching liquidations spikes in cryptocurrencies.
The script measures the unique size of each bar compared to the Average True Range (ATR) of the evaluation period. The evaluation period can be set in the inputs. The desired benchmark for what will be highlighted is also set in the inputs as a percentage. The default settings are to evaluate the last 26 bars for ATR and highlight bars that are 300% or larger than ATR.
When a bar meets the criteria of the indicator it will show a label and highlight the bar accordingly. The user may select the indicator to only show Buy or Sell opportunities. The indicator has alert functionality.
Double Inside BarThis indicator provides a statistical report on the Double Inside Bar pattern. Based on the chart's bars, it can improve your edge on any markets and timeframes.
A Double Inside Bar refers to a contraction where price is consolidating while making consecutive lower highs and a higher lows.
The report is broken down into the different following sections: retracement , invalidation , continuation and breakout .
Each of them provides hindsights about the pattern price behavior and brings answers to questions such as: How often does price retrace? Does the pattern often invalidate? If it doesn't then does it break in the pattern's direction? How far does price go? What are the odds of a false breakout?
While there are many ways to make use of the metrics, my favorite use case is for developing directional and daily/weekly biases while refining my stop/entry/target positioning.
Miscellaneous
Highlights patterns on the chart;
Supports bar to bar analysis and replay functionalities;
Provides counts on the `Data Window` panel for debugging or computing your own metrics;
Settings
Show/hide for toggling different sections;
Report coloring and offset on the x axis;
Gaining Access
This is a private indicator and is available only for my Patrons. You can reach my Patreon page below from the link in my signature.

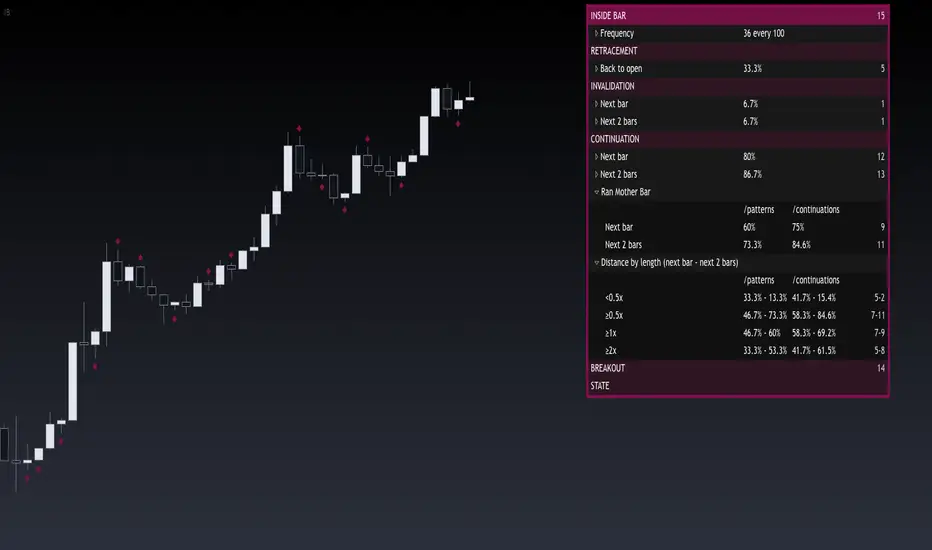
Inside BarThis indicator provides a statistical report on the Inside Bar candlestick pattern. Based on the chart's bars, it can improve your edge on any markets and timeframes.
The Inside Bar pattern refers to a candle that makes a lower high and a higher low.
The report is broken down into the different following sections: retracement , invalidation , continuation and breakout .
Each of them provides hindsights about the pattern price behavior and brings answers to questions such as: How often does price retrace? Does the pattern often invalidate? If it doesn't then does it break in the pattern's direction? How far does price go? What are the odds of a false breakout?
While there are many ways to make use of the metrics, my favorite use case is for developing directional and daily/weekly biases while refining my stop/entry/target positioning.
Miscellaneous
Highlights patterns on the chart;
Supports bar to bar analysis and replay functionalities;
Provides counts on the `Data Window` panel for debugging or computing your own metrics;
Settings
Show/hide for toggling different sections;
Report coloring and offset on the x axis;
Gaining Access
This is a private indicator and is available only for my Patrons. You can reach my Patreon page below from the link in my signature.
Engulfing BarThis indicator provides a statistical report on the Engulfing candlestick pattern. Based on the chart's bars, it can improve your edge on any markets and timeframes.
Knowing there are many definitions about the Engulfing pattern, here we're strictly referring to one bar's body that get engulfed by one other.
The report is broken down into the different following sections: retracement , invalidation , continuation and breakout .
Each of them provides hindsights about the pattern price behavior and brings answers to questions such as: How often does price retrace? Does the pattern often invalidate? If it doesn't then does it break in the pattern's direction? How far does price go? What are the odds of a false breakout?
While there are many ways to make use of the metrics, my favorite use case is for developing directional and daily/weekly biases while refining my stop/entry/target positioning.
Miscellaneous
Highlights patterns on the chart;
Supports bar to bar analysis and replay functionalities;
Provides counts on the `Data Window` panel for debugging or computing your own metrics;
Settings
Option for filtering patterns that close outside previous bar;
Show/hide for toggling different sections;
Report coloring and offset on the x axis;
Gaining Access
This is a private indicator and is available only for my Patrons. You can reach my Patreon page below from the link in my signature.

Equivolume BarsEquivolume bars. Width is determined by volume. Please note that equivolume bars are rendered independently of the time scale.
Makes use of @LonesomeTheBlue's "Start the Script on Last Nth Bar" in order to prevent time out. As such you are only able to view the most recent bars and no bar replay beyond that range.
Trail with Bar Time [NBL]Hello Everyone its Trailing stop loss Indicator with Bar Time if you want to Trail Your position with Specific Bar or time You can also Trail. Basically, its indicator we are using automation Trading
How to work its indicator?
➤ if you want to Trail Your Position according to Specific Bar or time
Indicator Feature
➤ Long Side TSL hit With Alerts
➤ Short Side TSL hit With Alerts
➤ Both Side TSL hit With Alerts
➤ You can also Select Specific Bar
➤ You Can Also add Trailing with Percentage or Point
➤ You Can Also Select Trailing calculate Bar Source Like Open, Close, High, Low etc More.
Important: This Indicator we are using for Automation Trading if You Want This Indicator Access Please Contact me PM on Tradingview

Start the Script on Last Nth Bar [Experimental]Hello Pine Scripters,
Sometimes we need to run some processes in the scripts on last N bar but currently we don't know bar_index value of realtime bar or number of remaining bars before we reached it. So most of us use "start date" as input and run some processes after "start date".
This experimental script finds last Nth bar approximately. As you can see in the script we (should) use GMT, otherwise as I see the result might not be accurate (we don't know timezone used on the chart)
The idea is to find/use similar bar in the past (using timenow as reference) and then calculate aproximate the time of last Nth bar. the results may not be accurate all the time, also we can not know local holidays etc.
At the moment the script works on 1minute or higher time frames (it won't work on less 1min timeframes)
In the future if the Pine Team add something like "bar_index_realtime" then we will not need such things. by the way many thanks to Pine Team, they are doing great job.
You can use this script in your scripts as you want, no need to ask permission. If you can improve it let me know ;)
Enjoy!
