[blackcat] L2 Ehlers Cyber Cycle Trading StrategyLevel: 2
Background
John F. Ehlers introuced Cyber Cycle Trading Strategy in his "Cybernetic Analysis for Stocks and Futures" chapter 4 on 2004.
Function
With cyber cycle alone, the Trigger lags the Cycle by one bar, so that their crossing introduces at least another bar of lag. Finally, Dr Ehler concluded that we can’t execute the trade until the bar after the signal is observed. In total, that means our trade execution will be at least four bars late. If we are working with an eight-bar cycle, that means the signal will be exactly wrong. We could do better to buy when the signal says sell, and vice versa.
The difficulties arising from the lag suggest a way to build an automatic trading strategy. Suppose we choose to use the trading signal in the opposite direction of the signal. That will work if we can introduce lag so the correct signal will be given in the more general case, not just the case of an eight-bar cycle. Therefore, the Cyber Cycle trading strategy was introduced by Dr. Ehlers. It starts exactly the same as the Cyber Cycle Indicator. Dr. Ehlers then introduce the variable Signal, which is an exponential moving average of the Cycle variable. The exponential moving average generates the desired lag in the trading signal. The relationship between the alpha of an exponential moving average and lag is alpha2 = 1/ (Lag+1). This relationship is used to create the variable alpha2 in the code and the variable Signal using the exponential moving average. The trading signals using the variable Signal crossing itself delayed by one bar are exactly the opposite of the trading signals I would have used if there were no delay. But, since the variable Signal is delayed such that the net delay is less than half a cycle, the trading signals are correct to catch the next cyclic reversal. The idea of betting against the correct direction by waiting for the next cycle reversal can be pretty scary because that reversal may “never” happen because the market takes off in a trend. For this reason Dr. Ehlers included two lines of code that are escape mechanisms if we were wrong in our entry signal. These last two Signal lines of code reverse the trading position if we have been in the trade for more than eight bars and the trade has an open position loss.
Key Signal
Cycle ---> Cyber Cycle fast line
Cycle (2) ---> Cyber Cycle slow line
Signal ---> Trading signal fast line
Signal(1) ---> Trading signal slow line
Pros and Cons
100% John F. Ehlers definition translation of original work, even variable names are the same. This help readers who would like to use pine to read his book. If you had read his works, then you will be quite familiar with my code style.
Remarks
The 25th script for Blackcat1402 John F. Ehlers Week publication.
Readme
In real life, I am a prolific inventor. I have successfully applied for more than 60 international and regional patents in the past 12 years. But in the past two years or so, I have tried to transfer my creativity to the development of trading strategies. Tradingview is the ideal platform for me. I am selecting and contributing some of the hundreds of scripts to publish in Tradingview community. Welcome everyone to interact with me to discuss these interesting pine scripts.
The scripts posted are categorized into 5 levels according to my efforts or manhours put into these works.
Level 1 : interesting script snippets or distinctive improvement from classic indicators or strategy. Level 1 scripts can usually appear in more complex indicators as a function module or element.
Level 2 : composite indicator/strategy. By selecting or combining several independent or dependent functions or sub indicators in proper way, the composite script exhibits a resonance phenomenon which can filter out noise or fake trading signal to enhance trading confidence level.
Level 3 : comprehensive indicator/strategy. They are simple trading systems based on my strategies. They are commonly containing several or all of entry signal, close signal, stop loss, take profit, re-entry, risk management, and position sizing techniques. Even some interesting fundamental and mass psychological aspects are incorporated.
Level 4 : script snippets or functions that do not disclose source code. Interesting element that can reveal market laws and work as raw material for indicators and strategies. If you find Level 1~2 scripts are helpful, Level 4 is a private version that took me far more efforts to develop.
Level 5 : indicator/strategy that do not disclose source code. private version of Level 3 script with my accumulated script processing skills or a large number of custom functions. I had a private function library built in past two years. Level 5 scripts use many of them to achieve private trading strategy.
"Cycle" için komut dosyalarını ara
Ehlers Stable Dominant Cycle Length [graylange]Stable Dominant Cycle Length – Adaptive Cycle Detection for Market Timing
This script calculates the dominant cycle length of the market using an improved version of John Ehlers' Hilbert Transform approach. Unlike traditional implementations, this version includes advanced smoothing techniques to reduce noise and prevent erratic spikes, making it more reliable for adaptive cycle-based strategies.
🔥 Key Features:
✅ Noise-Reduced Cycle Detection – Uses a Weighted Moving Average (WMA) detrending method instead of raw Hilbert Transform values to enhance stability.
✅ Adaptive Smoothing – Applies an Exponential Moving Average (EMA) to the instantaneous period, reducing excessive volatility in cycle length calculations.
✅ Phase Wrapping & Constraints – Clamps phase changes to prevent unrealistic cycle swings and division errors.
✅ Dynamic Cycle Adjustment – The dominant cycle length updates in real time, constrained within a reasonable range (6 to 50 bars) to avoid extreme peaks.
📌 How to Use It:
Identify Market Cycles – Use the dominant cycle length to determine optimal trend-following vs. mean-reversion strategies.
Enhance MESA Filters – Apply the detected cycle length to adjust Ehlers’ MESA Adaptive Moving Average (MAMA) dynamically.
Fine-Tune Alpha Settings – Reduce overfitting in cycle-based indicators by basing parameters on a stable dominant cycle estimate.

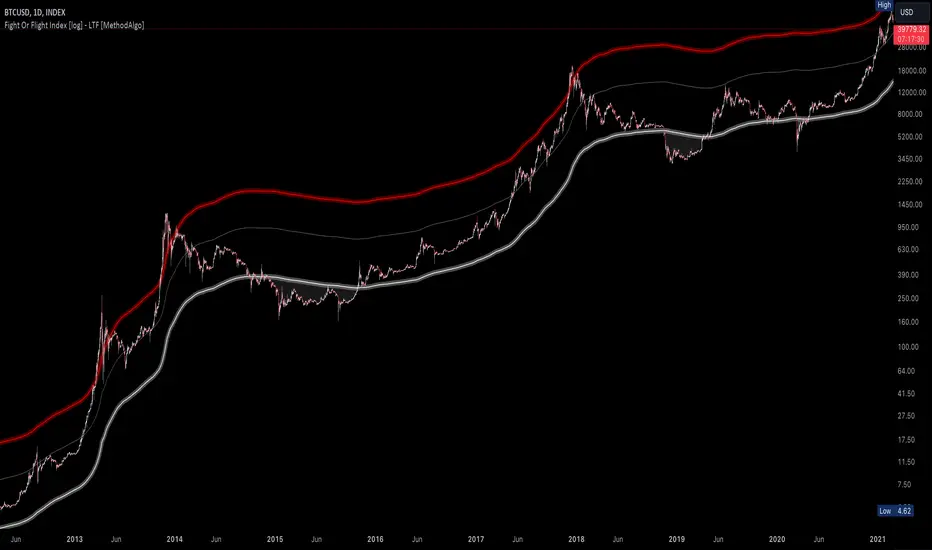
Fight Or Flight Index [log] - LTF [MethodAlgo]Introduction:
"Fight Or Flight" is a robust yet user-friendly indicator designed for long-term cycle analysis and gauging market sentiment. Excluded from our Premium Indicator Collection, we are delighted to offer this tool to the community for free.
Before Use:
- This is a first-layer analysis tool, identifying potential over/under-valued price areas, not predicting future market movements.
- Tailored for long-term investment analysis. Designed for use on timeframes "1D" and above; unsupported timeframes will display nothing.
- If the asset has less 2 years of data, indicator will display nothing.
Concept:
Fight Or Flight utilizes a 2-year Moving Average (MA) as a baseline (neon white), with reference lines at 2.5x and 5x of the MA (white and neon red). By tracking asset movements through bear and bull market cycles, the indicator simplifies the identification of these cycles for long-term investors.
Instructions:
- Supported timeframes: 1D, 3D, 1W, 2W, 3W, 9W, 1M, 3M, 6M, 12M; auto-adjusts MA parameters for listed timeframes for the same result.
- Recommended to use log chart for clearer views; supports all chart types but functions optimally in log mode. or the upper channel line will look odd (but not wrong).
- Set up advice: Use the indicator in a separate chart with a fixed timeframe.
UI:
- Neon White: Indicates market bottom, a 2-year MA auto-adjusted for the supported timeframe.
- Neon Red: Indicates market top, set at 5x the 2-year MA.
- White: Sits between the top and bottom lines, serving as a support, resistance, or equilibrium line.
- Filled Area: Red (Flight) signals an overheated market, suggesting an exit; White (Fight) denotes an undervalued market, suggesting an possible entry.
Use Case:
Traders can observe price levels in comparison to the MA levels provided by the indicator for cycle analysis:
- Below Neon White: Indicates undervalue, over-pessimistic market conditions; potential for outsized returns.
- Near or above Neon Red: Suggests an overvalued or overexcited market; plan your exit strategy.
Risk Disclaimer:
Trading is inherently risky; this indicator provides indications based on historical data, and past performance does not guarantee future results. Use it as part of your confluence reference and avoid making trading decisions solely based on one indicator.
Moonhub Cycle IndexMoonhub Cycle Index is a composite index derived from three popular technical analysis indicators: Moving Average Convergence Divergence (MACD), Schaff Trend Cycle (STC), and Detrended Price Oscillator (DPO). The indicator is designed to help identify potential trends and market sentiment by combining the unique characteristics of each indicator.
Key components of the indicator include:
Input Parameters:
COEMA Length (len_DIema): The length of the Exponential Moving Average (EMA) applied to the Custom Index. Default is set to 9.
COSMA Length (len_DIsma): The length of the Simple Moving Average (SMA) applied to the Custom Index. Default is set to 30.
Indicators:
MACD: A momentum oscillator that shows the relationship between two moving averages of a security's price. It is calculated using the difference between the 12-period and 26-period EMA, and a 9-period EMA (signal line) of the MACD.
STC: A cyclic indicator that identifies cyclical trends in the market. It is calculated using the Stochastic oscillator formula applied to the close, high, and low prices over a 10-period lookback window.
DPO: A price oscillator that eliminates the trend from price data to focus on underlying cycles. It is calculated using a custom function that shifts the price by half the length and subtracts the SMA from the shifted price.
Custom Index: The composite index is calculated by taking the average of the MACD line, STC, and DPO.
COEMA and COSMA: Exponential and Simple Moving Averages applied to the Custom Index using the lengths specified by the input parameters (len_DIema and len_DIsma).
Plots: The Custom Index, COEMA, and COSMA are plotted with different colors and line widths to visualize their interaction and provide insights into potential market trends.
This Custom Index Indicator can be useful for traders who want to analyze the market using a combination of these indicators to make more informed decisions. It can also help identify potential trends and market sentiment by combining the unique characteristics of each indicator.

Combo Backtest 123 Reversal & D_DSP (Detrended Synthetic Price) This is combo strategies for get a cumulative signal.
First strategy
This System was created from the Book "How I Tripled My Money In The
Futures Market" by Ulf Jensen, Page 183. This is reverse type of strategies.
The strategy buys at market, if close price is higher than the previous close
during 2 days and the meaning of 9-days Stochastic Slow Oscillator is lower than 50.
The strategy sells at market, if close price is lower than the previous close price
during 2 days and the meaning of 9-days Stochastic Fast Oscillator is higher than 50.
Second strategy
Detrended Synthetic Price is a function that is in phase with the
dominant cycle of real price data. This DSP is computed by subtracting
a half-cycle exponential moving average (EMA) from the quarter cycle
exponential moving average.
See "MESA and Trading Market Cycles" by John Ehlers pages 64 - 70.
WARNING:
- For purpose educate only
- This script to change bars colors.

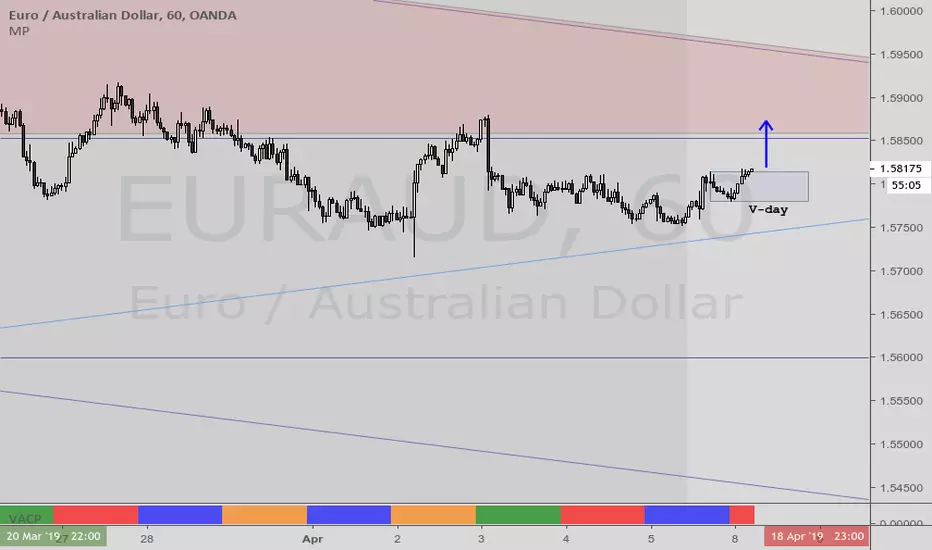
VACPWelles Wilder (delta phenomenon) a 4-day rotation indicator
PVAC is the acronym Alan uses for a four-day rotation cycle. The cycle itself is circularly continuous every days of the week, forever, including every holiday. Thus if, for instance, Monday was a P, Tuesday is V, Wednesday is A, Thursday is C. At this point the cycle repeats, with Friday being P, Saturday being V, Sunday being A, and the following Monday being C.
Having started, the cycle never changes. While each day tends to have the characteristics shown below, like all cycle tools, there are inversions, which will last a cycle or at times even more, and have reasonable odds of inverting regularly.
A trader who wants to incorporate a four-day rotation cycle into their work is encouraged to study for themselves whether this adds value.
Day: V-day Color: Red Characteristics: Closes well for bulls; Use your fleece bars Bar8 and Bar11; Bar8 open often a V-day return target; 'V' return comes early in day in bear moves, late in day in bullish moves
Day: A-day Color: Blue Characteristics: Closes poorly for bulls; Use your fleece bars 8 and 11; Generally 'A' shaped, but may have a kick-leg after 3pm
Day: C-day Color: Orange Characteristics: Consolidation day, aka 'consoly' day. It may not chop, but it may have an
accumulation or distribution quality to the action; Trade often and trade fast; Pattern traders fade 4HHs and 4LLs with backfill/pullbacks 3 bars later; Apexes and angulars tend to have less importance; Numerical traders trade after Bar8 open and use support one horizontal below, resistance one horizontal above; C-day opens often at the 25%; The afternoon action tends to be opposite to the morning action
Day: P-day Color: Green Characteristics: Often a trend day. Find the trend and enter it; Often opens at the 75%; Trade P-days against a quartile; Watch for price to be above/below the first apex: buy above or sell below ; Do not fade dead zone, minimal trading
[Bybit BTCUSD.P] 7Years Backtest Results. 2,609% +Non-Repainting📊 I. Strategy Overview: Trust Backed by Numbers
The ADX Sniper v12 strategy has been rigorously tested over 7 years, from November 14, 2018 to November 8, 2025, spanning every major cycle of the Bitcoin
BTCUSD.P futures market. This strategy successfully balances two often-conflicting goals: maximizing profitability while minimizing volatility, all supported by objective performance data.
This strategy has been validated across all Bitcoin (BTCUSD.P) futures market cycles over a 7-year period.
■ Visual Proof: Bar Replay Simulation
The chart above demonstrates actual entry and exit points captured via TradingView's Bar Replay feature. The green rectangle highlights the core profitable trading zone, showing where the strategy successfully captured sustained uptrends. This visual evidence confirms:
Confirmed buy/sell signals with exact execution prices (marked in red and blue)
No repainting or signal distortion after candle close
Consistent performance across multiple market cycles within the highlighted zone
💰 Core Performance Metrics:
Cumulative Return: 2,609.14% (compounded growth over 7 years)
Maximum Drawdown (MDD): 6.999% (preserving over 93% of capital)
Average Profit/Loss Ratio: 8.003 (industry-leading risk-reward efficiency)
Total Trades: 24 (focused exclusively on high-conviction opportunities)
Sortino Ratio: 11.486 (mathematically proving robustness and stability)
✅ This strategy has been validated across all Bitcoin BTCUSD.P futures market cycles over a 7-year period.
📊 I. 전략 개요: 숫자로 입증된 신뢰
ADX Sniper v12 전략은 2018년 11월 14일부터 2025년 11월 8일까지 약 7년간 비트코인 (BTCUSD.P) 선물 시장의 모든 주요 사이클을 거치며 엄격하게 검증되었습니다. 수익성 극대화와 변동성 최소화라는 상충되는 목표를 동시에 달성한 이 전략의 핵심 성과 지표를 객관적 데이터를 통해 확인하실 수 있습니다.
본 전략은 7년간의 모든 비트코인 (BTCUSD.P) 선물 시장 사이클에서 검증되었습니다.
■ 시각적 증명: 바 리플레이 시뮬레이션
위 차트는 TradingView의 바 리플레이 기능으로 포착된 실제 진입 및 청산 시점을 보여줍니다. 녹색 네모는 핵심 수익 구간을 표시하며, 전략이 지속적인 상승 추세를 성공적으로 포착한 영역을 나타냅니다. 본 시각 자료는 다음을 입증합니다:
정확한 체결 가격이 표기된 확정된 매수/매도 신호 (빨강색과 파랑색으로 표시)
캔들 종가 후 신호 왜곡이나 리페인팅 없음
강조 표시된 구간 내 여러 시장 사이클에 걸친 일관된 성과
💰 핵심 성과 지표:
누적 수익률: 2,609.14% (7년간 복리 성장 입증)
최대 낙폭 (MDD): 6.999% (7년간 자본의 93% 이상 보존)
평균 손익비: 8.003 (업계 최고 수준의 위험-보상 효율성)
총 거래 횟수: 24회 (고확신 기회에만 집중)
소르티노 비율: 11.486 (전략의 견고성과 안정성을 수학적으로 입증)
✅ 본 전략은 7년간의 모든 비트코인 (BTCUSD.P) 선물 시장 사이클에서 검증되었습니다.
🛡️ II. Core Philosophy: Cut Losses Short, Let Profits Run
Why MDD Stays Below 7% in a Volatile Market
The crypto futures market typically experiences daily volatility exceeding 10%, with most strategies enduring drawdowns between 30% and 50%. In stark contrast, this strategy has never exceeded a 7% account loss over seven years. This exceptional low MDD is achieved through deliberate design mechanisms, not luck:
🎯 Entry Filtering: The 'ADX Pop-up Filter' is the core component. It enables the strategy to strictly avoid trading when market conditions indicate major reversals or consolidation phases, thereby minimizing exposure to high-risk zones.
🏛️ Capital Preservation Priority: The strategy prioritizes investor psychological stability and capital preservation over pursuing maximum potential returns.
The Power of an 8.003 Profit Factor
The Profit Factor measures the ratio of total profitable trades to total losing trades. It's the most critical metric for assessing risk-adjusted returns.
A Profit Factor of 8.003 means that for every dollar lost, the strategy earns an average of eight dollars. This demonstrates the efficiency of a true trend-following strategy:
Cutting losses quickly (averaging $177,419 USD loss per trade)
Riding winners for maximum extension (averaging $1,419,920 USD profit per trade)
🛡️ II. 핵심 철학: 손실은 빠르게 자르고, 수익은 끝까지
암호화폐 시장에서 MDD <7%의 의미
암호화폐 선물 시장은 일일 변동성이 10%를 초과하는 경우가 빈번하며, 일반적인 전략들은 30~50%의 MDD를 겪습니다. 이와 극명한 대조로, 본 전략은 7년간 단 한 번도 7%를 초과하는 계좌 손실을 기록하지 않았습니다. 이렇게 극도로 낮은 MDD는 운이 아닌 체계적인 메커니즘을 통해 달성되었습니다:
🎯 진입 필터링: 'ADX 팝업 필터'가 핵심 구성 요소로, 시장 상황이 주요 반전이나 횡보를 나타낼 때 거래를 엄격히 회피하여 고위험 구간 노출을 최소화합니다.
🏛️ 자본 보존 우선: 본 전략은 최대 잠재 손실을 감수하기보다 투자자의 심리적 안정성과 자본 보존을 우선시하도록 설계되었습니다.
손익비 8.003의 힘
손익비는 '총 수익 거래'와 '총 손실 거래'의 비율로, 위험 조정 수익을 측정하는 핵심 지표입니다.
8.003이라는 값은 1달러를 잃을 때마다 평균적으로 8달러 이상을 벌어들이는 구조를 의미합니다. 이는 진정한 추세 추종 전략의 최대 효율성을 보여줍니다:
손실은 빠르게 자르고 ($177,419 USD 평균 손실)
수익은 최대한 연장합니다 ($1,419,920 USD 평균 수익)
🎯 III. Strategy Reliability and Structural Edge
The Secret of 24 Trades in 7 Years
Only 24 trades over 7 years signifies that this strategy ignores 99% of market volatility and targets only the 1% of 'most certain buying cycles'. This approach eliminates the drag from excessive trading:
❌ No commission bleed
❌ No slippage erosion
❌ No psychological wear from overtrading
📈 Long-Term Trend Following: The strategy analyzes Bitcoin's long-term price cycles to capture the onset of massive trends while remaining undisturbed by short-term market noise.
Non-Repainting Structure: Alignment of Reality and Simulation
🎬 Non-Repainting Proof Video Available
※↑ "If you wish, I can also show you a video as evidence of the non-repainting throughout the 7 years."
✅ Real-Time Trading Reliability: This strategy is built with a non-repainting structure, generating buy/sell signals only after each candle's closing price is confirmed.
✅ Preventing Data Exaggeration: This design ensures that backtest results do not 'repaint' or distort past performance, guaranteeing high correlation between simulated results and actual live trading environments.
✅ Live Trading Advantage: While simulations use closing prices, live trading may allow entry at more favorable prices before candle close, potentially yielding even better execution than backtest results.
🎯 III. 전략의 신뢰성과 구조적 우위
7년간 24회 거래의 비밀
7년간 단 24회의 거래는 시장 변동성의 99%를 무시하고 오직 1%의 '가장 확실한 매수 사이클'만을 타겟으로 한다는 것을 의미합니다. 이는 과도한 거래로 인한 문제를 근본적으로 제거합니다:
❌ 수수료 소모 없음
❌ 슬리피지 침식 없음
❌ 과도한 트레이딩으로 인한 심리적 소모 없음
📈 장기 추세 추종: 비트코인 가격 역사를 지배하는 장기 사이클 분석을 활용하여, 단기 시장 노이즈에 흔들리지 않고 대규모 추세의 시작점을 포착하는 데 집중합니다.
논-리페인팅 구조: 현실과 시뮬레이션의 일치
🎬 논-리페인팅 증명 영상 제공 가능
※↑ "원하신다면 7년간 리페인팅이 없음을 증명하는 영상도 보여드릴 수 있습니다."
✅ 실시간 거래 신뢰성: 본 전략은 논-리페인팅 구조로 구축되어, 캔들의 종가가 확정된 후에만 매수/매도 신호를 생성합니다.
✅ 데이터 과장 방지: 이러한 설계는 백테스트 결과가 과거 성과를 '리페인팅'하거나 과장하지 않도록 보장하며, 시뮬레이션 결과와 실제 라이브 거래 환경 간의 높은 상관관계를 보장합니다.
✅ 라이브 실행 우위 가능성: 시뮬레이션은 종가 기준이지만, 라이브 운영 시 캔들이 마감되기 전 더 유리한 가격에 진입할 수 있어 시뮬레이션 결과보다 더 나은 실행 성과를 얻을 가능성이 있습니다.
📈 IV. Performance Summary (November 14, 2018 - November 8, 2025)
| Metric | Value || Metric | Value |
|--------|-------|
| Initial Capital | $1,000,000 |
| Net Profit | +$26,091,383.74 |
| Cumulative Return | +2,609.14% |
| Maximum Drawdown | -6.999% |
| Total Trades | 24 |
| Winning Trades | 19 (79.17%) |
| Losing Trades | 5 (20.83%) |
| Avg Winning Trade | +$1,419,920.16 |
| Avg Losing Trade | -$177,419.86 |
| Profit Factor | 8.003 |
| Sortino Ratio | 11.486 |
| Win/Loss Ratio | 8.003 |
⚙️ Default Settings:
Slippage: 0 ticks
Commission: 0.333% (Bybit standard)
📈 IV. 성과 지표 요약 (2018년 11월 14일 ~ 2025년 11월 8일)
|| 지표 | 값 |
|--------|-------|
| 초기 자본 | $1,000,000 |
| 순이익 | +$26,091,383.74 |
| 누적 수익률 | +2,609.14% |
| 최대 낙폭 | -6.999% |
| 총 거래 횟수 | 24 |
| 수익 거래 | 19 (79.17%) |
| 손실 거래 | 5 (20.83%) |
| 평균 수익 거래 | +$1,419,920.16 |
| 평균 손실 거래 | -$177,419.86 |
| 손익비 | 8.003 |
| 소르티노 비율 | 11.486 |
| 평균 손익 비율 | 8.003 |
⚙️ 기본 설정:
슬리피지: 0틱 (기본값)
수수료: 0.333% (Bybit 표준)
👥 V. Who Is This Strategy For?
✅ Long-term Bitcoin investors seeking stable, low-drawdown returns
✅ Traders tired of overtrading who prefer surgical, sniper-style precision entries
✅ Investors seeking psychological stability by avoiding large account swings
✅ Data-driven decision makers who value proven performance over marketing claims
👥 V. 이 전략은 누구를 위한 것인가요?
✅ 안정적이고 낮은 낙폭의 수익을 추구하는 장기 비트코인 투자자
✅ 과도한 매매에 지친 트레이더로 저격수 스타일의 정밀한 진입을 선호하는 분
✅ 큰 계좌 변동을 피하여 심리적 안정성을 추구하는 투자자
✅ 주장보다 검증된 객관적 성과를 중시하는 데이터 기반 의사 결정자
🔒 VI. Access & Disclaimer
🔐 Access Type: Invite-Only (Protected Source Code)
💬 How to Get Access: Send a private message or leave a comment below
⚠️ Important Disclaimer:
Past performance does not guarantee future results. Cryptocurrency and futures trading involve substantial risk of loss. This strategy is provided for educational and informational purposes only. Users should conduct their own research and consult with a financial advisor before making investment decisions. The author is not responsible for any financial losses incurred from using this strategy.
🔒 VI. 접근 방법 및 면책사항
🔐 접근 유형: 초대 전용 (소스코드 보호)
💬 접근 방법: 비공개 메시지 또는 아래 댓글 남기기
⚠️ 중요 면책사항:
과거 성과가 미래 결과를 보장하지 않습니다. 암호화폐 및 선물 거래는 상당한 손실 위험을 수반합니다. 본 전략은 교육 및 정보 제공 목적으로만 제공됩니다. 사용자는 투자 결정을 내리기 전 자체 조사를 수행하고 재무 자문가와 상담해야 합니다. 저자는 본 전략 사용으로 인한 재정적 손실에 대해 책임지지 않습니다.
🏷️ VII. Tags
Bitcoin |Bitcoin | BTCUSD | BTCUSD.P | Bybit | DailyChart | LongTerm | TrendFollowing | ADX | NonRepainting | Strategy | BacktestProven | SevenYears | LowDrawdown | HighProfitFactor | StableReturns | CapitalPreservation | Ichimoku | DMI | SuperTrend | TechnicalAnalysis | Volatility | RiskManagement | AutoTrading | Futures | PerpetualFutures | AlgorithmicTrading | SystematicTrading | DataDriven | InviteOnly | ProtectedScript | SnipperTrading | HighConviction | MDD | SortinoRatio
🏷️ VII. 태그
비트코인 |비트코인 | BTCUSD | BTCUSD.P | 바이비트 | 일봉 | 장기투자 | 추세추종 | ADX | 논리페인팅 | 전략 | 백테스트검증 | 7년검증 | 저낙폭 | 고손익비 | 안정수익 | 자본보존 | 일목균형표 | DMI | 슈퍼트렌드 | 기술적분석 | 변동성 | 위험관리 | 자동매매 | 선물 | 무기한선물 | 알고리즘트레이딩 | 시스템트레이딩 | 데이터기반 | 초대전용 | 보호스크립트 | 저격수트레이딩 | 고확신 | MDD | 소르티노비율
📌 Note: This strategy is designed exclusively for Bybit BTCUSD.P perpetual futures on the 1-day (daily) timeframe. Performance may vary significantly on other symbols or timeframes.
📌 참고: 본 전략은 Bybit BTCUSD.P 무기한 선물 계약의 1일봉(Daily) 타임프레임에 전용으로 설계되었습니다. 다른 심볼이나 타임프레임에서는 성과가 크게 달라질 수 있습니다.

[Bybit BTCUSD.P] 7Years Backtest Results. 2,609% +Non-Repainting
📊 I. Strategy Overview: Trust Backed by Numbers
The ADX Sniper v12 strategy has been rigorously tested over 7 years, from November 14, 2018 to November 8, 2025, spanning every major cycle of the Bitcoin BTCUSD.P futures market. This strategy successfully balances two often-conflicting goals: maximizing profitability while minimizing volatility, all supported by objective performance data.
This strategy has been validated across all Bitcoin (BTCUSD.P) futures market cycles over a 7-year period.
■ Visual Proof: Bar Replay Simulation
The chart above demonstrates actual entry and exit points captured via TradingView's Bar Replay feature. The green rectangle highlights the core profitable trading zone, showing where the strategy successfully captured sustained uptrends. This visual evidence confirms:
1) Confirmed buy/sell signals with exact execution prices (marked in red and blue)
2) No repainting or signal distortion after candle close
3) Consistent performance across multiple market cycles within the highlighted zone
💰 Core Performance Metrics:
Cumulative Return : 2,609.14% (compounded growth over 7 years)
Maximum Drawdown (MDD) : 6.999% (preserving over 93% of capital)
Average Profit/Loss Ratio : 8.003 (industry-leading risk-reward efficiency)
Total Trades : 24 (focused exclusively on high-conviction opportunities)
Sortino Ratio : 11.486 (mathematically proving robustness and stability)
✅ This strategy has been validated across all Bitcoin BTCUSD.P futures market cycles over a 7-year period.
🛡️ II. Core Philosophy: Cut Losses Short, Let Profits Run
Why MDD Stays Below 7% in a Volatile Market
The crypto futures market typically experiences daily volatility exceeding 10%, with most strategies enduring drawdowns between 30% and 50%. In stark contrast, this strategy has never exceeded a 7% account loss over seven years. This exceptional low MDD is achieved through deliberate design mechanisms, not luck:
🎯 Entry Filtering: The 'ADX Pop-up Filter' is the core component. It enables the strategy to strictly avoid trading when market conditions indicate major reversals or consolidation phases, thereby minimizing exposure to high-risk zones.
🏛️ Capital Preservation Priority: The strategy prioritizes investor psychological stability and capital preservation over pursuing maximum potential returns.
The Power of an 8.003 Profit Factor
The Profit Factor measures the ratio of total profitable trades to total losing trades. It's the most critical metric for assessing risk-adjusted returns.
A Profit Factor of 8.003 means that for every dollar lost, the strategy earns an average of eight dollars. This demonstrates the efficiency of a true trend-following strategy:
Cutting losses quickly (averaging $177,419 USD loss per trade)
Riding winners for maximum extension (averaging $1,419,920 USD profit per trade)
🎯 III. Strategy Reliability and Structural Edge
The Secret of 24 Trades in 7 Years
Only 24 trades over 7 years signifies that this strategy ignores 99% of market volatility and targets only the 1% of 'most certain buying cycles'. This approach eliminates the drag from excessive trading:
❌ No commission bleed
❌ No slippage erosion
❌ No psychological wear from overtrading
📈 Long-Term Trend Following: The strategy analyzes Bitcoin's long-term price cycles to capture the onset of massive trends while remaining undisturbed by short-term market noise.
Non-Repainting Structure: Alignment of Reality and Simulation
🎬 Non-Repainting Proof Video Available
※↑ "If you wish, I can also show you a video as evidence of the non-repainting throughout the 7 years."
✅ Real-Time Trading Reliability: This strategy is built with a non-repainting structure, generating buy/sell signals only after each candle's closing price is confirmed.
✅ Preventing Data Exaggeration: This design ensures that backtest results do not 'repaint' or distort past performance, guaranteeing high correlation between simulated results and actual live trading environments.
✅ Live Trading Advantage: While simulations use closing prices, live trading may allow entry at more favorable prices before candle close, potentially yielding even better execution than backtest results.
📈 IV. Performance Summary (November 14, 2018 - November 8, 2025)
|| Metric | Value |
|--------|-------|
| Initial Capital | $1,000,000 |
| Net Profit | +$26,091,383.74 |
| Cumulative Return | +2,609.14% |
| Maximum Drawdown | -6.999% |
| Total Trades | 24 |
| Winning Trades | 19 (79.17%) |
| Losing Trades | 5 (20.83%) |
| Avg Winning Trade | +$1,419,920.16 |
| Avg Losing Trade | -$177,419.86 |
| Profit Factor | 8.003 |
| Sortino Ratio | 11.486 |
| Win/Loss Ratio | 8.003 |
⚙️ Default Settings:
Slippage: 0 ticks
Commission: 0.333% (Bybit standard)
👥 V. Who Is This Strategy For?
✅ Long-term Bitcoin investors seeking stable, low-drawdown returns
✅ Traders tired of overtrading who prefer surgical, sniper-style precision entries
✅ Investors seeking psychological stability by avoiding large account swings
✅ Data-driven decision makers who value proven performance over marketing claims
🔒 VI. Access & Disclaimer
🔐 Access Type: Invite-Only (Protected Source Code)
💬 How to Get Access: Send a private message or leave a comment below
⚠️ Important Disclaimer:
Past performance does not guarantee future results. Cryptocurrency and futures trading involve substantial risk of loss. This strategy is provided for educational and informational purposes only. Users should conduct their own research and consult with a financial advisor before making investment decisions. The author is not responsible for any financial losses incurred from using this strategy.
🏷️ VII. Tags
Bitcoin |Bitcoin | BTCUSD | BTCUSD.P | Bybit | DailyChart | LongTerm | TrendFollowing | ADX | NonRepainting | Strategy | BacktestProven | SevenYears | LowDrawdown | HighProfitFactor | StableReturns | CapitalPreservation | Ichimoku | DMI | SuperTrend | TechnicalAnalysis | Volatility | RiskManagement | AutoTrading | Futures | PerpetualFutures | AlgorithmicTrading | SystematicTrading | DataDriven | InviteOnly | ProtectedScript | SnipperTrading | HighConviction | MDD | SortinoRatio
📌 Note: This strategy is designed exclusively for Bybit BTCUSD.P perpetual futures on the 1-day (daily) timeframe. Performance may vary significantly on other symbols or timeframes.

Lunar calendar day Crypto Trading StrategyLunar calendar day Crypto Trading Strategy
This strategy explores the potential impact of the lunar calendar on cryptocurrency price cycles.
It implements a simple but unconventional rule:
Buy on the 5th day of each lunar month
Sell on the 26th day of the lunar month
No trades between January 1 (solar) and Lunar New Year’s Day (holiday buffer period)
Research background
Several academic studies have investigated the influence of lunar cycles on financial markets. Their findings suggest:
Returns tend to be higher around the full moon compared to the new moon.
Periods between the full moon and the waning phase often show stronger average returns than the waxing phase.
This strategy combines those observations into a practical implementation by testing fixed entry (lunar day 5) and exit (lunar day 26) points, while excluding the transition period from solar New Year to Lunar New Year, effectively capturing mid-month lunar effects.
How it works
The script includes a custom lunar date calculation function, reconstructing lunar months and days for each year (2020–2026).
On lunar day 5, the strategy opens a long position with 100% of equity.
On lunar day 26, the strategy closes the position.
No trades are executed between Jan 1 and Lunar New Year’s Day.
All trades include:
Commission: 0.1%
Slippage: 3 ticks
Position sizing uses the entire equity (100%) for simplicity, but this is not recommended for live trading.
Why this is original
Unlike mashups of built-in indicators, this script:
Implements a full lunar calendar system inside Pine Script.
Translates academic findings on lunar effects into an applied backtest.
Adds a realistic trading filter (holiday gap) based on cultural/seasonal calendar rules.
Provides researchers and traders with a framework to explore non-traditional, time-based signals.
Notes
This is an experimental, research-oriented strategy, not financial advice.
Results are highly dependent on the chosen period (2020–2026).
Using 100% equity per trade is for simplification only and is not a viable money management practice.
The purpose is to investigate whether cyclical patterns linked to lunar time can provide any statistical edge in ETHUSDT.

Bitcoin Logarithmic Growth Curve 2025 Z-Score"The Bitcoin logarithmic growth curve is a concept used to analyze Bitcoin's price movements over time. The idea is based on the observation that Bitcoin's price tends to grow exponentially, particularly during bull markets. It attempts to give a long-term perspective on the Bitcoin price movements.
The curve includes an upper and lower band. These bands often represent zones where Bitcoin's price is overextended (upper band) or undervalued (lower band) relative to its historical growth trajectory. When the price touches or exceeds the upper band, it may indicate a speculative bubble, while prices near the lower band may suggest a buying opportunity.
Unlike most Bitcoin growth curve indicators, this one includes a logarithmic growth curve optimized using the latest 2024 price data, making it, in our view, superior to previous models. Additionally, it features statistical confidence intervals derived from linear regression, compatible across all timeframes, and extrapolates the data far into the future. Finally, this model allows users the flexibility to manually adjust the function parameters to suit their preferences.
The Bitcoin logarithmic growth curve has the following function:
y = 10^(a * log10(x) - b)
In the context of this formula, the y value represents the Bitcoin price, while the x value corresponds to the time, specifically indicated by the weekly bar number on the chart.
How is it made (You can skip this section if you’re not a fan of math):
To optimize the fit of this function and determine the optimal values of a and b, the previous weekly cycle peak values were analyzed. The corresponding x and y values were recorded as follows:
113, 18.55
240, 1004.42
451, 19128.27
655, 65502.47
The same process was applied to the bear market low values:
103, 2.48
267, 211.03
471, 3192.87
676, 16255.15
Next, these values were converted to their linear form by applying the base-10 logarithm. This transformation allows the function to be expressed in a linear state: y = a * x − b. This step is essential for enabling linear regression on these values.
For the cycle peak (x,y) values:
2.053, 1.268
2.380, 3.002
2.654, 4.282
2.816, 4.816
And for the bear market low (x,y) values:
2.013, 0.394
2.427, 2.324
2.673, 3.504
2.830, 4.211
Next, linear regression was performed on both these datasets. (Numerous tools are available online for linear regression calculations, making manual computations unnecessary).
Linear regression is a method used to find a straight line that best represents the relationship between two variables. It looks at how changes in one variable affect another and tries to predict values based on that relationship.
The goal is to minimize the differences between the actual data points and the points predicted by the line. Essentially, it aims to optimize for the highest R-Square value.
Below are the results:
snapshot
snapshot
It is important to note that both the slope (a-value) and the y-intercept (b-value) have associated standard errors. These standard errors can be used to calculate confidence intervals by multiplying them by the t-values (two degrees of freedom) from the linear regression.
These t-values can be found in a t-distribution table. For the top cycle confidence intervals, we used t10% (0.133), t25% (0.323), and t33% (0.414). For the bottom cycle confidence intervals, the t-values used were t10% (0.133), t25% (0.323), t33% (0.414), t50% (0.765), and t67% (1.063).
The final bull cycle function is:
y = 10^(4.058 ± 0.133 * log10(x) – 6.44 ± 0.324)
The final bear cycle function is:
y = 10^(4.684 ± 0.025 * log10(x) – -9.034 ± 0.063)
The main Criticisms of growth curve models:
The Bitcoin logarithmic growth curve model faces several general criticisms that we’d like to highlight briefly. The most significant, in our view, is its heavy reliance on past price data, which may not accurately forecast future trends. For instance, previous growth curve models from 2020 on TradingView were overly optimistic in predicting the last cycle’s peak.
This is why we aimed to present our process for deriving the final functions in a transparent, step-by-step scientific manner, including statistical confidence intervals. It's important to note that the bull cycle function is less reliable than the bear cycle function, as the top band is significantly wider than the bottom band.
Even so, we still believe that the Bitcoin logarithmic growth curve presented in this script is overly optimistic since it goes parly against the concept of diminishing returns which we discussed in this post:
This is why we also propose alternative parameter settings that align more closely with the theory of diminishing returns."
Now with Z-Score calculation for easy and constant valuation classification of Bitcoin according to this metric.
Created for TRW

21DMA Structure Counter (EMA/SMA Option)21DMA Structure Counter (EMA/SMA Option)
Overview
The 21DMA Structure Counter is an advanced technical indicator that tracks consecutive periods where price action remains above a 21-period moving average structure. This indicator helps traders identify momentum phases and potential trend exhaustion points using statistical analysis.
Key Features
Moving Average Structure
- Configurable MA Type: Choose between EMA (Exponential Moving Average) or SMA (Simple Moving Average)
- 21-Period Default: Optimized for the widely-watched 21-period moving average
- Triple MA Structure: Tracks high, close, and low moving averages for comprehensive analysis
Statistical Analysis
- Cycle Counting: Automatically counts consecutive periods above the MA structure
- Historical Data: Maintains up to 2,500 historical cycles (approximately 10 years of daily data)
- Z-Score Calculation: Provides statistical context using mean and standard deviation
- Multiple Standard Deviation Levels: Displays +1, +2, and +3 standard deviation thresholds
Visual Indicators
Color-Coded Bars:
- Gray: Below 10-year average
- Yellow: Between average and +1 standard deviation
- Orange: Between +1 and +2 standard deviations
- Red: Between +2 and +3 standard deviations
- Fuchsia: Above +3 standard deviations (extreme readings)
Breadth Integration
- Multiple Breadth Options: NDFI, NDTH, NDTW (NASDAQ breadth indicators), or VIX
- Background Shading: Visual alerts when breadth reaches extreme levels
- High/Low Thresholds: Customizable levels for breadth analysis
- Real-time Display: Current breadth value shown in data table
Smart Reset Logic
- High Below Structure Reset: Automatically resets count when daily high falls below the lowest MA
- Flexible Hold Period: Continues counting during temporary weakness as long as structure isn't violated
- Precise Entry/Exit: Strict criteria for starting cycles, flexible for maintaining them
How to Use
Trend Identification
- Rising Counts: Indicate sustained momentum above key moving average structure
- Extreme Readings: Z-scores above +2 or +3 suggest potential trend exhaustion
- Historical Context: Compare current cycles to 10-year statistical averages
Risk Management
- Breadth Confirmation: Use breadth shading to confirm market-wide strength/weakness
- Statistical Extremes: Exercise caution when readings reach +3 standard deviations
- Reset Signals: Pay attention to structure violations for potential trend changes
Multi-Timeframe Application
- Daily Charts: Primary timeframe for swing trading and position management
- Weekly/Monthly: Longer-term trend analysis
- Intraday: Shorter-term momentum assessment (adjust MA period accordingly)
Settings
Moving Average Options
- Type: EMA or SMA selection
- Period: Default 21 (customizable)
- Reset Days: Days below structure required for reset
Visual Customization
- Standard Deviation Lines: Toggle and customize colors for +1, +2, +3 SD
- Breadth Selection: Choose from NDFI, NDTH, NDTW, or VIX
- Threshold Levels: Set custom high/low breadth thresholds
- Table Styling: Customize text colors, background, and font size
Technical Notes
- Data Retention: Maintains 2,500 historical cycles for robust statistical analysis
- Real-time Updates: Calculations update with each new bar
- Breadth Integration: Uses security() function to pull external breadth data
- Performance Optimized: Efficient array management prevents memory issues
Best Practices
1. Combine with Price Action: Use alongside support/resistance and chart patterns
2. Monitor Breadth Divergences: Watch for breadth weakness during strong readings
3. Respect Statistical Extremes: Exercise caution at +2/+3 standard deviation levels
4. Context Matters: Consider overall market environment and sector rotation
5. Risk Management: Use appropriate position sizing, especially at extreme readings
Disclaimer
This indicator is for educational and informational purposes only. It should not be used as the sole basis for trading decisions. Always combine with other forms of analysis and proper risk management techniques.
Compatible with Pine Script v6 | Optimized for daily timeframes | Best used on major indices and liquid stocks

Bitcoin: Pi Cycle Top & Bottom | QuantumResearchBitcoin: Pi Cycle Top & Bottom | QuantumResearch
Adaptive Deviation Model for Bitcoin Macro Extremes
Bitcoin: Pi Cycle Top & Bottom by QuantumResearch is a proprietary interpretation of the famous Pi Cycle concept—enhanced with normalized deviation logic, adjustable thresholds, and visual clarity. Unlike traditional models that simply cross two moving averages, this tool calculates the dynamic spread between a short-term and amplified long-term exponential average, delivering a continuous score that adapts to Bitcoin's evolving volatility profile.
🧠 What Makes It Unique?
🔹 Pi Deviation Engine:
This creates a centered, symmetric oscillator that better visualizes overextended conditions—something the original Pi Cycle model does not offer.
🔹 Dynamic Zoning via Thresholds:
Users can set custom top and bottom thresholds to adjust sensitivity based on current market regimes, making it more flexible than static crossover models.
🔹 Gradient-Powered Area Fill:
The oscillator plot is filled with directional gradients that react to the score's magnitude, creating an intuitive visual spectrum between bullish and bearish extremes.
🔹 Macro-Focused, Overlay-Free:
The indicator runs in a clean subpanel, preserving chart space and allowing better integration into multi-layered macro dashboards.
🔹 Built for BTC’s Unique Structure:
The moving average lengths and logic are specifically calibrated to Bitcoin’s halving-driven cycles, unlike generic Pi models applied across asset classes.
🔍 Key Features
✅ Continuous Cycle Score (not binary crosses)
✅ Custom upper/lower thresholds for signal flexibility
✅ Visual gradient fill and background shading
✅ Zero chart clutter (non-overlay)
✅ Fully customizable moving average lengths
✅ Designed for macro cycle top/bottom detection
📌 Ideal For:
Long-term Bitcoin investors
Macro traders and analysts
Those seeking early warning signs of euphoria or despair
Anyone using on-chain + cyclical tools to time large market pivots
⚠️ Disclaimer
This indicator is for educational and research purposes only.
It does not provide financial advice or guarantees.
Past performance does not predict future behavior.
Always confirm with additional tools and analysis.

AuriumFlowAURIUM (GOLD-Weighted Average with Fractal Dynamics)
Aurium is a cutting-edge indicator that blends volume-weighted moving averages (VWMA), fractal geometry, and Fibonacci-inspired calculations to deliver a precise and holistic view of market trends. By dynamically adjusting to price and volume, Aurium uncovers key levels of confluence for trend reversals and continuations, making it a powerful tool for traders.
Key Features:
Dynamic Trendline (GOLD):
The central trendline is a weighted moving average based on price and volume, tuned using Fibonacci-based fast (34) and slow (144) exponential moving average lengths. This ensures the trendline adapts seamlessly to the flow of market dynamics.
Formula:
GOLD = VWMA(34) * Volume Factor + VWMA(144) * (1 - Volume Factor)
Fractal Highs and Lows:
Detects pivotal market points using a fractal lookback period (default 5, odd-numbered). Fractals identify local highs and lows over a defined window, capturing the structure of market cycles.
Trend Background Highlighting:
Bullish Zone: Price above the GOLD line with a green background.
Bearish Zone: Price below the GOLD line with a red background.
Buy and Sell Alerts:
Generates actionable signals when fractals align with GOLD. Bullish fractals confirm continuation or reversal in an uptrend, while bearish fractals validate a downtrend.
The Math Behind Aurium:
Volume-Weighted Adjustments:
By integrating volume into the calculation, Aurium dynamically emphasizes price levels with greater participation, giving traders insight into zones of institutional interest.
Formula:
VWMA = EMA(Close * Volume) / EMA(Volume)
Fractal Calculations:
Fractals are identified as local maxima (highs) or minima (lows) based on the surrounding bars, leveraging the natural symmetry in price behavior.
Fibonacci Relationships:
The 34 and 144 EMA lengths are Fibonacci numbers, offering a natural alignment with price cycles and market rhythms.
Ideal For:
Traders seeking a precise and intuitive indicator for aligning with trends and detecting reversals.
Strategies inspired by Bill Williams, with added volume and fractal-based insights.
Short-term scalpers and long-term trend-followers alike.
Unlock deeper market insights and trade with precision using Aurium!

AMD-PO3-Goldbach levels [promuckaj]This script is developed on time & price, algorithmic market theory that is well explained in the book "Demystifying ICT" by Hopiplaka.
Indicators main features:
*PO3 - Goldbach(IPDA) levels which is based on the size of a price range (dealing range) as a factor of power of three (3^n).
There is PO3 numbers starting from 3 to 177147 as predefined, but also there is field for custom one so that users can experiment.
By selecting the PO3 number script calculate range low and range high using PO3 formula based on the current price and represent it on the chart into multiple levels of Goldbach numbers. At each this levels it is expected to see price that form block, fair value gap etc..., as defined in concept by ICT.
Levels:
Ext => External range
Low => Range low
High => Range high
FVG => Fair value gap
RB => Rejection block
OB => Order block
LV => Liquidity void
BR => Breaker
MB => Mitigation block
*AMD (Accumulation, Manipulation, Distribution) cycles, that can be modified by changing timings and colors.
Using PO3-Goldbach levels to identify where at the current time profile price is, there can be done trades in line with AMD cycles.
Default timings are set for Forex pairs.
*FVG, HIPPO, Displacement is well known parts of a market structure, so those three are also implemented here with some possible changes for them (colors, extension, labels...).
FVG => Fair value gap, imbalances in the market, or when buying and selling are not equal, in most cases can become a magnet for the price.
HIPPO => Hidden interbank price point objective, invention by Hopiplaka to demonstrate meaning of this "hidden" order block. It basically take the wicks of 2 consecutive bars that create a fair value gap.
DISPLACEMENT => It is practically similar to FVG but with option to measure length and strength, where in combination it will calculate and mark candle by looking back to the bars to determine the candle range standard deviation.
FEATURES:
-Multiple PO3 numbers, including special option to set your custom one
-Color and style customization
-Main levels mode, only Low, High and Equilibrium levels
-PO3 table with all PO3 calcs from multiple numbers, and mark the same levels from multiple
-Option to shift DR up or down
-Option to show you always upper/lower main DR levels (Low/High/Eq.)
NOTE:
-First of all special thanks to fxdmn that gives me idea from his indicator, how to present this through my own script.
-GB levels requires the correct symbols price calculation to work properly, everything is done by auto calc, tested well on EURUSD,SP500,DXY,Gold and BTC.

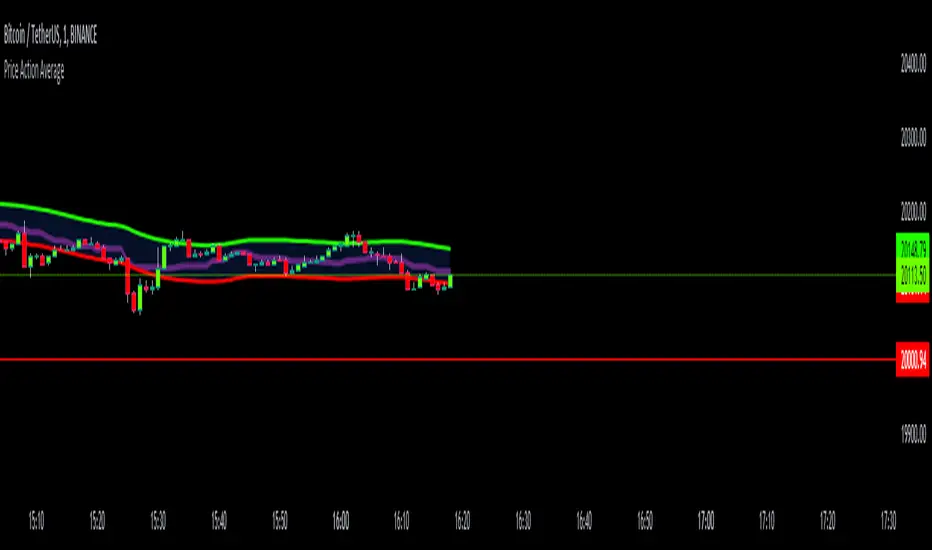
Price Action AverageThis indicator is perfect for scalping in 1 minute, it consists of a channel and a line that is made up of the average of the highs and lows of the price in 12 and 64 cycles.
The channel has as its center a 7 cycles SMA, when the average line (Called Signal, the purple one) crosses the upper band it is time to make a Long.
If it crosses the lower band it is time to make a short, if the line returns to the channel a signal appears to close the operation.
The indicator works with all timeframes, I use it on the 1 hour chart and I do the trades in 1 minute.
PA-Adaptive TRIX Log [Loxx]PA-Adaptive TRIX Log is a Phase Accumulation Adaptive TRIX Log indicator. This adaptation smooths the signal to catch larger trends.
What is TRIX?
TRIX is a momentum oscillator that displays the percent rate of change of a TEMA . It was developed in the early 1980's by Jack Hutson, an editor for "Technical Analysis of Stocks and Commodities" magazine. With its triple smoothing, TRIX is designed to filter insignificant price movements. In his article he uses a logarithm of a price (which is in many versions, left out).
What is the Phase Accumulation Cycle?
The phase accumulation method of computing the dominant cycle is perhaps the easiest to comprehend. In this technique, we measure the phase at each sample by taking the arctangent of the ratio of the quadrature component to the in-phase component. A delta phase is generated by taking the difference of the phase between successive samples. At each sample we can then look backwards, adding up the delta phases.When the sum of the delta phases reaches 360 degrees, we must have passed through one full cycle, on average.The process is repeated for each new sample.
The phase accumulation method of cycle measurement always uses one full cycle’s worth of historical data.This is both an advantage and a disadvantage.The advantage is the lag in obtaining the answer scales directly with the cycle period.That is, the measurement of a short cycle period has less lag than the measurement of a longer cycle period. However, the number of samples used in making the measurement means the averaging period is variable with cycle period. longer averaging reduces the noise level compared to the signal.Therefore, shorter cycle periods necessarily have a higher out- put signal-to-noise ratio.
Included
Bar coloring
2 signal options
Alerts

Planetary Signs█ OVERVIEW
This script is designed to highlight planetary signs. All 12 signs on all planets going from Mercury to Pluto on both Geocentric and Heliocentric settings.
If you are an astrology trader or if you do trade cycles, this script might be great for you because it highlights all these cycles automatically.
You can select one sign or multiple signs at once, you are also able to change the color of the cycle. It should work on all time frame but with future dates it's only set to daily resolution at the moment. Current time is in sync perfectly to the minute when the sign change.
█ Future Plans and upgrades to this script may include :
1. Increase future resolution; it's set to 120 days into the future with daily resolution.
2. More styling and labeling options
And more! Feel free to contact me with any feature that you would like to see in this script
█ How to use :
1. Open the settings.
2. Select the planet.
3. Enable your favorite sign or signs.
Then Press OK & give the script a few seconds and you should be set. You can add this script to your chart more than once!
This script is coded as an addon to the Gann ToolBox package/scripts.

Half-Pi Cycle CKB top indicator (insanely experimental)This is an insanely experimental script. It's a modified version of the Bitcoin pi-cycle top indicator.
It changes the Bitcoin pi-cycle top formula by halving the number of days in the two DMAs used in calculation, from 350/111 to 175/56. So I call it the half-pi cycle. It correctly picked the top of CKB (Nervos Network) vs USDT on Huobi in spring 2021 within three days.
It probably is a coincidence, and could very easily not pick the next cycle peak correctly at all. Using such a short number of days makes it a little dubious, but I had no choice since there's only so much price history for this coin. I strongly advise you to not make any trades based on this script ! I cannot be held accountable if you lose money due to this script. It hasn't been shown to be accurate multiple times like the Bitcoin pi-cycle top indicator. I simply find this interesting and want to see if it works next time.

Morphed Sine WaveIntroduction
If you rescale a sine wave to the price you will need to correlate it with it in order to show good results, today i present a different method that does not involve correlation to "morph" a sine wave to the price in order to provide forecast's and highlight market periodic patterns.
Parameters
length control the period of the sine wave, power control the "morphing" amount, if you see for example that the results are going nuts try to increase power , if the results are just the price and the delayed price try to decrease power .
power = 1
power = 100
Those settings might be different depending on which market you are in.
Various Uses
You can do a lot of things with this indicator, use filters as source :
Use the indicator as source for oscillators in order to create cycles indicators :
And certainly many more things
Conclusion
I presented a way to morph a sine wave to the price i order to highlight cycles. You can use any function that return a value between -1 and 1 instead of sin , this can be a scaled rsi/stochastic or correlation coefficient, its up to you :)
If you need help don't hesitate to commend or pm me. I hope you will like the indicator and that it will inspire you to make great things.
Thanks for reading !

PyraTime Harmonic 369Concept and Methodology PyraTime Harmonic 369 is a quantitative time-projection tool designed to apply Modular Arithmetic to market analysis. Unlike linear time indicators, this tool projects non-linear integer sequences derived from Digital Root Summation (Base-9 Reduction).
The core logic utilizes the mathematical progression of the 3-6-9 constants. By anchoring to a user-defined "Origin Pivot," the script projects three distinct harmonic triads to identify potential Temporal Confluence—moments where mathematical time cycles align with price action.
Technical Features This script focuses on the Standard Scalar (1x) projection of the Digital Root sequence:
The Root-3 Triad (Red): Projects intervals of 174, 285, 396. (Mathematical Sum: 1+7+4=12→3)
The Root-6 Triad (Green): Projects intervals of 417, 528, 639. (Mathematical Sum: 4+1+7=12→3, inverted)
The Root-9 Triad (Blue): Projects intervals of 741, 852, 963. (Mathematical Sum: 7+4+1=12→3... completion to 9)
How to Use
Set Anchor: Input the time of a significant High or Low in the settings.
Select Resolution: This tool is optimized for 1-minute (Micro-Harmonics) and 15-minute (Intraday Harmonics) charts.
Analyze Clusters: The vertical lines represent calculated harmonic intervals. Traders look for "Clusters" where a Root-3 and Root-9 cycle land on adjacent bars, indicating a high-probability pivot.
System Architecture & Version Comparison This script represents the foundational layer of the PyraTime ecosystem.
This Script (PyraTime Harmonic 369):
Scalar: Standard 1x Multiplier only.
Focus: Intraday & Micro-structure (1m, 15m).
Engine: Core Digital Root Integers.
PyraTime Harmonic Matrix (Advanced Edition):
Scalar Engine: Unlocks Quad-Fractal (4x), Tri-Fractal (3x), and Bi-Fractal (2x) multipliers for institutional cycle analysis.
Apex Logic: Auto-detection of the "963" Completion Sequence (Gold Highlight).
Event Horizon: Includes a live Predictive Dashboard that calculates the time-delta to the next harmonic event across all scalar groups.
Disclaimer This tool is for the educational analysis of Number Theory in financial markets. It projects time intervals and does not predict price direction. Past performance does not guarantee future results.

Sunday Open & Friday Close LinesSunday Open & Friday Close Lines — © Erica Lorrai | Trade Tribe HQ
A clean weekly anchor tool for traders who love simple, high-signal charting.
Clean charts, clean mind, clean trades.
This script marks the two most important moments of every trading week:
where the market closed… and where it truly reopened.
Designed for traders who use dealer-cycle logic, market structure, or BTMM-style timing, these lines help you instantly:
Spot weekend gaps
Identify weekly narrative shifts
See where the dealers reset liquidity
Anchor your weekly analysis with precision
Track the beginning of new cycles and the end of old ones
No clutter. No noise. Just two high-value levels that quietly run your entire week.
Customize the color, width, and line type to match your chart style and make weekly transitions impossible to miss.
Whether you're new to trading or deep into pattern-cycle logic, this little tool becomes one of those “how did I trade without this?” markers.
© Erica Lorrai — Trade Tribe HQ
Aloha & welcome to the Tribe. 🌺
How to Use
Add the script to your chart on any timeframe.
The indicator automatically detects each new trading week.
Two vertical lines will appear:
Friday Close Line – last candle before the weekend
Sunday Open Line – first candle of the new week
Use the settings panel to customize color, width, and line style.
These weekly anchors help you identify weekend gaps, weekly resets, and structural shifts in real time.
If you’re new here — welcome to the Tribe. 🌺
This little tool is one of the first things I teach my traders:
“See the week clearly, and the trades get clearer too.”
If you want more BTMM-style tools, weekly breakdowns, or want to learn the system behind these levels, come hang out at Trade Tribe HQ.
Happy trading.
— Erica Lorrai

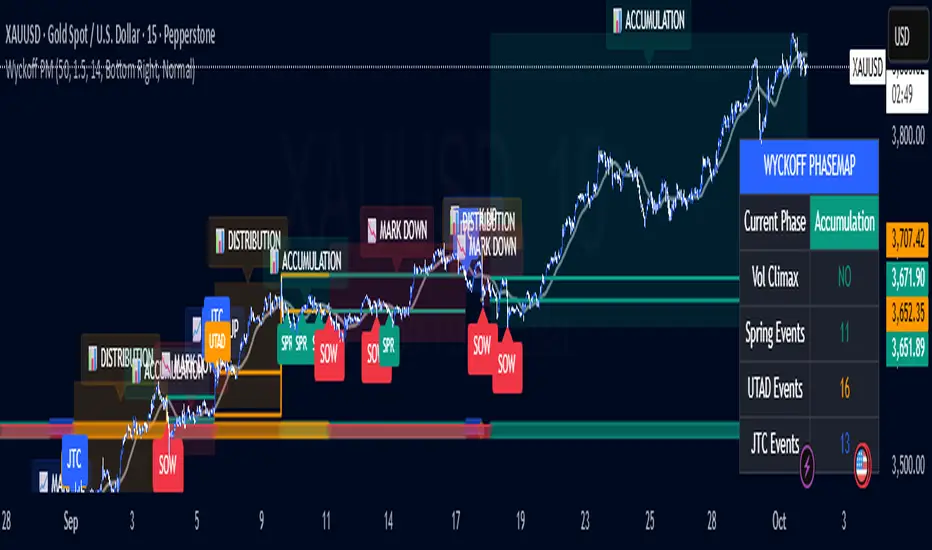
Wyckoff PhaseMap Overlay [FxalgoxPro]📊 Wyckoff PhaseMap Overlay
Professional Wyckoff Market Cycle Indicator for TradingView
━━━━━━━━━━━━━━━━━━━━━━━━━━━━━━━━━━━━━━━━
🎯 OVERVIEW
The Wyckoff PhaseMap Overlay is a sophisticated indicator that automatically identifies and visualizes the four phases of the Wyckoff Market Cycle on your price chart, combining price action analysis with volume confirmation to detect:
Phase 1: Accumulation (Cause)
Phase 2: Mark Up (Effect)
Phase 3: Distribution (Cause)
Phase 4: Mark Down (Effect)
━━━━━━━━━━━━━━━━━━━━━━━━━━━━━━━━━━━━━━━━
🔑 KEY FEATURES
📈 Phase Detection
Accumulation : Identifies selling climax (SC), automatic rally (AR), secondary tests (ST), and springs
Mark Up : Detects sustained uptrend with higher highs/higher lows structure
Distribution : Recognizes buying climax (BC), UTAD (upthrust after distribution), and range formation
Mark Down : Confirms breakdown with volume and downtrend structure
🎨 Visual Elements
Phase Background Colors : Optional color-coded backgrounds for each phase
Range Lines : Dynamic support/resistance levels during accumulation and distribution
Event Markers : Clear labels for Spring, UTAD, JTC (Jump the Creek), and breakdowns
Trend MA Overlay : Moving average for trend confirmation
Phase Labels : Large, descriptive labels when phases change
📊 Dashboard
Real-time phase status
Volume climax indicator
Event counters (Spring, UTAD, JTC)
Customizable position and size
🔔 Alerts
Phase change notifications
Spring detection
UTAD detection
Jump the Creek confirmation
Breakdown signals
━━━━━━━━━━━━━━━━━━━━━━━━━━━━━━━━━━━━━━━━
⚙️ CONFIGURATION
Wyckoff Phases (Main Settings)
Parameter | Default | Description
---------------------------- | ------- | -------------
Trend MA Length | 50 | Moving average for trend detection
Volume Climax Threshold | 1.5 | Multiplier for average volume to detect climax events
Range Detection Length | 14 | Lookback period for range identification
Phase 1: Accumulation
Toggle accumulation phase display
Show/hide Spring events
Show/hide AR (Automatic Rally) and ST (Secondary Test)
Customize phase and spring colors
Phase 2: Mark Up
Toggle mark up phase display
Show/hide Jump The Creek (JTC) events
Customize phase and JTC colors
Phase 3: Distribution
Toggle distribution phase display
Show/hide UTAD events
Show/hide BC (Buying Climax)
Customize phase and UTAD colors
Phase 4: Mark Down
Toggle mark down phase display
Customize phase and breakdown colors
Visual Settings
Show Phase Labels : Display large phase transition labels
Show Event Markers : Display Spring, UTAD, JTC markers
Show Phase Background : Color-code background by current phase
Dashboard
Show Dashboard : Toggle statistics panel
Position : Top Right / Bottom Right / Bottom Left
Size : Tiny / Small / Normal
━━━━━━━━━━━━━━━━━━━━━━━━━━━━━━━━━━━━━━━━
🧠 HOW IT WORKS
Phase Detection Logic
1️⃣ Accumulation (Cause)
Triggers:
- Selling climax detected (high volume + down move)
- Price enters range-bound consolidation
- Low volume compression
- Spring: False breakdown below support with low volume
2️⃣ Mark Up (Effect)
Triggers:
- Jump The Creek (JTC): Breakout from accumulation range
- Volume confirms breakout (>1.3x average)
- Higher highs and higher lows structure
- Price above trend MA
3️⃣ Distribution (Cause)
Triggers:
- Buying climax detected (high volume + up move)
- Price enters range-bound consolidation after uptrend
- UTAD: False breakout above resistance with volume
- Range compression
4️⃣ Mark Down (Effect)
Triggers:
- Breakdown from distribution range
- Volume confirms breakdown (>1.3x average)
- Lower lows and lower highs structure
- Price below trend MA
━━━━━━━━━━━━━━━━━━━━━━━━━━━━━━━━━━━━━━━━
📝 EVENT DEFINITIONS
Event | Phase | Description | Visual
-------- | ------------- | ------------------------------------------------ | -------------------------
SC | Accumulation | Selling Climax - panic selling with high volume | Volume spike + price drop
AR | Accumulation | Automatic Rally - bounce from oversold | Recovery move
ST | Accumulation | Secondary Test - retest of lows | Low volume test
Spring | Accumulation | False breakdown below support | 🟢 Label below
JTC | Mark Up | Jump The Creek - confirmed breakout | 🔵 Label (transition)
BC | Distribution | Buying Climax - euphoric buying with high volume | Volume spike + price rise
UTAD | Distribution | Upthrust After Distribution - false breakout | 🟠 Label above
SOW | Mark Down | Sign of Weakness - confirmed breakdown | 🔴 Label (transition)
━━━━━━━━━━━━━━━━━━━━━━━━━━━━━━━━━━━━━━━━
🎯 USE CASES
For Traders
Identify accumulation zones for potential long entries
Recognize distribution zones for potential short entries or exits
Confirm trend changes with phase transitions
Avoid false breakouts (Springs and UTADs)
Time entries using Jump The Creek signals
For Analysts
Market structure analysis across multiple timeframes
Volume-price divergence identification
Institutional behavior tracking (accumulation/distribution)
Cycle completion analysis
━━━━━━━━━━━━━━━━━━━━━━━━━━━━━━━━━━━━━━━━
🎨 RECOMMENDED SETTINGS
For Swing Trading (Daily/4H)
Trend MA Length: 50
Volume Climax Threshold: 1.5
Range Detection Length: 14
For Intraday Trading (1H/15m)
Trend MA Length: 20
Volume Climax Threshold: 2.0
Range Detection Length: 10
For Long-term Investors (Weekly)
Trend MA Length: 100
Volume Climax Threshold: 1.3
Range Detection Length: 20
━━━━━━━━━━━━━━━━━━━━━━━━━━━━━━━━━━━━━━━━
📚 WYCKOFF METHOD RESOURCES
The indicator is based on Richard Wyckoff's market cycle theory:
Accumulation → Smart money accumulates while retail panics
Mark Up → Price rises as smart money distributes to late buyers
Distribution → Smart money exits while retail buys
Mark Down → Price falls as retail holds losing positions
Learn More:
Wyckoff Analytics
Market cycle analysis
Volume Spread Analysis (VSA)
━━━━━━━━━━━━━━━━━━━━━━━━━━━━━━━━━━━━━━━━
⚠️ IMPORTANT NOTES
Volume Required : Indicator requires volume data (won't work on some Forex brokers without volume)
Timeframe : Best results on 1H, 4H, Daily, Weekly
Confirmation : Always combine with other analysis methods
Context : Phase detection improves with clean, trending markets
━━━━━━━━━━━━━━━━━━━━━━━━━━━━━━━━━━━━━━━━
🐛 TROUBLESHOOTING
Q: Why aren't any phases showing?
Ensure volume data is available for your symbol
Try adjusting Volume Climax Threshold (lower = more sensitive)
Check if Show Phase Background is enabled
Q: Too many false signals?
Increase Volume Climax Threshold for stricter detection
Increase Range Detection Length for better range identification
Use higher timeframes (4H/Daily)
Q: Dashboard not showing?
Check Show Dashboard is enabled in settings
Ensure panel isn't off-screen (try different position)
━━━━━━━━━━━━━━━━━━━━━━━━━━━━━━━━━━━━━━━━
👨💻 CREDITS
Developer : Fxalgox
Method : Richard Wyckoff Market Cycle Theory
━━━━━━━━━━━━━━━━━━━━━━━━━━━━━━━━━━━━━━━━
💡 TIPS FOR BEST RESULTS
Combine with Market Context : Use alongside market structure analysis
Multi-timeframe Confirmation : Check higher timeframe phase alignment
Volume is Key : Pay attention to volume climax indicators in dashboard
Be Patient : Wait for phase confirmations before taking action
Use Alerts : Set up alerts for phase changes and key events
━━━━━━━━━━━━━━━━━━━━━━━━━━━━━━━━━━━━━━━━
Happy Trading! 📈
Remember: This indicator is a tool for analysis, not financial advice. Always manage risk appropriately.
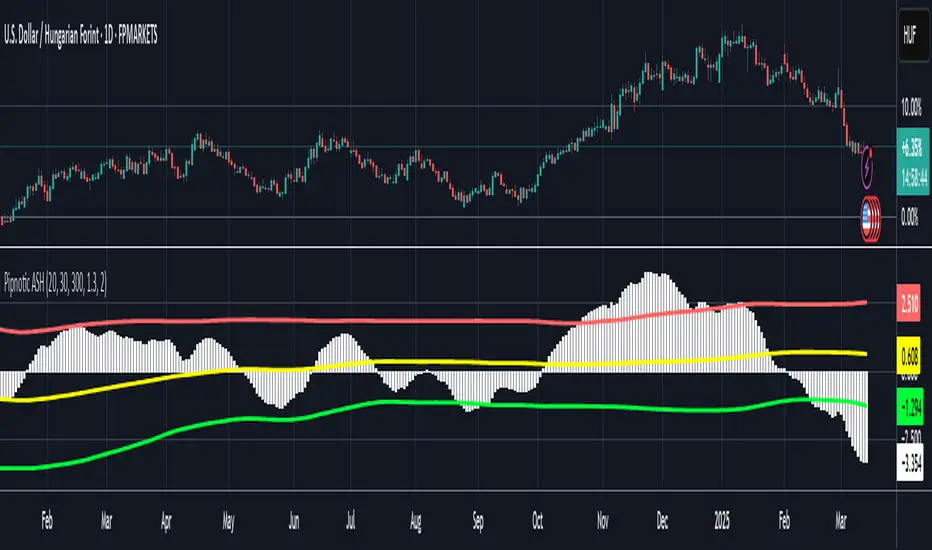
Pipnotic Asset Strength HistogramDescription
The Pipnotic Asset Strength Histogram (ASH) was originally developed to provide traders with a structured approach to identifying market cycles and momentum shifts. Due to increasing demand, it has been adapted for TradingView, ensuring traders can leverage its insights directly on their charts. This tool is particularly useful for spotting divergences, trend reversals, and price imbalances, making it an essential addition for traders who rely on momentum and strength-based analysis. We will continue to actively develop this indicator to enhance its functionality and accuracy.
How It Works
The ASH follows a systematic approach to analyse price movements and highlight key market dynamics:
Momentum & Cycle Analysis
Evaluates price movements using a dual-smoothing methodology.
Identifies shifts in momentum that indicate potential reversals or trend continuations.
Divergence Detection
Highlights instances where price action diverges from underlying momentum, signalling potential trading opportunities.
Helps confirm trade setups based on hidden and regular divergences.
Dynamic Visualization & Alerts
Plots a histogram to provide a clear visual representation of market strength.
Identifies buy and sell zones based on historical price deviations.
Updates dynamically, adapting to changing market conditions to maintain relevance.
Key Features & Inputs
Customizable Sensitivity: Traders can fine-tune cycle smoothing values to match different trading styles.
Clear Buy & Sell Zones: Highlights potential high-probability trading areas based on historical deviations.
Flexible Visualization: Adjustable histogram colours, line width, and mean deviation settings for optimal clarity.
Adaptability Across Markets: Works effectively on stocks, forex, crypto, and commodities.
Compatible with Various Trading Strategies: Can be used alongside trend-following, breakout, and reversal strategies for enhanced trade confirmation.
Benefits of Using the Pipnotic ASH Indicator
Market Timing: Helps traders identify optimal entry and exit points based on momentum shifts.
Reduces Subjectivity: Automates the detection of market strength and divergence, ensuring consistency.
Adapts to Market Conditions: Adjusts dynamically to price changes, ensuring relevant signals.
Saves Time & Effort: Eliminates the need for manual divergence analysis.
Works on All Timeframes: Suitable for scalping, swing trading, and long-term investing.
The Pipnotic Asset Strength Histogram is designed to streamline market analysis by providing clear, actionable insights into momentum shifts and divergences. Whether you're a day trader or a long-term investor, this tool helps refine your decision-making and enhance your trading strategy.