Correlated asset and Daye's Quarterly TheoryThis indicator is based on the Quarterly Theory concepts from Daye. You can find him mainly on X as traderdaye.
It works on a new panel and the quarters will be drawn over the chart of the correlated that you set on its settings.
You can use every asset to compare with the main one to make easier to find divergences between days, sessions and 90 minutes cycles.
In different timeframes, the indicator could show more or less information about quarters, but will always show the compared asset one. This is due to limitations of the candles start (for example, the Session's Q2 open won't be shown on an hourly chart because it starts after 30 minutes of candle's open).
What can this indicator do for you?
- Show the correlated asset chart.
- Show daily, session and 90 minutes cycle boxes.
- Show Midnight and every session's Q2 open.
- Make easier for the trained eye to determine if the model is AMDX or XAMD, find PO3, turtle soups, SMT divergences, etc.
Do you have any suggestion? Please, leave it on the comments. I'll try to improve this indicator regularly.
"Cycle" için komut dosyalarını ara

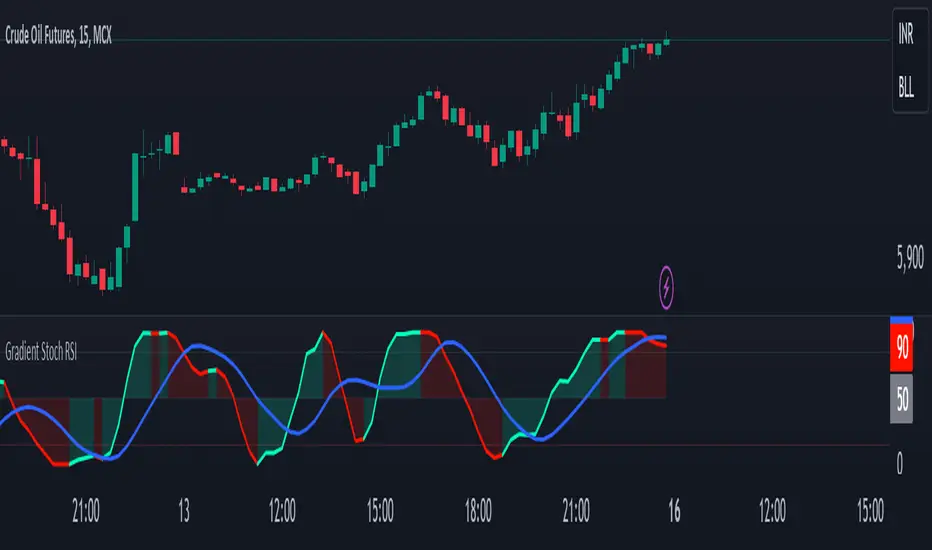
Gradient Stochastic RSI CyclesThe Gradient Stochastic RSI Cycles indicator combines several key technical concepts into one, providing a unique perspective compared to the traditional RSI (Relative Strength Index) and other indicators typically used . Here's a breakdown of the specific features that make this indicator stand out:
1. Stochastic RSI (StochRSI):
The Stochastic RSI is a momentum indicator that applies the Stochastic Oscillator formula to the RSI. While RSI alone measures overbought and oversold conditions based on the price's relative strength, StochRSI refines this by measuring the position of RSI relative to its own range over a specified period.
This approach helps identify overbought and oversold conditions more dynamically, and it can be a leading indicator compared to the traditional RSI, which may lag in certain market conditions.
2. Key Differences from Traditional RSI:
RSI (Traditional): The RSI directly compares the average gains and losses of the price over a set period (typically 14 periods). It outputs a value between 0 and 100, where values above 70 indicate overbought conditions and values below 30 suggest oversold conditions.
Stochastic RSI: Instead of being calculated from price itself, the StochRSI is derived from the RSI, which adds an additional layer of smoothness and filtering. This makes it more responsive to changes in market momentum, often producing faster signals, especially in volatile markets.
Key Advantage: The Stochastic RSI often generates more timely signals by incorporating both RSI and Stochastic Oscillator principles. This leads to clearer identification of trend reversals or continuation signals, especially in strongly trending or choppy markets.
3. Smoothing and Signal Generation:
%K and %D Smoothing: The indicator uses two key smoothing steps for generating signals: the %K line (stochastic RSI itself) and the %D line (a smoothed version of %K). These are typical of Stochastic indicators but applied to the RSI, making it more sophisticated and adaptive to market cycles.
The moving average of %K (denoted as the "MA Line") further refines the trend signals by smoothing the price action of the %K line. This allows for better trend recognition, reducing false signals in sideways markets.
Key Advantage: The added smoothing steps from the %K, %D, and MA Line help in producing less erratic signals, enabling smoother and more accurate trend-following behavior. The MA line is especially useful in filtering out noise in the Stochastic RSI.
4. Trend Direction (Bullish vs Bearish):
Bullish/Bearish Conditions: The indicator includes a clear trend identification mechanism, where the indicator is considered bullish when the %K line is above the %D line and bearish when it is below.
This distinction is visually represented with gradient colors, where the bullish condition is highlighted with a green color (often associated with upward momentum) and bearish with a red color (indicating downward pressure).
Key Advantage: By distinguishing the trend direction visually and dynamically, this feature adds a layer of market interpretation that is not present in the traditional RSI. It offers clarity in identifying bullish or bearish cycles within market movements, making it easier for traders to align their positions with prevailing market trends.
5. Gradient Colors and Visualization:
The indicator uses gradient colors to visually represent the market condition. The color changes dynamically based on whether the market is in a bullish or bearish state, providing immediate feedback to the trader on the momentum of the asset.
This color gradient approach adds a clear visual reference compared to the traditional line-based RSI indicators, where traders have to infer trend direction based on multiple readings or conditions.
Key Advantage: The color gradient not only serves as a trend indicator but also makes the signal more visually accessible and easier to interpret in real-time.
6. Threshold Levels and Overbought/Oversold Conditions:
Horizontal Lines at 15 and 85: These thresholds are used to mark oversold and overbought levels, similar to how the 30 and 70 levels function in the traditional RSI. The key difference here is that the Stochastic RSI is more sensitive to price movements, and thus these levels can be more dynamic and precise in identifying extreme market conditions.
Key Advantage: The Stochastic RSI's threshold levels offer more precise markers for overbought and oversold conditions in comparison to the RSI, providing better actionable insights during volatile market phases.
7. Gradient Fill between %K and Midline:
The indicator fills the area between the %K line and the Midline (50) based on whether the trend is bullish or bearish, with different opacities depending on the trend.
Key Advantage: This visual fill enhances the clarity of market cycles and trend phases, making it easier for traders to spot potential trend reversals or trend-following opportunities. The fill acts as a dynamic background to reinforce the current market sentiment.
Advanced Trend Following: Unlike basic RSI or Stochastic indicators, the Gradient Stochastic RSI Cycles indicator integrates trend-following principles with stochastic analysis applied to RSI, creating a powerful hybrid for capturing market momentum.
Dynamic Visual Feedback: The gradient color effect and fill based on trend direction give this indicator a unique visual aspect that makes market conditions more intuitive and easier to analyze at a glance. This is not available in traditional RSI or most common stochastic oscillators.
Enhanced Overbought/Oversold Signals: By utilizing the Stochastic RSI, this indicator offers more responsive overbought and oversold levels, often leading to earlier signals compared to the conventional RSI.
Smooth and Adaptive: The multiple smoothing steps used in the indicator (with %K, %D, and the MA line) provide a more adaptive approach to trend filtering, reducing false signals that often occur with basic indicators.
In summary, the Gradient Stochastic RSI Cycles indicator is an advanced, adaptive tool that combines RSI, Stochastic Oscillator, and moving averages to provide traders with more accurate, timely, and visually accessible market signals. Its design helps overcome many of the limitations associated with traditional RSI or stochastic-based indicators, offering a more refined analysis of price momentum.
Planetary Speed█ OVERVIEW
This script is designed to measure the speed of planets from Mercury to Pluto by comparing longitude data across time.
Planetary Speed cycles are very important for those trading Gann theory / Time theory and for Astrology Traders alike. You can toggle the mode of the planet
from a heliocentric setting to a geocentric one. This script is especially important for those who want to research the market and observe the effects of planetary cycles.
Planetary Speed works better on markets that do not close at the moment and on selected time frames ( all the default tradingview timeframes except the monthly ).
This script can also plot 250 days of future data with ease.
█ Future Plans and upgrades to this script may include :
1. Capability to work on different markets that do not open 24/7.
2. Adding lunar and solar speed.
And more! Feel free to contact me with any feature that you would like to see in this script
█ How to use :
1. Open the settings.
2. Select the planet.
3. Choose between Heliocentric and Geocentric
Then Press OK & give the script a few seconds and you should be set. You can add this script to your chart more than once!
This script is coded as an addon to the Gann ToolBox package/scripts.

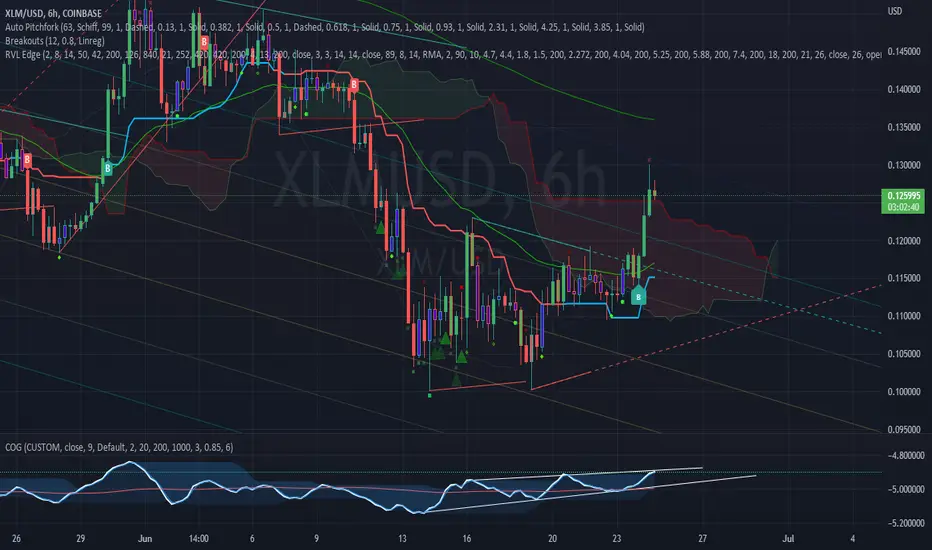
RVL Unreal Edge (concept build)Designed with a purpose, this script was intended for use by bots automating trading of XLM using a 6hr timeframe.
It's now being shaped into fantastic indicator on its own with very actionable signals and essentially zero lag. Much of the power behind it is derived from standard deviation/mean reversion strategies, and John Ehlers' incredible CG oscillator.
John Ehlers was an electrical engineer and Raytheon employee who began trading in the 1970's. He is best known for his work creating super-smoothing algorithms and methods of analysing cycle length and behaviour, and his work in the field of zero-lag indicators - indicators that don't follow the price action but are in fact capable of leading it actionably and responding with essentially zero lag.
By approaching the price action as a sine wave with a demonstrably fractal nature and thus subject to the phenomena of spectral dilation, Ehler's makes a number of important advancements. His CG indicator is derived from calculations typically used to derive the centre of gravity in a physical object. It effectively works as a band-pass filter, and is possibly one of the very best leading indicators available.
This script catches breakouts, tops and bottoms, leads reversals and the start/end of cycles. It functions as an excellent way to secure entries/exits around support and resistance. There are some methods of charting support and resistance built into the script currently, and lots more to add. One of the next major adjustments will be to hide or reduce the strength of buy/sell signals when price might be overextended (seen by the larger triangles, and + x symbols - these signal that a reversion back to the mean may be imminent).
The early version of this script had a 65% winrate and fantastic profit factor.
Stay tuned!
Support/Resistance:
The Ichimoku cloud, in this case has been custom tuned to the XLM 6 hour chart.
The 42 period EMA is a moving average that gets notable reactions from the price.
The 200 period EMA is the same.
The automatic Pitchfork almost always provides relevant Fibonacci based levels, but can sometimes require manually flicking through a few different presets to find a combination that fits the current price action. This will be automated in future.
Trading Psychology - Fear & Greed Index by DGTPsychology of a Market Cycle - Where are we in the cycle?
Before proceeding with the question "where", let's first have a quick look at "What is market psychology?"
Market psychology is the idea that the movements of a market reflect the emotional state of its participants. It is one of the main topics of behavioral economics - an interdisciplinary field that investigates the various factors that precede economic decisions. Many believe that emotions are the main driving force behind the shifts of financial markets and that the overall fluctuating investor sentiment is what creates the so-called psychological market cycles - which is also dynamic.
Stages of Investor Emotions:
* Optimism – A positive outlook encourages us about the future, leading us to buy stocks.
* Excitement – Having seen some of our initial ideas work, we begin considering what our market success could allow us to accomplish.
* Thrill – At this point we investors cannot believe our success and begin to comment on how smart we are.
* Euphoria – This marks the point of maximum financial risk. Having seen every decision result in quick, easy profits, we begin to ignore risk and expect every trade to become profitable.
* Anxiety – For the first time the market moves against us. Having never stared at unrealized losses, we tell ourselves we are long-term investors and that all our ideas will eventually work.
* Denial – When markets have not rebounded, yet we do not know how to respond, we begin denying either that we made poor choices or that things will not improve shortly.
* Fear – The market realities become confusing. We believe the stocks we own will never move in our favor.
* Desperation – Not knowing how to act, we grasp at any idea that will allow us to get back to breakeven.
* Panic – Having exhausted all ideas, we are at a loss for what to do next.
* Capitulation – Deciding our portfolio will never increase again, we sell all our stocks to avoid any future losses.
* Despondency – After exiting the markets we do not want to buy stocks ever again. This often marks the moment of greatest financial opportunity.
* Depression – Not knowing how we could be so foolish, we are left trying to understand our actions.
* Hope – Eventually we return to the realization that markets move in cycles, and we begin looking for our next opportunity.
* Relief – Having bought a stock that turned profitable, we renew our faith that there is a future in investing.
It's hard to predict with certainty where we exactly are in the market cycle, we can only make an educated guess as to the rough stage based on data available. And here comes the study "Trading Psychology - Fear & Greed Index"
Factors taken into account in this study include:
1-Price Momentum : Price Divergence/Convergence versus its Slow Moving Average
2-Strenght : Rate of Return (RoR) also called Return on Investment (ROI) is a performance measure used to evaluate the efficiency of an investment, net gain or loss of an investment over a specified time period, the rate of change in price movement over a period of time to help investors determine the strength
3-Money Flow : Chaikin Money Flow (CMF) is a technical analysis indicator used to measure Money Flow Volume over a set period of time. CMF can be used as a way to further quantify changes in buying and selling pressure and can help to anticipate future changes and therefore trading opportunities. CMF calculations is based on Accumulation/Distribution
4-Market Volatility : CBOE Volatility Index (VIX), the Volatility Index, or VIX, is a real-time market index that represents the market's expectation of 30-day forward-looking volatility. Derived from the price inputs of the S&P 500 index options, it provides a measure of market risk and investors' sentiments. It is also known by other names like "Fear Gauge" or "Fear Index." Investors, research analysts and portfolio managers look to VIX values as a way to measure market risk, fear and stress before they take investment decisions
5-Safe Haven Demand : in this study GOLD demand is assumed
What to look for :
*Fear and Greed Index as explained above,
*Divergencies
Tool tip of the label displayed provides details of references
Conclusion:
As investors, we always get caught up in the day to day price movements, and lose sight of the bigger picture. The biggest crashes happen not when investors are cautious and fearful, it's when they're euphoric and expecting financial instruments to continue going higher. So as we continue investing, don’t forget to stop and ask yourself, where in the chart do you think we are right now? The Market Psychology Cycle shines light on how emotions evolve, fear and greed index can come in handy, provided that it is not the only tool used to make investment decisions. It is easy to look back at market cycles and recognize how the overall psychology changed. Analyzing previous data makes it obvious what actions and decisions would have been the most profitable. However, it is much harder to understand how the market is changing as it goes - and even harder to predict what comes next. Many investors use technical analysis (TA) to attempt to anticipate where the market is likely to go. Investors are advised to keep tabs on fear for potential buying the dips opportunities and view periods of greed as a potential indicator that financial instruments might be overvalued.
Warren Buffett's quote, buy when others are fearful, and sell when others are greedy
Trading success is all about following your trading strategy and the indicators should fit within your trading strategy, and not to be traded upon solely
Disclaimer : The script is for informational and educational purposes only. Use of the script does not constitute professional and/or financial advice. You alone have the sole responsibility of evaluating the script output and risks associated with the use of the script. In exchange for using the script, you agree not to hold dgtrd TradingView user liable for any possible claim for damages arising from any decision you make based on use of the script

Swing Oracle Stock// (\_/)
// ( •.•)
// (")_(")
📌 Swing Oracle Stock – Professional Cycle & Trend Detection Indicator
The Swing Oracle Stock is an advanced market analysis tool designed to highlight price cycles, trend shifts, and key trading zones with precision. It combines trendline dynamics, normalized oscillators, and multi-timeframe confirmation into a single comprehensive indicator.
🔑 Key Features
NDOS (Normalized Dynamic Oscillator System):
Measures price strength relative to recent highs and lows to detect overbought, neutral, and oversold zones.
Dynamic Trendline (EMA8 or SMA231):
Flexible source selection for adapting to different trading styles (scalping vs. swing).
Multi-Timeframe H1 Confirmation:
Adds higher-timeframe validation to improve signal reliability.
Automated Buy & Sell Signals:
Triggered only on significant crossovers above/below defined levels.
Weekly Cycles (7-day M5 projection):
Tracks recurring time-based market cycles to anticipate reversal points.
Intuitive Visualization:
Colored zones (high, low, neutral) for quick market context.
Optional background and candlestick coloring for better clarity.
Multi-Timeframe Cross Table:
Automatically compares SMA50 vs. EMA200 across multiple timeframes (1m → 4h), showing clear status:
⭐️⬆️ UP = bullish trend confirmation
💀⬇️ Drop = bearish trend confirmation
📊 Built-in Statistical Tools
Normalized difference between short and long EMA.
Projected normalized mean levels plotted directly on the main chart.
Dynamic analysis of price distance from SMA50 to capture market “waves.”
🎯 Use Cases
Spot trend reversals with multi-timeframe confirmation.
Identify powerful breakout and breakdown zones.
Time entries and exits based on trend + cycle confluence.
Enhance market timing for swing trades, scalps, or long-term positions.
⚡ Swing Oracle Stock brings together cycle detection, oscillator normalization, and multi-timeframe confirmation into one streamlined indicator for traders who want a professional edge.

bands ⚡ What This Script Does
This is a structured trading system specifically designed for navigating Bitcoin cycles and identifying higher-probability buy setups.
It is not a simple combination of public indicators instead, it applies a rules-based logic to adapt signals dynamically depending on the current market phase (bull/bear), while also using a triple confirmation framework (macro trend + volatility bands + buy signals).
This approach aims to reduce false signals and align trading decisions with Bitcoin’s well-known cyclical behavior.
⚡ Core Concept & Components
The system combines three complementary elements:
A macro trend filter band (red/green), shown at the bottom of the chart, representing Bitcoin’s macro trend environment.
Adaptive volatility bands using advanced smoothing techniques including HMA, KAMA, WVMA, combined with moving average (MA) and average true range (ATR) logic to capture dynamic “cheap” and “expensive” price zones. These bands adapt to Bitcoin’s volatility structure better than standard Bollinger Bands or SMA plus ATR setups.
Multi-timeframe RSI-based Buy Signals on 8h, 1D, 1W, and 1M timeframes historically calibrated for Bitcoin cycles.
These components work together through a rules-based process, dynamically adapting signal validity depending on the macro trend state.
⚡ Signal System and how to use
The red and green band at the bottom of the chart represents Bitcoin’s macro trend environment:
Light Green → Likely start of a bull market
Dark Green → Market is bullish but becoming extended; potentially nearing a local top
Red → Bear market conditions
Our trading approach uses four distinct BUY signals, depending on the market phase:
Red (8h) → weak buy signal
Yellow (1D) → medium buy signal
Green (1W) → strong buy signal
Blue (1M) → strongest buy signal
However, Day Trading and Swing Trading signals are automatically blocked during bear markets (Red Band).
Reason: low timeframe signals (1 minute to 1 day) tend to perform poorly in bear markets, as major bottoms typically form on higher timeframes (1 week or 1 month).
Therefore, during Red Band conditions, only Buy Bear Market and Buy Recession signals remain active.
to use it correctly you must go to configuration of the indicator, section input and enable 4 buy signals and check every day timefarme 8h 1d 1w and 1m.
⚡ Invalidation Conditions
To exit the bear market, the system includes an invalidation condition:
If the price closes above a specific SMA on a defined timeframe, the Red Band switches to Green → signaling a potential market recovery.
Additionally, for the Red Band to activate initially, the system requires that:
Price must break below a specific Hull Moving Average (HMA) on a defined timeframe and length.
⚡ Why These 3 Indicators Work Well Together
If the band is green (bull market conditions) and a Buy signal (any color) appears → it is generally safer to buy in a bull market than in a bear market.
(I’m trying to apply the famous phrase "the trend is your friend" in this trading indicator and trading strategy.)
If the price is also touching the lower green band, and a Buy signal appears → the buy becomes even more reliable, as you are combining big trend plus band support plus signal confirmation.
This gives you triple confirmation:
Band color plus band level touch plus Buy signal → increasing the probability that the trade is going to work.
By combining:
Blocking low timeframe signals during bear markets
Using a clear invalidation point to detect recovery
Requiring a structural break via HMA to enter a bear market phase, and requiring a break above a specific SMA (length and timeframe) to enter a bull market
Applying a triple confirmation logic when conditions are favorable
→ this framework helps you navigate Bitcoin markets more securely and profitably than using unfiltered signals alone.
⚡ Why It’s Not a Simple Mashup
The logic of the system is not just an overlay of RSI, moving averages and bands:
It applies a structured "state machine" logic:
Macro Band determines which signals are allowed.
Band-level touches condition the strength of signals.
Triple confirmation (macro trend plus band level plus signal) governs high-probability setups.
Invalidation points (SMA breakouts) dynamically switch macro state, ensuring no lagging bull signals in a bear market or vice versa.
This makes the system superior to using public domain components in isolation, as those do not provide dynamic signal filtering nor respect Bitcoin’s macro cyclicality explicitly.
⚡ Why This is Invite-Only
This script reflects deep backtesting and original integration of state logic specific to Bitcoin cycles, I also tried to choose the the correct conditions and invalidation points by using hma and smas in specific timeframes and lengths,
it has a system that also block many wrong buy signals during bearmarkets.
It encapsulates a rules-based trading process which goes beyond simply combining public indicators. The aim is to provide traders with a coherent framework that reduces false signals, adapts to bitcoin cycles, and promotes risk-aware participation in Bitcoin markets.
I also refined the line aesthetics and thicknesses to improve chart readability and help users quickly identify key levels.
⚡ Disclaimer
This is an analytical tool, not financial advice. Use with appropriate risk management and as part of a broader trading strategy.
Past positive results this indicator achieved do NOT guarantee future success !!
Per TradingView rules:
The logic is described sufficiently so that traders understand what it does and how it works.
This is not a simple mashup, but an original framework applying structured logic to Bitcoin macro trading.
This is a COMPLEMENTARY tool designed for use by my existing clients who are already familiar with my trading strategy and risk management approach. If you are not one of my clients or do not know my trading strategy, please do NOT request access or attempt to purchase it !!
⚡ Conformance
This description is written to comply with TradingView’s script publishing rules (tradingview.com/pine-script-docs/en/v5/writing/Publishing.html), as per recent moderator feedback.
If further clarification is required, I welcome additional feedback.

BTC Growth | AlchimistOfCrypto🌈 BTC Regression Bands & Halvings – Unveiling Bitcoin's Logarithmic Growth Fields 🌈
"The Bitcoin Regression Bands, engineered through advanced logarithmic mathematics, visualizes the probabilistic distribution of Bitcoin's price evolution within a multi-cycle growth paradigm. This indicator employs principles from hyperbolic regression where decay coefficients create mathematical boundaries that define Bitcoin's long-term value progression. Our implementation features algorithmically enhanced rainbow visualization derived from extensive cycle analysis, creating a dynamic representation of Bitcoin's logarithmic growth with adaptive color gradients that highlight critical halving-based phase transitions in the asset's monetary evolution."
📊 Professional Trading Application
The Bitcoin Regression Bands transcends traditional price prediction models with a sophisticated multi-band illumination system that reveals the underlying structure of Bitcoin's monetary evolution. Scientifically calibrated across multiple halving cycles and featuring seamless rainbow visualization, it enables investors to perceive Bitcoin's position within its macro growth trajectory with unprecedented clarity.
- Visual Theming 🎨
Scientifically designed rainbow gradient optimized for cycle pattern recognition:
- Violet-Blue: Lower value accumulation zones with highest mathematical growth potential
- Green: Fair value equilibrium zone representing the regression mean
- Yellow-Orange: Moderate overvaluation regions indicating potential resistance
- Red: Statistical extreme zones indicating mathematical cycle peaks
- Halving Visualization 🔍
- Precise cycle boundaries demarcating Bitcoin's fundamental supply shock events
- Adaptive band spacing based on mathematical cycle progression
- Multiple sub-cycle markers revealing the probabilistic nature of Bitcoin's trajectory
🚀 How to Use
1. Identify Macro Position ⏰: Locate Bitcoin's current price relative to the regression bands
2. Understand Cycle Context 🎚️: Note position within the current halving cycle for time-based analysis
3. Assess Mathematical Value 🌈: Determine potential over/undervaluation based on band location
4. Adjust Investment Strategy 🔎: Modulate position sizing based on mathematical value assessment
5. Identify Cycle Phases ✅: Monitor band transitions to detect accumulation and distribution zones
6. Invest with Precision 🛡️: Utilize lower bands for strategic accumulation, upper bands for strategic reduction
7. Manage Risk Dynamically 🔐: Scale investment allocations based on mathematical cycle positioning

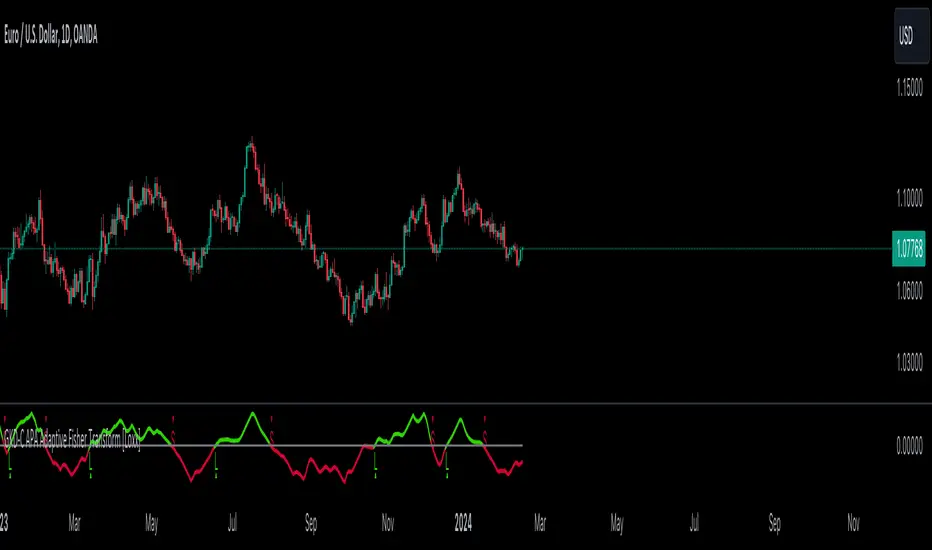
GKD-C APA Adaptive Fisher Transform [Loxx]The Giga Kaleidoscope GKD-C APA Adaptive Fisher Transform is a confirmation module included in Loxx's "Giga Kaleidoscope Modularized Trading System."
█ GKD-C APA Adaptive Fisher Transform
APA Adaptive Fisher Transform is an adaptive cycle Fisher Transform using Ehlers Autocorrelation Periodogram Algorithm to calculate the dominant cycle period.
What is an adaptive cycle, and what is Ehlers Autocorrelation Periodogram Algorithm?
From Ehlers' book Cycle Analytics for Traders Advanced Technical Trading Concepts by John F. Ehlers , 2013, page 135:
"Adaptive filters can have several different meanings. For example, Perry Kaufman’s adaptive moving average ( KAMA ) and Tushar Chande’s variable index dynamic average ( VIDYA ) adapt to changes in volatility . By definition, these filters are reactive to price changes, and therefore they close the barn door after the horse is gone.The adaptive filters discussed in this chapter are the familiar Stochastic , relative strength index ( RSI ), commodity channel index ( CCI ), and band-pass filter.The key parameter in each case is the look-back period used to calculate the indicator. This look-back period is commonly a fixed value. However, since the measured cycle period is changing, it makes sense to adapt these indicators to the measured cycle period. When tradable market cycles are observed, they tend to persist for a short while.Therefore, by tuning the indicators to the measure cycle period they are optimized for current conditions and can even have predictive characteristics.
The dominant cycle period is measured using the Autocorrelation Periodogram Algorithm. That dominant cycle dynamically sets the look-back period for the indicators. I employ my own streamlined computation for the indicators that provide smoother and easier to interpret outputs than traditional methods. Further, the indicator codes have been modified to remove the effects of spectral dilation.This basically creates a whole new set of indicators for your trading arsenal."
What is Fisher Transform?
The Fisher Transform is a technical indicator created by John F. Ehlers that converts prices into a Gaussian normal distribution.
The indicator highlights when prices have moved to an extreme, based on recent prices. This may help in spotting turning points in the price of an asset. It also helps show the trend and isolate the price waves within a trend.
█ Giga Kaleidoscope Modularized Trading System
Core components of an NNFX algorithmic trading strategy
The NNFX algorithm is built on the principles of trend, momentum, and volatility. There are six core components in the NNFX trading algorithm:
1. Volatility - price volatility; e.g., Average True Range, True Range Double, Close-to-Close, etc.
2. Baseline - a moving average to identify price trend
3. Confirmation 1 - a technical indicator used to identify trends
4. Confirmation 2 - a technical indicator used to identify trends
5. Continuation - a technical indicator used to identify trends
6. Volatility/Volume - a technical indicator used to identify volatility/volume breakouts/breakdown
7. Exit - a technical indicator used to determine when a trend is exhausted
8. Metamorphosis - a technical indicator that produces a compound signal from the combination of other GKD indicators*
*(not part of the NNFX algorithm)
What is Volatility in the NNFX trading system?
In the NNFX (No Nonsense Forex) trading system, ATR (Average True Range) is typically used to measure the volatility of an asset. It is used as a part of the system to help determine the appropriate stop loss and take profit levels for a trade. ATR is calculated by taking the average of the true range values over a specified period.
True range is calculated as the maximum of the following values:
-Current high minus the current low
-Absolute value of the current high minus the previous close
-Absolute value of the current low minus the previous close
ATR is a dynamic indicator that changes with changes in volatility. As volatility increases, the value of ATR increases, and as volatility decreases, the value of ATR decreases. By using ATR in NNFX system, traders can adjust their stop loss and take profit levels according to the volatility of the asset being traded. This helps to ensure that the trade is given enough room to move, while also minimizing potential losses.
Other types of volatility include True Range Double (TRD), Close-to-Close, and Garman-Klass
What is a Baseline indicator?
The baseline is essentially a moving average, and is used to determine the overall direction of the market.
The baseline in the NNFX system is used to filter out trades that are not in line with the long-term trend of the market. The baseline is plotted on the chart along with other indicators, such as the Moving Average (MA), the Relative Strength Index (RSI), and the Average True Range (ATR).
Trades are only taken when the price is in the same direction as the baseline. For example, if the baseline is sloping upwards, only long trades are taken, and if the baseline is sloping downwards, only short trades are taken. This approach helps to ensure that trades are in line with the overall trend of the market, and reduces the risk of entering trades that are likely to fail.
By using a baseline in the NNFX system, traders can have a clear reference point for determining the overall trend of the market, and can make more informed trading decisions. The baseline helps to filter out noise and false signals, and ensures that trades are taken in the direction of the long-term trend.
What is a Confirmation indicator?
Confirmation indicators are technical indicators that are used to confirm the signals generated by primary indicators. Primary indicators are the core indicators used in the NNFX system, such as the Average True Range (ATR), the Moving Average (MA), and the Relative Strength Index (RSI).
The purpose of the confirmation indicators is to reduce false signals and improve the accuracy of the trading system. They are designed to confirm the signals generated by the primary indicators by providing additional information about the strength and direction of the trend.
Some examples of confirmation indicators that may be used in the NNFX system include the Bollinger Bands, the MACD (Moving Average Convergence Divergence), and the MACD Oscillator. These indicators can provide information about the volatility, momentum, and trend strength of the market, and can be used to confirm the signals generated by the primary indicators.
In the NNFX system, confirmation indicators are used in combination with primary indicators and other filters to create a trading system that is robust and reliable. By using multiple indicators to confirm trading signals, the system aims to reduce the risk of false signals and improve the overall profitability of the trades.
What is a Continuation indicator?
In the NNFX (No Nonsense Forex) trading system, a continuation indicator is a technical indicator that is used to confirm a current trend and predict that the trend is likely to continue in the same direction. A continuation indicator is typically used in conjunction with other indicators in the system, such as a baseline indicator, to provide a comprehensive trading strategy.
What is a Volatility/Volume indicator?
Volume indicators, such as the On Balance Volume (OBV), the Chaikin Money Flow (CMF), or the Volume Price Trend (VPT), are used to measure the amount of buying and selling activity in a market. They are based on the trading volume of the market, and can provide information about the strength of the trend. In the NNFX system, volume indicators are used to confirm trading signals generated by the Moving Average and the Relative Strength Index. Volatility indicators include Average Direction Index, Waddah Attar, and Volatility Ratio. In the NNFX trading system, volatility is a proxy for volume and vice versa.
By using volume indicators as confirmation tools, the NNFX trading system aims to reduce the risk of false signals and improve the overall profitability of trades. These indicators can provide additional information about the market that is not captured by the primary indicators, and can help traders to make more informed trading decisions. In addition, volume indicators can be used to identify potential changes in market trends and to confirm the strength of price movements.
What is an Exit indicator?
The exit indicator is used in conjunction with other indicators in the system, such as the Moving Average (MA), the Relative Strength Index (RSI), and the Average True Range (ATR), to provide a comprehensive trading strategy.
The exit indicator in the NNFX system can be any technical indicator that is deemed effective at identifying optimal exit points. Examples of exit indicators that are commonly used include the Parabolic SAR, and the Average Directional Index (ADX).
The purpose of the exit indicator is to identify when a trend is likely to reverse or when the market conditions have changed, signaling the need to exit a trade. By using an exit indicator, traders can manage their risk and prevent significant losses.
In the NNFX system, the exit indicator is used in conjunction with a stop loss and a take profit order to maximize profits and minimize losses. The stop loss order is used to limit the amount of loss that can be incurred if the trade goes against the trader, while the take profit order is used to lock in profits when the trade is moving in the trader's favor.
Overall, the use of an exit indicator in the NNFX trading system is an important component of a comprehensive trading strategy. It allows traders to manage their risk effectively and improve the profitability of their trades by exiting at the right time.
What is an Metamorphosis indicator?
The concept of a metamorphosis indicator involves the integration of two or more GKD indicators to generate a compound signal. This is achieved by evaluating the accuracy of each indicator and selecting the signal from the indicator with the highest accuracy. As an illustration, let's consider a scenario where we calculate the accuracy of 10 indicators and choose the signal from the indicator that demonstrates the highest accuracy.
The resulting output from the metamorphosis indicator can then be utilized in a GKD-BT backtest by occupying a slot that aligns with the purpose of the metamorphosis indicator. The slot can be a GKD-B, GKD-C, or GKD-E slot, depending on the specific requirements and objectives of the indicator. This allows for seamless integration and utilization of the compound signal within the GKD-BT framework.
How does Loxx's GKD (Giga Kaleidoscope Modularized Trading System) implement the NNFX algorithm outlined above?
Loxx's GKD v2.0 system has five types of modules (indicators/strategies). These modules are:
1. GKD-BT - Backtesting module (Volatility, Number 1 in the NNFX algorithm)
2. GKD-B - Baseline module (Baseline and Volatility/Volume, Numbers 1 and 2 in the NNFX algorithm)
3. GKD-C - Confirmation 1/2 and Continuation module (Confirmation 1/2 and Continuation, Numbers 3, 4, and 5 in the NNFX algorithm)
4. GKD-V - Volatility/Volume module (Confirmation 1/2, Number 6 in the NNFX algorithm)
5. GKD-E - Exit module (Exit, Number 7 in the NNFX algorithm)
6. GKD-M - Metamorphosis module (Metamorphosis, Number 8 in the NNFX algorithm, but not part of the NNFX algorithm)
(additional module types will added in future releases)
Each module interacts with every module by passing data to A backtest module wherein the various components of the GKD system are combined to create a trading signal.
That is, the Baseline indicator passes its data to Volatility/Volume. The Volatility/Volume indicator passes its values to the Confirmation 1 indicator. The Confirmation 1 indicator passes its values to the Confirmation 2 indicator. The Confirmation 2 indicator passes its values to the Continuation indicator. The Continuation indicator passes its values to the Exit indicator, and finally, the Exit indicator passes its values to the Backtest strategy.
This chaining of indicators requires that each module conform to Loxx's GKD protocol, therefore allowing for the testing of every possible combination of technical indicators that make up the six components of the NNFX algorithm.
What does the application of the GKD trading system look like?
Example trading system:
Backtest: Multi-Ticker CC Backtest
Baseline: Hull Moving Average
Volatility/Volume: Hurst Exponent
Confirmation 1: Advance Trend Pressure as shown on the chart above
Confirmation 2: uf2018
Continuation: Coppock Curve
Exit: Rex Oscillator
Metamorphosis: Baseline Optimizer
Each GKD indicator is denoted with a module identifier of either: GKD-BT, GKD-B, GKD-C, GKD-V, GKD-M, or GKD-E. This allows traders to understand to which module each indicator belongs and where each indicator fits into the GKD system.
? Giga Kaleidoscope Modularized Trading System Signals
Standard Entry
1. GKD-C Confirmation gives signal
2. Baseline agrees
3. Price inside Goldie Locks Zone Minimum
4. Price inside Goldie Locks Zone Maximum
5. Confirmation 2 agrees
6. Volatility/Volume agrees
1-Candle Standard Entry
1a. GKD-C Confirmation gives signal
2a. Baseline agrees
3a. Price inside Goldie Locks Zone Minimum
4a. Price inside Goldie Locks Zone Maximum
Next Candle
1b. Price retraced
2b. Baseline agrees
3b. Confirmation 1 agrees
4b. Confirmation 2 agrees
5b. Volatility/Volume agrees
Baseline Entry
1. GKD-B Baseline gives signal
2. Confirmation 1 agrees
3. Price inside Goldie Locks Zone Minimum
4. Price inside Goldie Locks Zone Maximum
5. Confirmation 2 agrees
6. Volatility/Volume agrees
7. Confirmation 1 signal was less than 'Maximum Allowable PSBC Bars Back' prior
1-Candle Baseline Entry
1a. GKD-B Baseline gives signal
2a. Confirmation 1 agrees
3a. Price inside Goldie Locks Zone Minimum
4a. Price inside Goldie Locks Zone Maximum
5a. Confirmation 1 signal was less than 'Maximum Allowable PSBC Bars Back' prior
Next Candle
1b. Price retraced
2b. Baseline agrees
3b. Confirmation 1 agrees
4b. Confirmation 2 agrees
5b. Volatility/Volume agrees
Volatility/Volume Entry
1. GKD-V Volatility/Volume gives signal
2. Confirmation 1 agrees
3. Price inside Goldie Locks Zone Minimum
4. Price inside Goldie Locks Zone Maximum
5. Confirmation 2 agrees
6. Baseline agrees
7. Confirmation 1 signal was less than 7 candles prior
1-Candle Volatility/Volume Entry
1a. GKD-V Volatility/Volume gives signal
2a. Confirmation 1 agrees
3a. Price inside Goldie Locks Zone Minimum
4a. Price inside Goldie Locks Zone Maximum
5a. Confirmation 1 signal was less than 'Maximum Allowable PSVVC Bars Back' prior
Next Candle
1b. Price retraced
2b. Volatility/Volume agrees
3b. Confirmation 1 agrees
4b. Confirmation 2 agrees
5b. Baseline agrees
Confirmation 2 Entry
1. GKD-C Confirmation 2 gives signal
2. Confirmation 1 agrees
3. Price inside Goldie Locks Zone Minimum
4. Price inside Goldie Locks Zone Maximum
5. Volatility/Volume agrees
6. Baseline agrees
7. Confirmation 1 signal was less than 7 candles prior
1-Candle Confirmation 2 Entry
1a. GKD-C Confirmation 2 gives signal
2a. Confirmation 1 agrees
3a. Price inside Goldie Locks Zone Minimum
4a. Price inside Goldie Locks Zone Maximum
5a. Confirmation 1 signal was less than 'Maximum Allowable PSC2C Bars Back' prior
Next Candle
1b. Price retraced
2b. Confirmation 2 agrees
3b. Confirmation 1 agrees
4b. Volatility/Volume agrees
5b. Baseline agrees
PullBack Entry
1a. GKD-B Baseline gives signal
2a. Confirmation 1 agrees
3a. Price is beyond 1.0x Volatility of Baseline
Next Candle
1b. Price inside Goldie Locks Zone Minimum
2b. Price inside Goldie Locks Zone Maximum
3b. Confirmation 1 agrees
4b. Confirmation 2 agrees
5b. Volatility/Volume agrees
Continuation Entry
1. Standard Entry, 1-Candle Standard Entry, Baseline Entry, 1-Candle Baseline Entry, Volatility/Volume Entry, 1-Candle Volatility/Volume Entry, Confirmation 2 Entry, 1-Candle Confirmation 2 Entry, or Pullback entry triggered previously
2. Baseline hasn't crossed since entry signal trigger
4. Confirmation 1 agrees
5. Baseline agrees
6. Confirmation 2 agrees
Descending Elliot Wave Patterns [theEccentricTrader]█ OVERVIEW
This indicator automatically draws descending Elliot Wave patterns and price projections derived from the ranges that constitute the patterns.
█ CONCEPTS
Green and Red Candles
• A green candle is one that closes with a close price equal to or above the price it opened.
• A red candle is one that closes with a close price that is lower than the price it opened.
Swing Highs and Swing Lows
• A swing high is a green candle or series of consecutive green candles followed by a single red candle to complete the swing and form the peak.
• A swing low is a red candle or series of consecutive red candles followed by a single green candle to complete the swing and form the trough.
Peak and Trough Prices (Basic)
• The peak price of a complete swing high is the high price of either the red candle that completes the swing high or the high price of the preceding green candle, depending on which is higher.
• The trough price of a complete swing low is the low price of either the green candle that completes the swing low or the low price of the preceding red candle, depending on which is lower.
Historic Peaks and Troughs
The current, or most recent, peak and trough occurrences are referred to as occurrence zero. Previous peak and trough occurrences are referred to as historic and ordered numerically from right to left, with the most recent historic peak and trough occurrences being occurrence one.
Range
The range is simply the difference between the current peak and current trough prices, generally expressed in terms of points or pips.
Support and Resistance
• Support refers to a price level where the demand for an asset is strong enough to prevent the price from falling further.
• Resistance refers to a price level where the supply of an asset is strong enough to prevent the price from rising further.
Support and resistance levels are important because they can help traders identify where the price of an asset might pause or reverse its direction, offering potential entry and exit points. For example, a trader might look to buy an asset when it approaches a support level , with the expectation that the price will bounce back up. Alternatively, a trader might look to sell an asset when it approaches a resistance level , with the expectation that the price will drop back down.
It's important to note that support and resistance levels are not always relevant, and the price of an asset can also break through these levels and continue moving in the same direction.
Upper Trends
• A return line uptrend is formed when the current peak price is higher than the preceding peak price.
• A downtrend is formed when the current peak price is lower than the preceding peak price.
• A double-top is formed when the current peak price is equal to the preceding peak price.
Lower Trends
• An uptrend is formed when the current trough price is higher than the preceding trough price.
• A return line downtrend is formed when the current trough price is lower than the preceding trough price.
• A double-bottom is formed when the current trough price is equal to the preceding trough price.
Muti-Part Upper and Lower Trends
• A multi-part return line uptrend begins with the formation of a new return line uptrend, or higher peak, and continues until a new downtrend, or lower peak, completes the trend.
• A multi-part downtrend begins with the formation of a new downtrend, or lower peak, and continues until a new return line uptrend, or higher peak, completes the trend.
• A multi-part uptrend begins with the formation of a new uptrend, or higher trough, and continues until a new return line downtrend, or lower trough, completes the trend.
• A multi-part return line downtrend begins with the formation of a new return line downtrend, or lower trough, and continues until a new uptrend, or higher trough, completes the trend.
Double Trends
• A double uptrend is formed when the current trough price is higher than the preceding trough price and the current peak price is higher than the preceding peak price.
• A double downtrend is formed when the current peak price is lower than the preceding peak price and the current trough price is lower than the preceding trough price.
Muti-Part Double Trends
• A multi-part double uptrend begins with the formation of a new uptrend that proceeds a new return line uptrend, and continues until a new downtrend or return line downtrend ends the trend.
• A multi-part double downtrend begins with the formation of a new downtrend that proceeds a new return line downtrend, and continues until a new uptrend or return line uptrend ends the trend.
Wave Cycles
A wave cycle is here defined as a complete two-part move between a swing high and a swing low, or a swing low and a swing high. The first swing high or swing low will set the course for the sequence of wave cycles that follow; for example a chart that begins with a swing low will form its first complete wave cycle upon the formation of the first complete swing high and vice versa.
Figure 1.
Fibonacci Retracement and Extension Ratios
The Fibonacci sequence is a series of numbers in which each number is the sum of the two preceding numbers, starting with 0 and 1. For example 0 + 1 = 1, 1 + 1 = 2, 1 + 2 = 3, and so on. Ultimately, we could go on forever but the first few numbers in the sequence are as follows: 0 , 1, 1, 2, 3, 5, 8, 13, 21, 34, 55, 89, 144.
The extension ratios are calculated by dividing each number in the sequence by the number preceding it. For example 0/1 = 0, 1/1 = 1, 2/1 = 2, 3/2 = 1.5, 5/3 = 1.6666..., 8/5 = 1.6, 13/8 = 1.625, 21/13 = 1.6153..., 34/21 = 1.6190..., 55/34 = 1.6176..., 89/55 = 1.6181..., 144/89 = 1.6179..., and so on. The retracement ratios are calculated by inverting this process and dividing each number in the sequence by the number proceeding it. For example 0/1 = 0, 1/1 = 1, 1/2 = 0.5, 2/3 = 0.666..., 3/5 = 0.6, 5/8 = 0.625, 8/13 = 0.6153..., 13/21 = 0.6190..., 21/34 = 0.6176..., 34/55 = 0.6181..., 55/89 = 0.6179..., 89/144 = 0.6180..., and so on.
1.618 is considered to be the 'golden ratio', found in many natural phenomena such as the growth of seashells and the branching of trees. Some now speculate the universe oscillates at a frequency of 0,618 Hz, which could help to explain such phenomena, but this theory has yet to be proven.
Traders and analysts use Fibonacci retracement and extension indicators, consisting of horizontal lines representing different Fibonacci ratios, for identifying potential levels of support and resistance. Fibonacci ranges are typically drawn from left to right, with retracement levels representing ratios inside of the current range and extension levels representing ratios extended outside of the current range. If the current wave cycle ends on a swing low, the Fibonacci range is drawn from peak to trough. If the current wave cycle ends on a swing high the Fibonacci range is drawn from trough to peak.
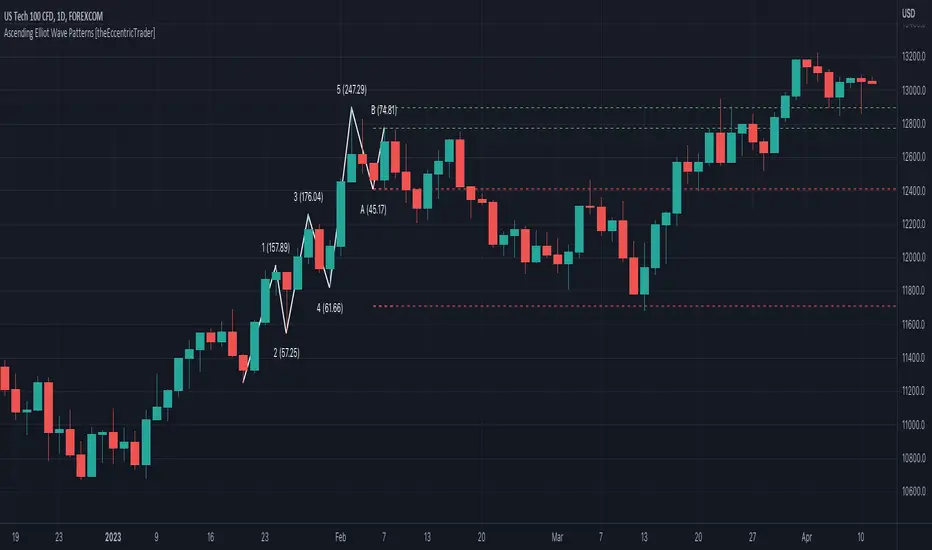
Elliot Wave Patterns
Ralph Nelson Elliott, authored his book on Elliott wave theory titled "The Wave Principle" in 1938. In this book, Elliott presented his theory of market behaviour, which he believed reflected the natural laws that govern human behaviour.
The Elliott Wave Theory is based on the principle that waves have a tendency to unfold in a specific sequence of five waves in the direction of the trend, followed by three waves leading in the opposite direction. This pattern is called a 5-3 wave pattern and is the foundation of Elliott's theory.
The five waves in the direction of the trend are labelled 1, 2, 3, 4, and 5, while the three waves in the opposite direction are labelled A, B, and C. Waves 1, 3, and 5 are impulse waves, while waves 2 and 4 are corrective waves. Waves A and C are also corrective waves, while wave B is an impulse wave.
According to Elliott, the pattern of waves is fractal in nature, meaning that it occurs on all time frames, from the smallest to the largest.
In Elliott Wave Theory, the distance that waves move from each other depends on the specific market conditions and the amplitude of the waves involved. There is no fixed rule or limit for how far waves should move from each other, however, there are several guidelines to help identify and measure wave distances. One of the most common guidelines is the Fibonacci ratios, which can be used to describe the relationships between wave lengths. For example, Elliott identified that wave 3 is typically the strongest and longest wave, and it tends to be 1.618 times the length of wave 1. Meanwhile, wave 2 tends to retrace between 50% and 78.6% of wave 1, and wave 4 tends to retrace between 38.2% and 78.6% of wave 3.
In general, the patterns are quite rare and the distances that the waves move in relation to one another is subject to interpretation. For such reasons, I have simply included the ratios of the current ranges as ratios of the preceding ranges in the wave labels and it will, ultimately, be up to the user to decide whether or not the patterns qualify as valid.
█ FEATURES
Inputs
• Show Projections
• Pattern Color
• Label Color
• Extend Current Projection Lines
█ LIMITATIONS
All green and red candle calculations are based on differences between open and close prices, as such I have made no attempt to account for green candles that gap lower and close below the close price of the preceding candle, or red candles that gap higher and close above the close price of the preceding candle. This may cause some unexpected behaviour on some markets and timeframes. I can only recommend using 24-hour markets, if and where possible, as there are far fewer gaps and, generally, more data to work with.

Ascending Elliot Wave Patterns [theEccentricTrader]█ OVERVIEW
This indicator automatically draws ascending Elliot Wave patterns and price projections derived from the ranges that constitute the patterns.
█ CONCEPTS
Green and Red Candles
• A green candle is one that closes with a close price equal to or above the price it opened.
• A red candle is one that closes with a close price that is lower than the price it opened.
Swing Highs and Swing Lows
• A swing high is a green candle or series of consecutive green candles followed by a single red candle to complete the swing and form the peak.
• A swing low is a red candle or series of consecutive red candles followed by a single green candle to complete the swing and form the trough.
Peak and Trough Prices (Basic)
• The peak price of a complete swing high is the high price of either the red candle that completes the swing high or the high price of the preceding green candle, depending on which is higher.
• The trough price of a complete swing low is the low price of either the green candle that completes the swing low or the low price of the preceding red candle, depending on which is lower.
Historic Peaks and Troughs
The current, or most recent, peak and trough occurrences are referred to as occurrence zero. Previous peak and trough occurrences are referred to as historic and ordered numerically from right to left, with the most recent historic peak and trough occurrences being occurrence one.
Range
The range is simply the difference between the current peak and current trough prices, generally expressed in terms of points or pips.
Support and Resistance
• Support refers to a price level where the demand for an asset is strong enough to prevent the price from falling further.
• Resistance refers to a price level where the supply of an asset is strong enough to prevent the price from rising further.
Support and resistance levels are important because they can help traders identify where the price of an asset might pause or reverse its direction, offering potential entry and exit points. For example, a trader might look to buy an asset when it approaches a support level , with the expectation that the price will bounce back up. Alternatively, a trader might look to sell an asset when it approaches a resistance level , with the expectation that the price will drop back down.
It's important to note that support and resistance levels are not always relevant, and the price of an asset can also break through these levels and continue moving in the same direction.
Upper Trends
• A return line uptrend is formed when the current peak price is higher than the preceding peak price.
• A downtrend is formed when the current peak price is lower than the preceding peak price.
• A double-top is formed when the current peak price is equal to the preceding peak price.
Lower Trends
• An uptrend is formed when the current trough price is higher than the preceding trough price.
• A return line downtrend is formed when the current trough price is lower than the preceding trough price.
• A double-bottom is formed when the current trough price is equal to the preceding trough price.
Muti-Part Upper and Lower Trends
• A multi-part return line uptrend begins with the formation of a new return line uptrend, or higher peak, and continues until a new downtrend, or lower peak, completes the trend.
• A multi-part downtrend begins with the formation of a new downtrend, or lower peak, and continues until a new return line uptrend, or higher peak, completes the trend.
• A multi-part uptrend begins with the formation of a new uptrend, or higher trough, and continues until a new return line downtrend, or lower trough, completes the trend.
• A multi-part return line downtrend begins with the formation of a new return line downtrend, or lower trough, and continues until a new uptrend, or higher trough, completes the trend.
Double Trends
• A double uptrend is formed when the current trough price is higher than the preceding trough price and the current peak price is higher than the preceding peak price.
• A double downtrend is formed when the current peak price is lower than the preceding peak price and the current trough price is lower than the preceding trough price.
Muti-Part Double Trends
• A multi-part double uptrend begins with the formation of a new uptrend that proceeds a new return line uptrend, and continues until a new downtrend or return line downtrend ends the trend.
• A multi-part double downtrend begins with the formation of a new downtrend that proceeds a new return line downtrend, and continues until a new uptrend or return line uptrend ends the trend.
Wave Cycles
A wave cycle is here defined as a complete two-part move between a swing high and a swing low, or a swing low and a swing high. The first swing high or swing low will set the course for the sequence of wave cycles that follow; for example a chart that begins with a swing low will form its first complete wave cycle upon the formation of the first complete swing high and vice versa.
Figure 1.
Fibonacci Retracement and Extension Ratios
The Fibonacci sequence is a series of numbers in which each number is the sum of the two preceding numbers, starting with 0 and 1. For example 0 + 1 = 1, 1 + 1 = 2, 1 + 2 = 3, and so on. Ultimately, we could go on forever but the first few numbers in the sequence are as follows: 0 , 1, 1, 2, 3, 5, 8, 13, 21, 34, 55, 89, 144.
The extension ratios are calculated by dividing each number in the sequence by the number preceding it. For example 0/1 = 0, 1/1 = 1, 2/1 = 2, 3/2 = 1.5, 5/3 = 1.6666..., 8/5 = 1.6, 13/8 = 1.625, 21/13 = 1.6153..., 34/21 = 1.6190..., 55/34 = 1.6176..., 89/55 = 1.6181..., 144/89 = 1.6179..., and so on. The retracement ratios are calculated by inverting this process and dividing each number in the sequence by the number proceeding it. For example 0/1 = 0, 1/1 = 1, 1/2 = 0.5, 2/3 = 0.666..., 3/5 = 0.6, 5/8 = 0.625, 8/13 = 0.6153..., 13/21 = 0.6190..., 21/34 = 0.6176..., 34/55 = 0.6181..., 55/89 = 0.6179..., 89/144 = 0.6180..., and so on.
1.618 is considered to be the 'golden ratio', found in many natural phenomena such as the growth of seashells and the branching of trees. Some now speculate the universe oscillates at a frequency of 0,618 Hz, which could help to explain such phenomena, but this theory has yet to be proven.
Traders and analysts use Fibonacci retracement and extension indicators, consisting of horizontal lines representing different Fibonacci ratios, for identifying potential levels of support and resistance. Fibonacci ranges are typically drawn from left to right, with retracement levels representing ratios inside of the current range and extension levels representing ratios extended outside of the current range. If the current wave cycle ends on a swing low, the Fibonacci range is drawn from peak to trough. If the current wave cycle ends on a swing high the Fibonacci range is drawn from trough to peak.
Elliot Wave Patterns
Ralph Nelson Elliott, authored his book on Elliott wave theory titled "The Wave Principle" in 1938. In this book, Elliott presented his theory of market behaviour, which he believed reflected the natural laws that govern human behaviour.
The Elliott Wave Theory is based on the principle that waves have a tendency to unfold in a specific sequence of five waves in the direction of the trend, followed by three waves leading in the opposite direction. This pattern is called a 5-3 wave pattern and is the foundation of Elliott's theory.
The five waves in the direction of the trend are labelled 1, 2, 3, 4, and 5, while the three waves in the opposite direction are labelled A, B, and C. Waves 1, 3, and 5 are impulse waves, while waves 2 and 4 are corrective waves. Waves A and C are also corrective waves, while wave B is an impulse wave.
According to Elliott, the pattern of waves is fractal in nature, meaning that it occurs on all time frames, from the smallest to the largest.
In Elliott Wave Theory, the distance that waves move from each other depends on the specific market conditions and the amplitude of the waves involved. There is no fixed rule or limit for how far waves should move from each other, however, there are several guidelines to help identify and measure wave distances. One of the most common guidelines is the Fibonacci ratios, which can be used to describe the relationships between wave lengths. For example, Elliott identified that wave 3 is typically the strongest and longest wave, and it tends to be 1.618 times the length of wave 1. Meanwhile, wave 2 tends to retrace between 50% and 78.6% of wave 1, and wave 4 tends to retrace between 38.2% and 78.6% of wave 3.
In general, the patterns are quite rare and the distances that the waves move in relation to one another is subject to interpretation. For such reasons, I have simply included the ratios of the current ranges as ratios of the preceding ranges in the wave labels and it will, ultimately, be up to the user to decide whether or not the patterns qualify as valid.
█ FEATURES
Inputs
• Show Projections
• Pattern Color
• Label Color
• Extend Current Projection Lines
█ LIMITATIONS
All green and red candle calculations are based on differences between open and close prices, as such I have made no attempt to account for green candles that gap lower and close below the close price of the preceding candle, or red candles that gap higher and close above the close price of the preceding candle. This may cause some unexpected behaviour on some markets and timeframes. I can only recommend using 24-hour markets, if and where possible, as there are far fewer gaps and, generally, more data to work with.
Elliott Wave - HAP [PRO] █ OVERVIEW
Meet HAP WAVE's real-time automated wave drawing tool on the chart. HAP WAVES Indicator is a technical analysis tool that uses Elliott Wave Theory and various technical indicators to analyze price and volume data in financial markets, such as crypto, stocks, and forex. It automatically draws Elliott Waves on the chart in real-time and provides features to identify potential buy and sell signals. The indicator can be used to identify target areas for waves 3, 5, and C, and shows both downward and upward waves. Additionally, the tool displays the real-time ratio of each wave and allows users to adjust wave rules flexibly. The tool also provides pre-sign analysis to help users predict future waves and includes alerts for various events, such as the start of a wave or the failure of a wave pattern. The indicator includes a trend channel and has several pairs of scan-wave tools. including real-time wave counting
════════════════════════
🎯 Feature
• Can draw wave lines in real time, indicating at that moment what wave the market is in.
• Automatically identify the target area of waves 3, 5, and C.
• Keep drawing waves automatically. All waves
• Shows both a downward wave (Bear) and an upward wave (Bull).
• Displays the real time ratio of each wave. (when hovering over the wave number)
• Each wave rule can be adjusted flexibly.
• Pre-show signs analyze waves that may occur in the future.
• Alert yourself when you encounter waves that are likely to occur in advance.
• Notify when meeting the start of a given wave.
• Alert when wave 2,4,A,B fail
• Notify when the wave is expanding again
• Multiple alert formats (save your alert, set it up just once, and receive all alerts according to 9–12)
• Hit Trend Channel from Automatic Coupled Price Swing
*There are also several pairs of scan wave tools.
════════════════════════
🔻Components
🎯 Unlocking the Power of the Elliott Wave Theory
feature that can set the starting point of the wave. by yourself
Trend Following Of course, adding this could be an element to help you make your decision easier.
Support and resistance
🎲 Scan version
This :
================================
🎯 Explanation of the wave counter setting section
════════════════════════
⬜ Understanding its basic principles and rules
Elliott Wave Prediction
Elliott Wave Theory is a technical analysis tool that seeks to identify patterns in financial market data and to make predictions about future price movements. The theory was developed by Ralph Nelson Elliott in the 1930s and is based on the idea that financial markets move in repetitive patterns, or waves, that can be analyzed and traded.
The Elliott Wave Theory has specific rules and guidelines for counting waves and determining their characteristics, including direction, size, and duration. The theory divides waves into two categories: motive waves (1, 2, 3, 4, and 5) and corrective waves (A, B, C). Motive waves are those that move in the direction of the overall trend and are subdivided into five smaller waves. Corrective waves are those that move against the trend and are subdivided into three smaller waves.
The theory also includes guidelines for determining the end of a wave and the start of a new wave, as well as rules for determining the characteristics of each wave, such as its size and duration. By analyzing the characteristics of waves and applying the rules and guidelines of the Elliott Wave Theory, traders and investors can make informed decisions about buying and selling in financial markets.
In summary, the Elliott Wave Theory is a technical analysis tool that seeks to identify patterns in financial market data and to make predictions about future price movements. The theory is based on the idea that financial markets move in repetitive patterns, or waves, and has specific rules and guidelines for counting and analyzing these waves.
>> The Elliott Wave Theory divides financial market movements into two categories: motive waves and corrective waves. Each wave has its own cycle and purpose, and understanding these cycles is important for making informed decisions about buying and selling in financial markets.
Motive Waves: Motive waves move in the direction of the overall trend and are subdivided into five smaller waves. The five waves of a motive wave cycle are:
•Wave 1: The first wave of a motive wave cycle is often referred to as the "impulse wave." This wave represents the beginning of a new trend and is characterized by strong price movements in the direction of the trend.
•Wave 2: The second wave is a corrective wave that retraces a portion of the gains made in Wave 1. This wave is usually smaller and less intense than Wave 1.
•Wave 3: The third wave is usually the longest and strongest wave of the motive wave cycle, and it represents the continuation of the trend. This wave is characterized by strong price movements in the direction of the trend and is usually much larger than Waves 1 and 2.
•Wave 4: The fourth wave is a corrective wave that retraces a portion of the gains made in Wave 3. This wave is usually smaller and less intense than Waves 1 and 3, and it provides a temporary pause in the trend.
•Wave 5: The fifth wave is the final wave of the motive wave cycle and is usually the shortest and weakest wave. This wave represents the end of the trend and is characterized by a final push in the direction of the trend.
Corrective Waves: Corrective waves move against the trend and are subdivided into three smaller waves. The three waves of a corrective wave cycle are:
•A. Wave A: The first wave of a corrective wave cycle is often referred to as the "A wave." This wave is characterized by a downward move against the trend and represents the start of a correction.
•B. Wave B: The second wave of a corrective wave cycle is the "B wave." This wave is characterized by an upward move against the trend, and it represents the counter-trend rally.
•C. Wave C: The final wave of a corrective wave cycle is the "C wave." This wave is characterized by a downward move in the direction of the trend, and it represents the completion of the correction.
In summary, the Elliott Wave Theory divides financial market movements into two categories: motive waves, which move in the direction of the trend, and corrective waves, which move against the trend. Understanding the cycle of each wave is important for making informed decisions about buying and selling in financial markets.
════════════════════════
🎯 CONCEPTS (Disclaimer)
Elliott Wave Count
The HAP WAVES indicator is designed for experienced traders who are familiar with advanced trading techniques. This tool is intended for day traders and long-term investors who have a solid understanding of the market and are looking to improve their trading strategy. The indicator was created by a well-known market analyst and is based on the principles and techniques documented in several books, including those by `Jason Perl`.
It is recommended that users of the HAP WAVES indicator have a good understanding of the concepts and techniques discussed in the books that cover this indicator. Before using the tool, it is important to have a good understanding of the underlying principles and techniques in order to make the most of the indicator and potentially improve your trading performance.
════════════════════════
🎯 Rules and Principles of this Indicator
* This description only addresses bullish (uptrend) markets, while bearish (downtrend) gives let you look a vice versa.
• ▶ HAP WAVES Requirements for Wave 1
The Wave 1 HAP WAVES requirements for a bullish (rising) market require that the market has closed a minimum of 21 bars below all 20 previous closes, then closes a maximum of 13 bars above all 12 previous closes, and finally reaches an 8 bar close below all 7 previous closes, to confirm that Wave 2 has formed.
• ▶ HAP WAVES Requirements for Wave 2
The first requirement for Wave 2 is the last requirement for Wave 1, which is a close of at least 8 bars with a close less than the previous 7 bars. Wave 2 continues until the market records a 21-bar close above all 20 previous closes, indicating the start of Wave 3.
• ▶ HAP WAVES Requirements for Wave 3
Wave 3 is confirmed after Wave 2 closes at 21 bars high, and it continues until there is a 13 bar close, indicating the end of Wave 3 and the start of Wave 4.
• ▶ HAP WAVES Requirements for Wave 4
The first requirement for Wave 4 is that there is a close at 13 bars after the end of Wave 3. Wave 4 is complete when the market records a 34 bar close (above all previous 33 closes), indicating the start of Wave 5.
• ▶ HAP WAVES Requirements for Wave 5
The first requirement for Wave 5 is a 34 bar close, signaling the end of Wave 4. The wave is considered complete when a 13 bar close is published, resulting in Wave A.
• ▶ HAP WAVES Requirements for Wave A
The HAP WAVES Requirements for Wave A state that the first call for Wave A is a 13 bar close (close below all previous 12 closes), signaling the end of Wave 5. Wave A is considered complete with an 8 bar high close (close above previous 7 closes), leading to the start of Wave B.
• ▶ HAP WAVES Requirements for Wave B
The first requirement for Wave B is a 8 bar high close (close above the previous 7 closes) after Wave A. Wave B is complete when there is a 21 bar low close (close below all 20 previous closes).
• ▶ HAP WAVES Requirements for Wave C
Wave C starts with a close of 21 bars low for Wave C, meaning the market close is below all 20 previous closes. Wave C is considered closed when the market closes below the close low of Wave A.
* Additional rules to apply the HAP WAVES indicator to the bullish trend
• The peak of Wave 3 must be higher than the close of Wave 1, and the peak of Wave 5 must be higher than the peak of Wave 3.
• If the pullback from Wave 1 is shallow, and the market later retraces above the high close of Wave 1, Wave 1 will slide to the right to align with the new high close.
• If the pullback from Wave 3 is shallow, and the market later retraces above the high close of Wave 3, Wave 3 will slide to the right to align with the new high close.
• Wave 5 will only be confirmed if Wave C crosses the low close of Wave A. If Wave B closes above the high close of Wave 5, Waves A, B and C will be erased and Wave 5 will slide to the right.
• If Wave 2 closes below the low close of Wave 1, the countdown will start over, and if Wave 4 closes below the low close of Wave 2, Wave 2 will move to the location of Wave 4.
• After Wave C crosses the low close of Wave A, Wave 5 will be locked in and cannot move. If the market later retraces above the high close of Wave 5, it will be marked as a new advance in Wave 1 rather than a blur of the previous Wave 5.
════════════════════════

APA Adaptive Fisher Transform [Loxx]APA Adaptive Fisher Transform is an adaptive cycle Fisher Transform using Ehlers Autocorrelation Periodogram Algorithm to calculate the dominant cycle period.
What is an adaptive cycle, and what is Ehlers Autocorrelation Periodogram Algorithm?
From Ehlers' book Cycle Analytics for Traders Advanced Technical Trading Concepts by John F. Ehlers , 2013, page 135:
"Adaptive filters can have several different meanings. For example, Perry Kaufman’s adaptive moving average ( KAMA ) and Tushar Chande’s variable index dynamic average ( VIDYA ) adapt to changes in volatility . By definition, these filters are reactive to price changes, and therefore they close the barn door after the horse is gone.The adaptive filters discussed in this chapter are the familiar Stochastic , relative strength index ( RSI ), commodity channel index ( CCI ), and band-pass filter.The key parameter in each case is the look-back period used to calculate the indicator. This look-back period is commonly a fixed value. However, since the measured cycle period is changing, it makes sense to adapt these indicators to the measured cycle period. When tradable market cycles are observed, they tend to persist for a short while.Therefore, by tuning the indicators to the measure cycle period they are optimized for current conditions and can even have predictive characteristics.
The dominant cycle period is measured using the Autocorrelation Periodogram Algorithm. That dominant cycle dynamically sets the look-back period for the indicators. I employ my own streamlined computation for the indicators that provide smoother and easier to interpret outputs than traditional methods. Further, the indicator codes have been modified to remove the effects of spectral dilation.This basically creates a whole new set of indicators for your trading arsenal."
What is Fisher Transform?
The Fisher Transform is a technical indicator created by John F. Ehlers that converts prices into a Gaussian normal distribution.
The indicator highlights when prices have moved to an extreme, based on recent prices. This may help in spotting turning points in the price of an asset. It also helps show the trend and isolate the price waves within a trend.
Included:
Zero-line and signal cross options for bar coloring
Customizable overbought/oversold thresh-holds
Alerts
Signals

Financial Astrology Uranus SpeedWhen Uranus is accelerating in speed from retrograde to direct phase, there is a quick acceleration of price change. We can observe very clearly that in BTCUSD the most relevant price growth periods happened after the retrogradation period, when Uranus was moving direct and accelerating. Additionally, is very clear that when Uranus is decelerating in speed a period of correction or price congestion occurs. Very similar speed effect pattern was observed for multiples planets speed cycles so is clear that what is good for price growth is that most of the planets are in direct motion.
Note: The Uranus speed indicator is based on an ephemeris array that covers years 2010 to 2030, prior or after this years the speed is not available, this daily ephemeris are based on UTC time so in order to align properly with the price bars times you should set UTC as your chart timezone.
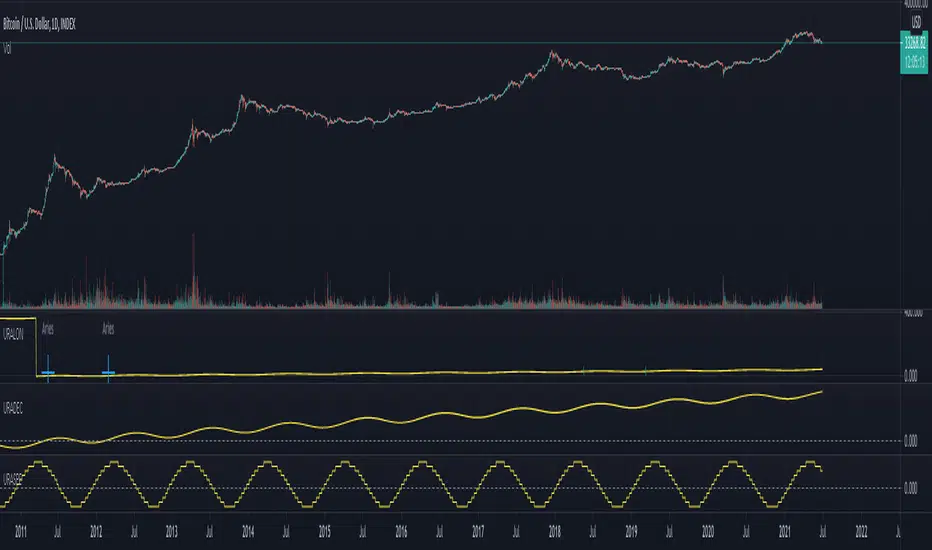
Oracle v2.0 [Market Vision]This algorithm uses Fibonacci Cycles to identify high probability reversal zones. It works on Crypto, Forex and Stocks. All timeframes are supported.
It contains several modes, such as "Equinox", "Regular", "Scalp" and "Fib". Use these modes to adjust the script to your favourite asset and timeframe.
This is a premium algorithm , that can be rented on a monthly basis.
PM if you are interested.
-Hawk
Some additional pictures:
15 minute 'Fib'
1 hour 'Equinox'

Grover Llorens Activator [alexgrover & Lucía Llorens] Trailing stops play a key role in technical analysis and are extremely popular trend following indicators. Their main strength lie in their ability to minimize whipsaws while conserving a decent reactivity, the most popular ones include the Supertrend, Parabolic SAR and Gann Hilo activator. However, and like many indicators, most trailing stops assume an infinitely long trend, which penalize their ability to provide early exit points, this isn't the case of the parabolic SAR who take this into account and thus converge toward the price at an increasing speed the longer a trend last.
Today a similar indicator is proposed. From an original idea of alexgrover & Lucía Llorens who wanted to revisit the classic parabolic SAR indicator, the Llorens activator aim to converge toward the price the longer a trend persist, thus allowing for potential early and accurate exit points. The code make use of the idea behind the price curve channel that you can find here :
I tried to make the code as concise as possible.
The Indicator
The indicator posses 2 user settings, length and mult , length control the rate of convergence of the indicator, with higher values of length making the indicator output converge more slowly toward the price. Mult is also related with the rate of convergence, basically once the price cross the trailing stop its value will become equal to the previous trailing stop value plus/minus mult*atr depending on the previous trailing stop value, therefore higher values of mult will require more time for the trailing stop to reach the closing price, use higher values of mult if you want to avoid potential whipsaws.
Above the indicator with slow convergence time (high length) and low mult.
Points with early exit points are highlighted.
Usage For Oscillators
The difference between the closing price and an overlay indicator can provide an oscillator with characteristics depending on the indicators used for differencing, Lucía Llorens stated that we should find indicators for differencing that highlight the cycles in the price, in other terms : Price - Signal , where we want to find Signal such that we maximize the visibility of the cycles, it can be demonstrated that in the case where the closing price is an additive model : Trend + Cycles + Noise , the zero lag estimation of the Trend component can allow for the conservation of the cycle and noise component, that is : Price - Estimate(Trend) , for example the difference between the price and moving average isn't optimal because of the moving average lag, instead the use of zero lag moving averages is more suitable, however the proposed indicator allow for a surprisingly good representation of the cycles when using differencing.
The normalization of this oscillator (via the RSI) allow to make the peak amplitude of the cycles more constant. Note however that such method can return an output with a sign inverse to the one of the original cycle component.
Conclusion
We proposed an indicator which share the logic of the SAR indicator, that is using convergence toward the price in order to provide early exit points detection. We have seen that this indicator can be used to highlight cycles when used for differencing and i don't exclude publishing more indicators based on this method.
Lucía Llorens has been a great person to work with, and provided enormous feedback and support while i was coding the indicator, this is why i include her in the indicator name as well as copyright notice. I hope we can make more indicators togethers in the future.
(altho i was against using buy/sells labels xD !)
Thanks for reading !
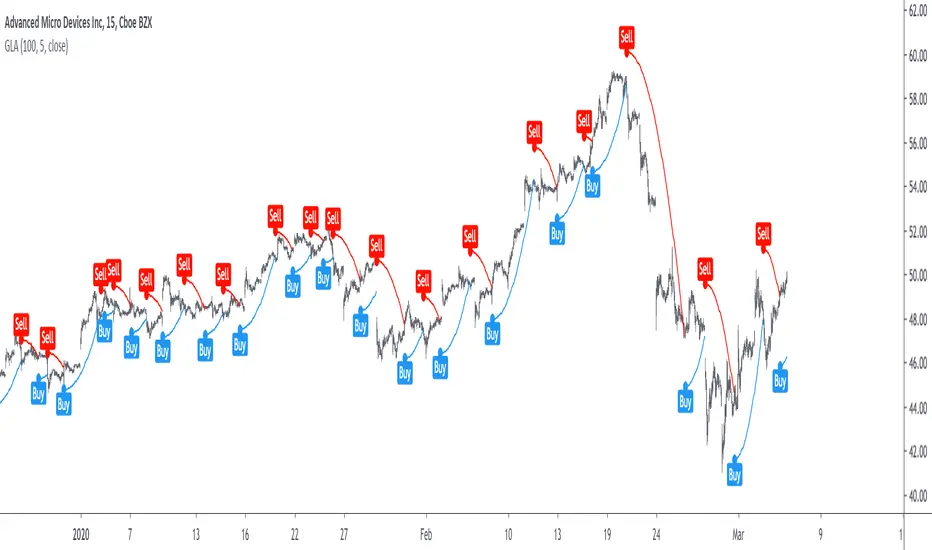
Markov Chain [3D] | FractalystWhat exactly is a Markov Chain?
This indicator uses a Markov Chain model to analyze, quantify, and visualize the transitions between market regimes (Bull, Bear, Neutral) on your chart. It dynamically detects these regimes in real-time, calculates transition probabilities, and displays them as animated 3D spheres and arrows, giving traders intuitive insight into current and future market conditions.
How does a Markov Chain work, and how should I read this spheres-and-arrows diagram?
Think of three weather modes: Sunny, Rainy, Cloudy.
Each sphere is one mode. The loop on a sphere means “stay the same next step” (e.g., Sunny again tomorrow).
The arrows leaving a sphere show where things usually go next if they change (e.g., Sunny moving to Cloudy).
Some paths matter more than others. A more prominent loop means the current mode tends to persist. A more prominent outgoing arrow means a change to that destination is the usual next step.
Direction isn’t symmetric: moving Sunny→Cloudy can behave differently than Cloudy→Sunny.
Now relabel the spheres to markets: Bull, Bear, Neutral.
Spheres: market regimes (uptrend, downtrend, range).
Self‑loop: tendency for the current regime to continue on the next bar.
Arrows: the most common next regime if a switch happens.
How to read: Start at the sphere that matches current bar state. If the loop stands out, expect continuation. If one outgoing path stands out, that switch is the typical next step. Opposite directions can differ (Bear→Neutral doesn’t have to match Neutral→Bear).
What states and transitions are shown?
The three market states visualized are:
Bullish (Bull): Upward or strong-market regime.
Bearish (Bear): Downward or weak-market regime.
Neutral: Sideways or range-bound regime.
Bidirectional animated arrows and probability labels show how likely the market is to move from one regime to another (e.g., Bull → Bear or Neutral → Bull).
How does the regime detection system work?
You can use either built-in price returns (based on adaptive Z-score normalization) or supply three custom indicators (such as volume, oscillators, etc.).
Values are statistically normalized (Z-scored) over a configurable lookback period.
The normalized outputs are classified into Bull, Bear, or Neutral zones.
If using three indicators, their regime signals are averaged and smoothed for robustness.
How are transition probabilities calculated?
On every confirmed bar, the algorithm tracks the sequence of detected market states, then builds a rolling window of transitions.
The code maintains a transition count matrix for all regime pairs (e.g., Bull → Bear).
Transition probabilities are extracted for each possible state change using Laplace smoothing for numerical stability, and frequently updated in real-time.
What is unique about the visualization?
3D animated spheres represent each regime and change visually when active.
Animated, bidirectional arrows reveal transition probabilities and allow you to see both dominant and less likely regime flows.
Particles (moving dots) animate along the arrows, enhancing the perception of regime flow direction and speed.
All elements dynamically update with each new price bar, providing a live market map in an intuitive, engaging format.
Can I use custom indicators for regime classification?
Yes! Enable the "Custom Indicators" switch and select any three chart series as inputs. These will be normalized and combined (each with equal weight), broadening the regime classification beyond just price-based movement.
What does the “Lookback Period” control?
Lookback Period (default: 100) sets how much historical data builds the probability matrix. Shorter periods adapt faster to regime changes but may be noisier. Longer periods are more stable but slower to adapt.
How is this different from a Hidden Markov Model (HMM)?
It sets the window for both regime detection and probability calculations. Lower values make the system more reactive, but potentially noisier. Higher values smooth estimates and make the system more robust.
How is this Markov Chain different from a Hidden Markov Model (HMM)?
Markov Chain (as here): All market regimes (Bull, Bear, Neutral) are directly observable on the chart. The transition matrix is built from actual detected regimes, keeping the model simple and interpretable.
Hidden Markov Model: The actual regimes are unobservable ("hidden") and must be inferred from market output or indicator "emissions" using statistical learning algorithms. HMMs are more complex, can capture more subtle structure, but are harder to visualize and require additional machine learning steps for training.
A standard Markov Chain models transitions between observable states using a simple transition matrix, while a Hidden Markov Model assumes the true states are hidden (latent) and must be inferred from observable “emissions” like price or volume data. In practical terms, a Markov Chain is transparent and easier to implement and interpret; an HMM is more expressive but requires statistical inference to estimate hidden states from data.
Markov Chain: states are observable; you directly count or estimate transition probabilities between visible states. This makes it simpler, faster, and easier to validate and tune.
HMM: states are hidden; you only observe emissions generated by those latent states. Learning involves machine learning/statistical algorithms (commonly Baum–Welch/EM for training and Viterbi for decoding) to infer both the transition dynamics and the most likely hidden state sequence from data.
How does the indicator avoid “repainting” or look-ahead bias?
All regime changes and matrix updates happen only on confirmed (closed) bars, so no future data is leaked, ensuring reliable real-time operation.
Are there practical tuning tips?
Tune the Lookback Period for your asset/timeframe: shorter for fast markets, longer for stability.
Use custom indicators if your asset has unique regime drivers.
Watch for rapid changes in transition probabilities as early warning of a possible regime shift.
Who is this indicator for?
Quants and quantitative researchers exploring probabilistic market modeling, especially those interested in regime-switching dynamics and Markov models.
Programmers and system developers who need a probabilistic regime filter for systematic and algorithmic backtesting:
The Markov Chain indicator is ideally suited for programmatic integration via its bias output (1 = Bull, 0 = Neutral, -1 = Bear).
Although the visualization is engaging, the core output is designed for automated, rules-based workflows—not for discretionary/manual trading decisions.
Developers can connect the indicator’s output directly to their Pine Script logic (using input.source()), allowing rapid and robust backtesting of regime-based strategies.
It acts as a plug-and-play regime filter: simply plug the bias output into your entry/exit logic, and you have a scientifically robust, probabilistically-derived signal for filtering, timing, position sizing, or risk regimes.
The MC's output is intentionally "trinary" (1/0/-1), focusing on clear regime states for unambiguous decision-making in code. If you require nuanced, multi-probability or soft-label state vectors, consider expanding the indicator or stacking it with a probability-weighted logic layer in your scripting.
Because it avoids subjectivity, this approach is optimal for systematic quants, algo developers building backtested, repeatable strategies based on probabilistic regime analysis.
What's the mathematical foundation behind this?
The mathematical foundation behind this Markov Chain indicator—and probabilistic regime detection in finance—draws from two principal models: the (standard) Markov Chain and the Hidden Markov Model (HMM).
How to use this indicator programmatically?
The Markov Chain indicator automatically exports a bias value (+1 for Bullish, -1 for Bearish, 0 for Neutral) as a plot visible in the Data Window. This allows you to integrate its regime signal into your own scripts and strategies for backtesting, automation, or live trading.
Step-by-Step Integration with Pine Script (input.source)
Add the Markov Chain indicator to your chart.
This must be done first, since your custom script will "pull" the bias signal from the indicator's plot.
In your strategy, create an input using input.source()
Example:
//@version=5
strategy("MC Bias Strategy Example")
mcBias = input.source(close, "MC Bias Source")
After saving, go to your script’s settings. For the “MC Bias Source” input, select the plot/output of the Markov Chain indicator (typically its bias plot).
Use the bias in your trading logic
Example (long only on Bull, flat otherwise):
if mcBias == 1
strategy.entry("Long", strategy.long)
else
strategy.close("Long")
For more advanced workflows, combine mcBias with additional filters or trailing stops.
How does this work behind-the-scenes?
TradingView’s input.source() lets you use any plot from another indicator as a real-time, “live” data feed in your own script (source).
The selected bias signal is available to your Pine code as a variable, enabling logical decisions based on regime (trend-following, mean-reversion, etc.).
This enables powerful strategy modularity : decouple regime detection from entry/exit logic, allowing fast experimentation without rewriting core signal code.
Integrating 45+ Indicators with Your Markov Chain — How & Why
The Enhanced Custom Indicators Export script exports a massive suite of over 45 technical indicators—ranging from classic momentum (RSI, MACD, Stochastic, etc.) to trend, volume, volatility, and oscillator tools—all pre-calculated, centered/scaled, and available as plots.
// Enhanced Custom Indicators Export - 45 Technical Indicators
// Comprehensive technical analysis suite for advanced market regime detection
//@version=6
indicator('Enhanced Custom Indicators Export | Fractalyst', shorttitle='Enhanced CI Export', overlay=false, scale=scale.right, max_labels_count=500, max_lines_count=500)
// |----- Input Parameters -----| //
momentum_group = "Momentum Indicators"
trend_group = "Trend Indicators"
volume_group = "Volume Indicators"
volatility_group = "Volatility Indicators"
oscillator_group = "Oscillator Indicators"
display_group = "Display Settings"
// Common lengths
length_14 = input.int(14, "Standard Length (14)", minval=1, maxval=100, group=momentum_group)
length_20 = input.int(20, "Medium Length (20)", minval=1, maxval=200, group=trend_group)
length_50 = input.int(50, "Long Length (50)", minval=1, maxval=200, group=trend_group)
// Display options
show_table = input.bool(true, "Show Values Table", group=display_group)
table_size = input.string("Small", "Table Size", options= , group=display_group)
// |----- MOMENTUM INDICATORS (15 indicators) -----| //
// 1. RSI (Relative Strength Index)
rsi_14 = ta.rsi(close, length_14)
rsi_centered = rsi_14 - 50
// 2. Stochastic Oscillator
stoch_k = ta.stoch(close, high, low, length_14)
stoch_d = ta.sma(stoch_k, 3)
stoch_centered = stoch_k - 50
// 3. Williams %R
williams_r = ta.stoch(close, high, low, length_14) - 100
// 4. MACD (Moving Average Convergence Divergence)
= ta.macd(close, 12, 26, 9)
// 5. Momentum (Rate of Change)
momentum = ta.mom(close, length_14)
momentum_pct = (momentum / close ) * 100
// 6. Rate of Change (ROC)
roc = ta.roc(close, length_14)
// 7. Commodity Channel Index (CCI)
cci = ta.cci(close, length_20)
// 8. Money Flow Index (MFI)
mfi = ta.mfi(close, length_14)
mfi_centered = mfi - 50
// 9. Awesome Oscillator (AO)
ao = ta.sma(hl2, 5) - ta.sma(hl2, 34)
// 10. Accelerator Oscillator (AC)
ac = ao - ta.sma(ao, 5)
// 11. Chande Momentum Oscillator (CMO)
cmo = ta.cmo(close, length_14)
// 12. Detrended Price Oscillator (DPO)
dpo = close - ta.sma(close, length_20)
// 13. Price Oscillator (PPO)
ppo = ta.sma(close, 12) - ta.sma(close, 26)
ppo_pct = (ppo / ta.sma(close, 26)) * 100
// 14. TRIX
trix_ema1 = ta.ema(close, length_14)
trix_ema2 = ta.ema(trix_ema1, length_14)
trix_ema3 = ta.ema(trix_ema2, length_14)
trix = ta.roc(trix_ema3, 1) * 10000
// 15. Klinger Oscillator
klinger = ta.ema(volume * (high + low + close) / 3, 34) - ta.ema(volume * (high + low + close) / 3, 55)
// 16. Fisher Transform
fisher_hl2 = 0.5 * (hl2 - ta.lowest(hl2, 10)) / (ta.highest(hl2, 10) - ta.lowest(hl2, 10)) - 0.25
fisher = 0.5 * math.log((1 + fisher_hl2) / (1 - fisher_hl2))
// 17. Stochastic RSI
stoch_rsi = ta.stoch(rsi_14, rsi_14, rsi_14, length_14)
stoch_rsi_centered = stoch_rsi - 50
// 18. Relative Vigor Index (RVI)
rvi_num = ta.swma(close - open)
rvi_den = ta.swma(high - low)
rvi = rvi_den != 0 ? rvi_num / rvi_den : 0
// 19. Balance of Power (BOP)
bop = (close - open) / (high - low)
// |----- TREND INDICATORS (10 indicators) -----| //
// 20. Simple Moving Average Momentum
sma_20 = ta.sma(close, length_20)
sma_momentum = ((close - sma_20) / sma_20) * 100
// 21. Exponential Moving Average Momentum
ema_20 = ta.ema(close, length_20)
ema_momentum = ((close - ema_20) / ema_20) * 100
// 22. Parabolic SAR
sar = ta.sar(0.02, 0.02, 0.2)
sar_trend = close > sar ? 1 : -1
// 23. Linear Regression Slope
lr_slope = ta.linreg(close, length_20, 0) - ta.linreg(close, length_20, 1)
// 24. Moving Average Convergence (MAC)
mac = ta.sma(close, 10) - ta.sma(close, 30)
// 25. Trend Intensity Index (TII)
tii_sum = 0.0
for i = 1 to length_20
tii_sum += close > close ? 1 : 0
tii = (tii_sum / length_20) * 100
// 26. Ichimoku Cloud Components
ichimoku_tenkan = (ta.highest(high, 9) + ta.lowest(low, 9)) / 2
ichimoku_kijun = (ta.highest(high, 26) + ta.lowest(low, 26)) / 2
ichimoku_signal = ichimoku_tenkan > ichimoku_kijun ? 1 : -1
// 27. MESA Adaptive Moving Average (MAMA)
mama_alpha = 2.0 / (length_20 + 1)
mama = ta.ema(close, length_20)
mama_momentum = ((close - mama) / mama) * 100
// 28. Zero Lag Exponential Moving Average (ZLEMA)
zlema_lag = math.round((length_20 - 1) / 2)
zlema_data = close + (close - close )
zlema = ta.ema(zlema_data, length_20)
zlema_momentum = ((close - zlema) / zlema) * 100
// |----- VOLUME INDICATORS (6 indicators) -----| //
// 29. On-Balance Volume (OBV)
obv = ta.obv
// 30. Volume Rate of Change (VROC)
vroc = ta.roc(volume, length_14)
// 31. Price Volume Trend (PVT)
pvt = ta.pvt
// 32. Negative Volume Index (NVI)
nvi = 0.0
nvi := volume < volume ? nvi + ((close - close ) / close ) * nvi : nvi
// 33. Positive Volume Index (PVI)
pvi = 0.0
pvi := volume > volume ? pvi + ((close - close ) / close ) * pvi : pvi
// 34. Volume Oscillator
vol_osc = ta.sma(volume, 5) - ta.sma(volume, 10)
// 35. Ease of Movement (EOM)
eom_distance = high - low
eom_box_height = volume / 1000000
eom = eom_box_height != 0 ? eom_distance / eom_box_height : 0
eom_sma = ta.sma(eom, length_14)
// 36. Force Index
force_index = volume * (close - close )
force_index_sma = ta.sma(force_index, length_14)
// |----- VOLATILITY INDICATORS (10 indicators) -----| //
// 37. Average True Range (ATR)
atr = ta.atr(length_14)
atr_pct = (atr / close) * 100
// 38. Bollinger Bands Position
bb_basis = ta.sma(close, length_20)
bb_dev = 2.0 * ta.stdev(close, length_20)
bb_upper = bb_basis + bb_dev
bb_lower = bb_basis - bb_dev
bb_position = bb_dev != 0 ? (close - bb_basis) / bb_dev : 0
bb_width = bb_dev != 0 ? (bb_upper - bb_lower) / bb_basis * 100 : 0
// 39. Keltner Channels Position
kc_basis = ta.ema(close, length_20)
kc_range = ta.ema(ta.tr, length_20)
kc_upper = kc_basis + (2.0 * kc_range)
kc_lower = kc_basis - (2.0 * kc_range)
kc_position = kc_range != 0 ? (close - kc_basis) / kc_range : 0
// 40. Donchian Channels Position
dc_upper = ta.highest(high, length_20)
dc_lower = ta.lowest(low, length_20)
dc_basis = (dc_upper + dc_lower) / 2
dc_position = (dc_upper - dc_lower) != 0 ? (close - dc_basis) / (dc_upper - dc_lower) : 0
// 41. Standard Deviation
std_dev = ta.stdev(close, length_20)
std_dev_pct = (std_dev / close) * 100
// 42. Relative Volatility Index (RVI)
rvi_up = ta.stdev(close > close ? close : 0, length_14)
rvi_down = ta.stdev(close < close ? close : 0, length_14)
rvi_total = rvi_up + rvi_down
rvi_volatility = rvi_total != 0 ? (rvi_up / rvi_total) * 100 : 50
// 43. Historical Volatility
hv_returns = math.log(close / close )
hv = ta.stdev(hv_returns, length_20) * math.sqrt(252) * 100
// 44. Garman-Klass Volatility
gk_vol = math.log(high/low) * math.log(high/low) - (2*math.log(2)-1) * math.log(close/open) * math.log(close/open)
gk_volatility = math.sqrt(ta.sma(gk_vol, length_20)) * 100
// 45. Parkinson Volatility
park_vol = math.log(high/low) * math.log(high/low)
parkinson = math.sqrt(ta.sma(park_vol, length_20) / (4 * math.log(2))) * 100
// 46. Rogers-Satchell Volatility
rs_vol = math.log(high/close) * math.log(high/open) + math.log(low/close) * math.log(low/open)
rogers_satchell = math.sqrt(ta.sma(rs_vol, length_20)) * 100
// |----- OSCILLATOR INDICATORS (5 indicators) -----| //
// 47. Elder Ray Index
elder_bull = high - ta.ema(close, 13)
elder_bear = low - ta.ema(close, 13)
elder_power = elder_bull + elder_bear
// 48. Schaff Trend Cycle (STC)
stc_macd = ta.ema(close, 23) - ta.ema(close, 50)
stc_k = ta.stoch(stc_macd, stc_macd, stc_macd, 10)
stc_d = ta.ema(stc_k, 3)
stc = ta.stoch(stc_d, stc_d, stc_d, 10)
// 49. Coppock Curve
coppock_roc1 = ta.roc(close, 14)
coppock_roc2 = ta.roc(close, 11)
coppock = ta.wma(coppock_roc1 + coppock_roc2, 10)
// 50. Know Sure Thing (KST)
kst_roc1 = ta.roc(close, 10)
kst_roc2 = ta.roc(close, 15)
kst_roc3 = ta.roc(close, 20)
kst_roc4 = ta.roc(close, 30)
kst = ta.sma(kst_roc1, 10) + 2*ta.sma(kst_roc2, 10) + 3*ta.sma(kst_roc3, 10) + 4*ta.sma(kst_roc4, 15)
// 51. Percentage Price Oscillator (PPO)
ppo_line = ((ta.ema(close, 12) - ta.ema(close, 26)) / ta.ema(close, 26)) * 100
ppo_signal = ta.ema(ppo_line, 9)
ppo_histogram = ppo_line - ppo_signal
// |----- PLOT MAIN INDICATORS -----| //
// Plot key momentum indicators
plot(rsi_centered, title="01_RSI_Centered", color=color.purple, linewidth=1)
plot(stoch_centered, title="02_Stoch_Centered", color=color.blue, linewidth=1)
plot(williams_r, title="03_Williams_R", color=color.red, linewidth=1)
plot(macd_histogram, title="04_MACD_Histogram", color=color.orange, linewidth=1)
plot(cci, title="05_CCI", color=color.green, linewidth=1)
// Plot trend indicators
plot(sma_momentum, title="06_SMA_Momentum", color=color.navy, linewidth=1)
plot(ema_momentum, title="07_EMA_Momentum", color=color.maroon, linewidth=1)
plot(sar_trend, title="08_SAR_Trend", color=color.teal, linewidth=1)
plot(lr_slope, title="09_LR_Slope", color=color.lime, linewidth=1)
plot(mac, title="10_MAC", color=color.fuchsia, linewidth=1)
// Plot volatility indicators
plot(atr_pct, title="11_ATR_Pct", color=color.yellow, linewidth=1)
plot(bb_position, title="12_BB_Position", color=color.aqua, linewidth=1)
plot(kc_position, title="13_KC_Position", color=color.olive, linewidth=1)
plot(std_dev_pct, title="14_StdDev_Pct", color=color.silver, linewidth=1)
plot(bb_width, title="15_BB_Width", color=color.gray, linewidth=1)
// Plot volume indicators
plot(vroc, title="16_VROC", color=color.blue, linewidth=1)
plot(eom_sma, title="17_EOM", color=color.red, linewidth=1)
plot(vol_osc, title="18_Vol_Osc", color=color.green, linewidth=1)
plot(force_index_sma, title="19_Force_Index", color=color.orange, linewidth=1)
plot(obv, title="20_OBV", color=color.purple, linewidth=1)
// Plot additional oscillators
plot(ao, title="21_Awesome_Osc", color=color.navy, linewidth=1)
plot(cmo, title="22_CMO", color=color.maroon, linewidth=1)
plot(dpo, title="23_DPO", color=color.teal, linewidth=1)
plot(trix, title="24_TRIX", color=color.lime, linewidth=1)
plot(fisher, title="25_Fisher", color=color.fuchsia, linewidth=1)
// Plot more momentum indicators
plot(mfi_centered, title="26_MFI_Centered", color=color.yellow, linewidth=1)
plot(ac, title="27_AC", color=color.aqua, linewidth=1)
plot(ppo_pct, title="28_PPO_Pct", color=color.olive, linewidth=1)
plot(stoch_rsi_centered, title="29_StochRSI_Centered", color=color.silver, linewidth=1)
plot(klinger, title="30_Klinger", color=color.gray, linewidth=1)
// Plot trend continuation
plot(tii, title="31_TII", color=color.blue, linewidth=1)
plot(ichimoku_signal, title="32_Ichimoku_Signal", color=color.red, linewidth=1)
plot(mama_momentum, title="33_MAMA_Momentum", color=color.green, linewidth=1)
plot(zlema_momentum, title="34_ZLEMA_Momentum", color=color.orange, linewidth=1)
plot(bop, title="35_BOP", color=color.purple, linewidth=1)
// Plot volume continuation
plot(nvi, title="36_NVI", color=color.navy, linewidth=1)
plot(pvi, title="37_PVI", color=color.maroon, linewidth=1)
plot(momentum_pct, title="38_Momentum_Pct", color=color.teal, linewidth=1)
plot(roc, title="39_ROC", color=color.lime, linewidth=1)
plot(rvi, title="40_RVI", color=color.fuchsia, linewidth=1)
// Plot volatility continuation
plot(dc_position, title="41_DC_Position", color=color.yellow, linewidth=1)
plot(rvi_volatility, title="42_RVI_Volatility", color=color.aqua, linewidth=1)
plot(hv, title="43_Historical_Vol", color=color.olive, linewidth=1)
plot(gk_volatility, title="44_GK_Volatility", color=color.silver, linewidth=1)
plot(parkinson, title="45_Parkinson_Vol", color=color.gray, linewidth=1)
// Plot final oscillators
plot(rogers_satchell, title="46_RS_Volatility", color=color.blue, linewidth=1)
plot(elder_power, title="47_Elder_Power", color=color.red, linewidth=1)
plot(stc, title="48_STC", color=color.green, linewidth=1)
plot(coppock, title="49_Coppock", color=color.orange, linewidth=1)
plot(kst, title="50_KST", color=color.purple, linewidth=1)
// Plot final indicators
plot(ppo_histogram, title="51_PPO_Histogram", color=color.navy, linewidth=1)
plot(pvt, title="52_PVT", color=color.maroon, linewidth=1)
// |----- Reference Lines -----| //
hline(0, "Zero Line", color=color.gray, linestyle=hline.style_dashed, linewidth=1)
hline(50, "Midline", color=color.gray, linestyle=hline.style_dotted, linewidth=1)
hline(-50, "Lower Midline", color=color.gray, linestyle=hline.style_dotted, linewidth=1)
hline(25, "Upper Threshold", color=color.gray, linestyle=hline.style_dotted, linewidth=1)
hline(-25, "Lower Threshold", color=color.gray, linestyle=hline.style_dotted, linewidth=1)
// |----- Enhanced Information Table -----| //
if show_table and barstate.islast
table_position = position.top_right
table_text_size = table_size == "Tiny" ? size.tiny : table_size == "Small" ? size.small : size.normal
var table info_table = table.new(table_position, 3, 18, bgcolor=color.new(color.white, 85), border_width=1, border_color=color.gray)
// Headers
table.cell(info_table, 0, 0, 'Category', text_color=color.black, text_size=table_text_size, bgcolor=color.new(color.blue, 70))
table.cell(info_table, 1, 0, 'Indicator', text_color=color.black, text_size=table_text_size, bgcolor=color.new(color.blue, 70))
table.cell(info_table, 2, 0, 'Value', text_color=color.black, text_size=table_text_size, bgcolor=color.new(color.blue, 70))
// Key Momentum Indicators
table.cell(info_table, 0, 1, 'MOMENTUM', text_color=color.purple, text_size=table_text_size, bgcolor=color.new(color.purple, 90))
table.cell(info_table, 1, 1, 'RSI Centered', text_color=color.purple, text_size=table_text_size)
table.cell(info_table, 2, 1, str.tostring(rsi_centered, '0.00'), text_color=color.purple, text_size=table_text_size)
table.cell(info_table, 0, 2, '', text_color=color.blue, text_size=table_text_size)
table.cell(info_table, 1, 2, 'Stoch Centered', text_color=color.blue, text_size=table_text_size)
table.cell(info_table, 2, 2, str.tostring(stoch_centered, '0.00'), text_color=color.blue, text_size=table_text_size)
table.cell(info_table, 0, 3, '', text_color=color.red, text_size=table_text_size)
table.cell(info_table, 1, 3, 'Williams %R', text_color=color.red, text_size=table_text_size)
table.cell(info_table, 2, 3, str.tostring(williams_r, '0.00'), text_color=color.red, text_size=table_text_size)
table.cell(info_table, 0, 4, '', text_color=color.orange, text_size=table_text_size)
table.cell(info_table, 1, 4, 'MACD Histogram', text_color=color.orange, text_size=table_text_size)
table.cell(info_table, 2, 4, str.tostring(macd_histogram, '0.000'), text_color=color.orange, text_size=table_text_size)
table.cell(info_table, 0, 5, '', text_color=color.green, text_size=table_text_size)
table.cell(info_table, 1, 5, 'CCI', text_color=color.green, text_size=table_text_size)
table.cell(info_table, 2, 5, str.tostring(cci, '0.00'), text_color=color.green, text_size=table_text_size)
// Key Trend Indicators
table.cell(info_table, 0, 6, 'TREND', text_color=color.navy, text_size=table_text_size, bgcolor=color.new(color.navy, 90))
table.cell(info_table, 1, 6, 'SMA Momentum %', text_color=color.navy, text_size=table_text_size)
table.cell(info_table, 2, 6, str.tostring(sma_momentum, '0.00'), text_color=color.navy, text_size=table_text_size)
table.cell(info_table, 0, 7, '', text_color=color.maroon, text_size=table_text_size)
table.cell(info_table, 1, 7, 'EMA Momentum %', text_color=color.maroon, text_size=table_text_size)
table.cell(info_table, 2, 7, str.tostring(ema_momentum, '0.00'), text_color=color.maroon, text_size=table_text_size)
table.cell(info_table, 0, 8, '', text_color=color.teal, text_size=table_text_size)
table.cell(info_table, 1, 8, 'SAR Trend', text_color=color.teal, text_size=table_text_size)
table.cell(info_table, 2, 8, str.tostring(sar_trend, '0'), text_color=color.teal, text_size=table_text_size)
table.cell(info_table, 0, 9, '', text_color=color.lime, text_size=table_text_size)
table.cell(info_table, 1, 9, 'Linear Regression', text_color=color.lime, text_size=table_text_size)
table.cell(info_table, 2, 9, str.tostring(lr_slope, '0.000'), text_color=color.lime, text_size=table_text_size)
// Key Volatility Indicators
table.cell(info_table, 0, 10, 'VOLATILITY', text_color=color.yellow, text_size=table_text_size, bgcolor=color.new(color.yellow, 90))
table.cell(info_table, 1, 10, 'ATR %', text_color=color.yellow, text_size=table_text_size)
table.cell(info_table, 2, 10, str.tostring(atr_pct, '0.00'), text_color=color.yellow, text_size=table_text_size)
table.cell(info_table, 0, 11, '', text_color=color.aqua, text_size=table_text_size)
table.cell(info_table, 1, 11, 'BB Position', text_color=color.aqua, text_size=table_text_size)
table.cell(info_table, 2, 11, str.tostring(bb_position, '0.00'), text_color=color.aqua, text_size=table_text_size)
table.cell(info_table, 0, 12, '', text_color=color.olive, text_size=table_text_size)
table.cell(info_table, 1, 12, 'KC Position', text_color=color.olive, text_size=table_text_size)
table.cell(info_table, 2, 12, str.tostring(kc_position, '0.00'), text_color=color.olive, text_size=table_text_size)
// Key Volume Indicators
table.cell(info_table, 0, 13, 'VOLUME', text_color=color.blue, text_size=table_text_size, bgcolor=color.new(color.blue, 90))
table.cell(info_table, 1, 13, 'Volume ROC', text_color=color.blue, text_size=table_text_size)
table.cell(info_table, 2, 13, str.tostring(vroc, '0.00'), text_color=color.blue, text_size=table_text_size)
table.cell(info_table, 0, 14, '', text_color=color.red, text_size=table_text_size)
table.cell(info_table, 1, 14, 'EOM', text_color=color.red, text_size=table_text_size)
table.cell(info_table, 2, 14, str.tostring(eom_sma, '0.000'), text_color=color.red, text_size=table_text_size)
// Key Oscillators
table.cell(info_table, 0, 15, 'OSCILLATORS', text_color=color.purple, text_size=table_text_size, bgcolor=color.new(color.purple, 90))
table.cell(info_table, 1, 15, 'Awesome Osc', text_color=color.blue, text_size=table_text_size)
table.cell(info_table, 2, 15, str.tostring(ao, '0.000'), text_color=color.blue, text_size=table_text_size)
table.cell(info_table, 0, 16, '', text_color=color.red, text_size=table_text_size)
table.cell(info_table, 1, 16, 'Fisher Transform', text_color=color.red, text_size=table_text_size)
table.cell(info_table, 2, 16, str.tostring(fisher, '0.000'), text_color=color.red, text_size=table_text_size)
// Summary Statistics
table.cell(info_table, 0, 17, 'SUMMARY', text_color=color.black, text_size=table_text_size, bgcolor=color.new(color.gray, 70))
table.cell(info_table, 1, 17, 'Total Indicators: 52', text_color=color.black, text_size=table_text_size)
regime_color = rsi_centered > 10 ? color.green : rsi_centered < -10 ? color.red : color.gray
regime_text = rsi_centered > 10 ? "BULLISH" : rsi_centered < -10 ? "BEARISH" : "NEUTRAL"
table.cell(info_table, 2, 17, regime_text, text_color=regime_color, text_size=table_text_size)
This makes it the perfect “indicator backbone” for quantitative and systematic traders who want to prototype, combine, and test new regime detection models—especially in combination with the Markov Chain indicator.
How to use this script with the Markov Chain for research and backtesting:
Add the Enhanced Indicator Export to your chart.
Every calculated indicator is available as an individual data stream.
Connect the indicator(s) you want as custom input(s) to the Markov Chain’s “Custom Indicators” option.
In the Markov Chain indicator’s settings, turn ON the custom indicator mode.
For each of the three custom indicator inputs, select the exported plot from the Enhanced Export script—the menu lists all 45+ signals by name.
This creates a powerful, modular regime-detection engine where you can mix-and-match momentum, trend, volume, or custom combinations for advanced filtering.
Backtest regime logic directly.
Once you’ve connected your chosen indicators, the Markov Chain script performs regime detection (Bull/Neutral/Bear) based on your selected features—not just price returns.
The regime detection is robust, automatically normalized (using Z-score), and outputs bias (1, -1, 0) for plug-and-play integration.
Export the regime bias for programmatic use.
As described above, use input.source() in your Pine Script strategy or system and link the bias output.
You can now filter signals, control trade direction/size, or design pairs-trading that respect true, indicator-driven market regimes.
With this framework, you’re not limited to static or simplistic regime filters. You can rigorously define, test, and refine what “market regime” means for your strategies—using the technical features that matter most to you.
Optimize your signal generation by backtesting across a universe of meaningful indicator blends.
Enhance risk management with objective, real-time regime boundaries.
Accelerate your research: iterate quickly, swap indicator components, and see results with minimal code changes.
Automate multi-asset or pairs-trading by integrating regime context directly into strategy logic.
Add both scripts to your chart, connect your preferred features, and start investigating your best regime-based trades—entirely within the TradingView ecosystem.
References & Further Reading
Ang, A., & Bekaert, G. (2002). “Regime Switches in Interest Rates.” Journal of Business & Economic Statistics, 20(2), 163–182.
Hamilton, J. D. (1989). “A New Approach to the Economic Analysis of Nonstationary Time Series and the Business Cycle.” Econometrica, 57(2), 357–384.
Markov, A. A. (1906). "Extension of the Limit Theorems of Probability Theory to a Sum of Variables Connected in a Chain." The Notes of the Imperial Academy of Sciences of St. Petersburg.
Guidolin, M., & Timmermann, A. (2007). “Asset Allocation under Multivariate Regime Switching.” Journal of Economic Dynamics and Control, 31(11), 3503–3544.
Murphy, J. J. (1999). Technical Analysis of the Financial Markets. New York Institute of Finance.
Brock, W., Lakonishok, J., & LeBaron, B. (1992). “Simple Technical Trading Rules and the Stochastic Properties of Stock Returns.” Journal of Finance, 47(5), 1731–1764.
Zucchini, W., MacDonald, I. L., & Langrock, R. (2017). Hidden Markov Models for Time Series: An Introduction Using R (2nd ed.). Chapman and Hall/CRC.
On Quantitative Finance and Markov Models:
Lo, A. W., & Hasanhodzic, J. (2009). The Heretics of Finance: Conversations with Leading Practitioners of Technical Analysis. Bloomberg Press.
Patterson, S. (2016). The Man Who Solved the Market: How Jim Simons Launched the Quant Revolution. Penguin Press.
TradingView Pine Script Documentation: www.tradingview.com
TradingView Blog: “Use an Input From Another Indicator With Your Strategy” www.tradingview.com
GeeksforGeeks: “What is the Difference Between Markov Chains and Hidden Markov Models?” www.geeksforgeeks.org
What makes this indicator original and unique?
- On‑chart, real‑time Markov. The chain is drawn directly on your chart. You see the current regime, its tendency to stay (self‑loop), and the usual next step (arrows) as bars confirm.
- Source‑agnostic by design. The engine runs on any series you select via input.source() — price, your own oscillator, a composite score, anything you compute in the script.
- Automatic normalization + regime mapping. Different inputs live on different scales. The script standardizes your chosen source and maps it into clear regimes (e.g., Bull / Bear / Neutral) without you micromanaging thresholds each time.
- Rolling, bar‑by‑bar learning. Transition tendencies are computed from a rolling window of confirmed bars. What you see is exactly what the market did in that window.
- Fast experimentation. Switch the source, adjust the window, and the Markov view updates instantly. It’s a rapid way to test ideas and feel regime persistence/switch behavior.
Integrate your own signals (using input.source())
- In settings, choose the Source . This is powered by input.source() .
- Feed it price, an indicator you compute inside the script, or a custom composite series.
- The script will automatically normalize that series and process it through the Markov engine, mapping it to regimes and updating the on‑chart spheres/arrows in real time.
Credits:
Deep gratitude to @RicardoSantos for both the foundational Markov chain processing engine and inspiring open-source contributions, which made advanced probabilistic market modeling accessible to the TradingView community.
Special thanks to @Alien_Algorithms for the innovative and visually stunning 3D sphere logic that powers the indicator’s animated, regime-based visualization.
Disclaimer
This tool summarizes recent behavior. It is not financial advice and not a guarantee of future results.

My-Indicator - Global Liquidity & Money Supply M2 + Time OffsetThis script is designed to visualize a global liquidity and money supply index by combining data from various regions and, optionally, central bank activity. Visualizing this data on a chart allows you to see how central banks are intervening in the financial system and how the total amount of money in the economy is changing. Let’s take a look at how it works:
Central Bank Liquidity
Shows the actions of central banks (e.g. FED, ECB) providing short-term cash to commercial banks. If you see spikes or a steady increase in these indicators, it may suggest that liquidity is being increased through intervention, which often stimulates the market.
Money Supply
M2 money supply is a monetary aggregate that includes M1 (cash and current deposits) plus savings deposits, small term deposits, and other financial instruments that, while not as liquid as M1, can be quickly converted into cash. As a result, M2 provides a broader picture of the available money in the economy, which is useful for analyzing market conditions and potential economic trends.
How does it help investors?
It allows you to quickly see when central banks are injecting additional liquidity, which could signal higher prices.
It allows you to see trends in the money supply, which informs potential changes in inflation and the economic cycle.
Combining both sets of data provides a more complete picture – both in the short and long term – which makes it easier to predict upcoming price movements.
This allows investors to better respond to changes in central bank policy and broader monetary trends, increasing their chances of making better investment decisions.
Data Collection
The script retrieves money supply data for key markets such as the USA (USM2), Europe (EUM2), China (CNM2), and Japan (JPM2). It also offers additional money supply series for other markets—like Canada (CAM2), Great Britain (GBM2), Russia (RUM2), Brazil (BRM2), Mexico (MXM2), and New Zealand (NZM2)—with extra options (e.g., Australia, India, Korea, Indonesia, Malaysia, Sweden) disabled by default. Moreover, you can enable data for central bank liquidity (such as FED, RRP, TGA, ECB, PBC, BOJ, and other central banks), which are also disabled by default.
Index Calculation
The indicator calculates the index by adding together all the enabled money supply series (and the central bank data if activated) and then scales the sum by dividing it by 1,000,000,000,000 (one trillion). This scaling makes the resulting values more manageable and easier to read on the chart.
Time Offset Feature
A key feature of the script is the time offset. With the input parameter "Time Offset (days)", the user can shift the plotted index line by a specific number of days. The script converts the given offset in days into a number of bars based on the current chart's timeframe. This allows you to adjust for the delay between liquidity changes and their effect on asset prices.
Overall, the indicator plots a line on your chart representing the global liquidity and money supply index, allowing you to visually monitor trends and better understand how liquidity and central bank actions may influence market movements.
What makes this script different from others?
Every supported market—both major regions (USA, Eurozone, China, Japan, etc.) and additional ones—is available. You can toggle each series on or off, so you can view only Money Supply data, only Central Bank Liquidity, or any custom combination.
Separated Data Groups. Inputs are organized into clear groups (“Money Supply”, “Other Money Supply”, “Central Bank Liquidity”), making it easy to focus on just the data you need without clutter.
True Day‑Based Offset. This script converts your chosen “Time Offset (days)” into actual days regardless of timeframe. Whether you’re on a 5‑minute or daily chart, the index is always shifted by exactly the number of days you specify.

[iQ]PRO Ultimate Financial Analysis Tool And System SynergyUltimate Financial Analysis Tool And System Synergy (UFATASS)
Advanced Market Insights with Cycle Analysis, Trend Forecasting, and Risk Monitoring
The Ultimate Financial Analysis Tool And System Synergy (UFATASS) is a powerful indicator designed to give traders a deeper understanding of market dynamics. By blending cutting-edge techniques from signal processing, statistics, and dynamical systems theory, UFATASS provides a unique, all-in-one solution for technical analysis.
Key Features
Cycle Detection:
Pinpoints dominant market cycles using advanced spectral analysis, helping you identify potential turning points.
Trend Analysis:
Delivers multiple regression lines to capture short-term and long-term market trends, with a customizable complexity setting for precision.
Probability Forecasts:
Uses Monte Carlo simulations to estimate the likelihood of future price movements, offering a probabilistic edge for decision-making.
Risk Monitoring:
Tracks volatility and market stability, featuring an experimental chaos indicator based on Lyapunov exponents to assess price predictability.
Customization Options
Adjust the indicator to fit your trading style:
Cycle and regression lookback periods
Complexity factor for regression sensitivity
Volatility calculation window
Forecast horizon for price predictions
Visual Outputs
Price and regression lines plotted on the main chart
Cycle details and wave visuals in a separate pane
A summary label on the last bar with key metrics (e.g., cycle length, probabilities)
Background color alerts to signal risk levels
How to Use
Incorporate UFATASS into your strategy to:
Anticipate reversals with cycle analysis
Confirm trends using regression insights
Plan entries and exits with probability forecasts
Monitor market conditions and adjust risk exposure

TradingWolf Premium OscillatorsThe TradingWolf Premium Oscillators is a unique and enhanced selection of oscillators designed to help give you an edge on the markets.
Within this one indicator you will have access to RSI, Stochastic, MACD, Awesome Oscillator, Wavetrend, Zig Zag Pivots and DPO.
Including Divergence and Hidden Divergence signals for them.
Below each indicator is explained along with its enhancements to help you understand it better.
This script comes with the 'TradingWolf Premium' to get access, read the Author’s Instructions below.
There are extensive explanations on how to use these oscillators in our documentation on the website but we will give a simple overview here.
RSI
We try not to mess with these too much because if used correctly, they are very powerful tools. The main differences you will notice is that we have highlighted the areas where you should be paying attention to the oscillator with reversal/continuation zones.
The most popular feature from these will be the 4 divergences which can be toggled on or off in the settings.
Stochastic
Stochastic we have tried to keep as similar to the original as possible, main features are being able to select alternate timeframes for it to be calculated on as well as displaying divergences.
We have created a highlighted zone for when price enters the overbought/sold territory. A lot of traders will look for crossovers happening in these areas however from our tests we have discovered entering trades as the Stochastic comes out of these areas has hugely reduced losing trades, still not a perfect strategy but it does often show that the trend is showing weakening momentum and its commonly followed by a period of sideways action before continuing in a new direction.
MACD
We have calculated a dynamic extreme range for the MACD, you will notice the green/red bars as the bottom and top of the Oscillator. These levels help adjust with the assets volatility so they will work universally on all assets and timeframes. When these levels get more narrow, this indicates there is a potential larger move to come, similar thought process to a Bollinger band squeeze.
We like the Divergence signals you receive whilst in this OB/OS range as they give more confluence behind the divergence signal that price has over extended and is looking to retrace or consolidate.
Awesome Oscillator
The Awesome Oscillator is based on some pretty simple calculations but is hugely powerful.
The 3 main use cases are crossing the 0 value, showing weakening momentum and divergence signals.
We Particularly like the Divergence signals it gives us as they tend to be more accurate than any other oscillator.
Wavetrend
Wavetrend we try describe as a more dynamic Stochastic/MACD, it moves smoother and quicker without giving too many false signals.
Conditions we use the Wavetrend for are similar to the MACD where we are looking for crossovers or divergences in the extreme bands, these shouldn’t be used to trade alone and should be paired with other pieces of confluence for a higher probability trade however this is one of our favourites.
We also have a VWAP extreme detector which we pair with the Wavetrend, helping us identify areas where price should start cooling off.
Zig Zag
The main purpose of the standard Zig Zag is to analyse historical data to be able to observe cycle's in a market's movement, this requires a bit more explanation than we can include here so please refer to our documentation on the website for further guidance.
DPO
The detrended price oscillator is unlike other oscillators, such as the Stochastic or MACD the DPO is not a momentum indicator. It instead highlights peaks and troughs in price, which are used to estimate buy and sell points in line with the historical cycle.
We personally think this is the most under-rated oscillator out there, if you simply followed the DPO above 0 for long and below for short on higher timeframes you can outperform the buy and hold return of Bitcoin (BTCUSDT)...
This is just one simple way of using the DPO there are other more in depth methods of using it within our documentation.

Bitcoin: Top & Bottom Mini-AlgoHere we have a mini-algorithm that tries to show absolute 4-year-cycle top and bottom zones for the case of the BraveNewCoin Liquid Index (BLX) for Bitcoin on the weekly (W) timeframe by using several oscillators as RSI, VPCI etc. employed with a custom logic. When the background gets red we might be near to a cycle peak, and when it gets green we might be near to the absolute bottom of the current cycle. Note that only absolute top/bottoms are indicated (at least since the end of 2013), so that the current strong drop in March 2020 was correctly not tagged, as it wasn't the lowest price of the current cycle.
It is best to combine this mini-algorithm with some of my boundary indicators for BLX, e.g. "Bitcoin: Price Action Integrals", for confluence . For the next peak one could then watch for the mini-algo to go red and for the price to hit the boundary. You can change the background transparency if you like to have this indicator be more unobstrusive on the chart.
For access please contact me via DM on TradingView or on Twitter (linked on my TradingView profile and my signature).

oscillator fast cryptosmart (Bands on Scale)The oscillator fast cryptosmart is a high-sensitivity momentum indicator designed to generate signals more rapidly than many traditional oscillators, such as the MACD. It is engineered to detect potential price breakouts by analyzing short-term market cycles.
At its core, the indicator uses a Detrended Price Oscillator (DPO) to remove the longer-term trend from price action, allowing it to focus purely on the underlying momentum cycles. It then calculates dynamic volatility bands around this oscillator line.
Signals are generated when momentum breaks out from a normal range, providing traders with an early warning of a potential acceleration in price.
How to Interpret the Signals:
Buy Signal (Green Vertical Line): A buy signal is generated when the oscillator's main line (yellow) crosses above its upper statistical band. This indicates a sharp surge in positive momentum, suggesting a potential upward move is beginning.
Sell Signal (Red Vertical Line): A sell signal is generated when the oscillator's main line crosses below its lower statistical band. This indicates a significant increase in negative momentum, suggesting a potential downward move is starting.
By focusing on momentum breakouts rather than lagging moving average crossovers, the oscillator fast cryptosmart aims to provide an edge in identifying opportunities in fast-moving markets.

Stacey Burke Signal Day LTE“Previously published as ‘Day Zero Fakeout Detector MTF’”
Stacey Burke Signal Day LTE
Automatic detection of Day Zero, Inside Days, and Outside Days for Stacey Burke’s intraday playbook
🔎 Stacey Burke’s Signal Days
This indicator highlights the key daily patterns that often lead to high-probability intraday setups in Stacey Burke’s methodology:
1️⃣ Day Zero
The reset days within a 3-day cycle (e.g. breakout → continuation → exhaustion/reversal).
Can mark the beginning of a new directional phase.
Trades back inside the prior range after a Peak Formation High (PFH) or Peak Formation Low (PFL).
Bias: Look for measured parabolic session moves. When combined with trend following indicators, these signal days can be very powerful.
2️⃣ Inside Day
A day where the entire range is contained within the prior day’s range.
Signals consolidation and energy build-up.
Often leads to explosive breakouts in the next session.
Bias: Trade breakouts of the inside day’s high/low or breakout reversal in the session at key timings in the direction of higher timeframe bias. When combined with trend following indicators, these signal days can be very powerful.
3️⃣ Outside Day (Engulfing Day)
`
A day where the range is larger than the prior day’s range, engulfing both high and low.
Marks trapped traders and fakeouts on both sides.
Often precedes strong continuations or sharp reversals from outside of the ranges.
Bias: Align trades with the true continuation move. When combined with trend following indicators, these signal days can be very powerful.
📌 How They Work Together
Day Zero → Signals the new cycle after PFH/PFL.
Inside Day → Signals compression → expect breakout setups.
Outside Day → Signals exhaustion/fakeouts → expect reversals or continuations.
Together, they give traders a clear daily roadmap for where liquidity sits and when to expect the highest-probability setups.
✅ Example in Practice
Market rallies for 3 days → PFH forms → Day Zero short bias.
Next day prints an Inside Day → watch for breakout continuation short, and breakout reversals.
Later, an Outside Day traps both longs and shorts → the following session offers a clean intraday reversal or continuation trade in line with the underlying MTF trend/bias.
⚙️ Features of This Indicator
Automatic detection of Day Zero, Inside Days, and Outside Days
Multi-Timeframe (MTF) support for cycle alignment
Visual markers for PFH/PFL and consolidation zones
Measured move projections for breakout targets
👉 Stacey Burke Signal Day LTE gives traders just a few of the most important signal days — Day Zero, Inside Day, and Outside Day — to structure their intraday trades around fake outs, breakouts, and reversals within the daily cycles of the week. (This is work in progress: Next up, FRD/FGD's, 3-day cycle detecting, 3DLs, 3DSs).
