Pair Correlation Master [Macro]The Main Idea
Trading represents a constant battle between Systemic Flows (the whole market moving together) and Idiosyncratic Moves (one specific asset moving on its own).
This tool allows you to monitor a "basket" of 4 assets simultaneously (e.g., the major USD pairs). It answers the most important question in forex and multi-asset trading: "Is this move happening because the Dollar is weak, or because the Euro is strong?"
It separates the "Signal" (the unique move) from the "Noise" (the herd movement).
1. The Chart Lines: The "Race" (Macro Trend)
Think of the lines on your chart as a long-distance race. They visualize the performance of all 4 assets over the last 200 candles (adjustable).
- Bunched Together: If all lines are moving in the same direction, the market is highly correlated. (e.g., "The Dollar is selling off everywhere").
- Fanning Out: If the lines are spreading apart, specific currencies are outperforming others.
- The Zero Line: This is the starting line.
--- Above 0: The pair is in a macro uptrend.
--- Below 0: The pair is in a macro downtrend.
2. The Dashboard: The "Health Check" (Micro Data)
The table in the top right gives you the immediate statistics for right now.
- A. The Z-Score (The Rubber Band)
This measures how "stretched" price is compared to its normal behavior.
- White (< 2.0): Normal trading activity.
- Orange (> 2.0): The price is stretching. Warning sign.
- Red (> 3.0): Critical Stretch. The rubber band is pulled to its limit. Statistically, a pullback or pause is highly likely.
B. The Star (★)
The script automatically calculates the average behavior of your group. If one asset is behaving completely differently from the rest, it marks it with a Star (★).
- Example: EURUSD, GBPUSD, and NZDUSD are flat, but AUDUSD is rallying hard. AUDUSD gets the ★. This is where the unique opportunity lies.
🎯 Best Uses: 4H & Daily Timeframes
This indicator is tuned for "Macro" analysis. It works best on the "4-Hour" and "Daily" charts to filter out intraday noise and capture swing trading moves.
- Strategy 1: The "Rubber Band" Snap (Mean Reversion)
- Setup: Look for a Z-Score in the RED (> 3.0) on the Daily timeframe.
- Action: This indicates an unsustainable move. Look for reversals or exhaustion patterns to trade against the trend back toward the mean.
- Strategy 2: The "Lone Wolf" (Trend Following)
- Setup: Look for the asset with the Star (★).
- Action: If the whole basket is flat (Balanced), but the Star asset is breaking out, that creates a high-quality trend trade because that specific currency has its own catalyst (News/Earnings).
- Strategy 3: Systemic Flows (Basket Trading)
- Setup: The dashboard footer says "⚠️ SYSTEMIC MOVE."
- Action: This means everything is moving together (e.g., a massive USD crash). Don't look for unique setups; just join the trend on the strongest pair.
Dashboard Footer Key
The bottom of the table summarizes the current state of the market for you:
- Balanced / Rangebound: The market is quiet. Good for range trading.
- Focus: : Trade this specific pair. It is moving independently.
- Systemic Move: The whole basket is moving violently. Trade the momentum.
p.s. Suggestion - apply and use on the chart rather than an oscillator.
Göstergeler ve stratejiler

RSI Profile [Kodexius]RSI Profile is an advanced technical indicator that turns the classic RSI into a distribution profile instead of a single oscillating line. Rather than only showing where the RSI is at the current bar, it displays where the RSI has spent most of its time or most of its volume over a user defined lookback period.
The script builds a histogram of RSI values between 0 and 100, splits that range into configurable bins, and then projects the result to the right side of the chart. This gives you a clear visual representation of the RSI structure, including the Point of Control (POC), the Value Area High (VAH), and the Value Area Low (VAL). The POC marks the RSI level with the highest activity, while VAH and VAL bracket the percentage based value area around it.
By combining standard RSI, a distribution profile, and value area logic, this tool lets you study RSI behavior statistically instead of only bar by bar. You can immediately see whether the current RSI reading is located inside the dominant zone, extended above it, or depressed below it, and whether the recent regime has been biased toward overbought, oversold, or neutral territory. This is particularly useful for swing traders, mean reversion systems, and anyone who wants to integrate RSI context into a more profile oriented workflow.
🔹 Features
1. RSI-Based Distribution Profile
-Builds a histogram of RSI values between 0 and 100.
-The RSI range is divided into a user-defined number of bins (e.g., 30 bins).
-Each bin represents a band of RSI values, such as 0–3.33, 3.33–6.66, ..., 96.66–100.
-For each bar in the lookback period, the script:
-Finds which bin the RSI value belongs to
Adds either:
-1.0 → if using time/frequency
-volume → if using volume-weighted RSI distribution
This creates a clear profile of where RSI has been concentrated over the chosen lookback window.
2. Time / Volume Weighting Mode
Under Profile Settings, you can choose:
-Weight by Volume = false
→ Profile is built using time spent at each RSI level (frequency).
-Weight by Volume = true
→ Profile is built using volume traded at each RSI level.
This flexibility allows you to decide whether you want:
-A pure momentum structure (time spent at each RSI)
-Or a participation-weighted structure (where higher-volume zones are emphasized)
3. Configurable Lookback & Resolution
-Profile Lookback: number of historical bars to analyze.
-Number of Bins: controls the resolution of the histogram:
Fewer bins → smoother, fewer gaps
More bins → more detail, but potentially more visual sparsity
-Profile Width (Bars): defines how wide the histogram extends into the future (visually), converted into time using average bar duration.
This provides a balance between performance, clarity, and visual density.
4. Value Area, POC, VAH, VAL
The script computes:
-POC (Point of Control)
→ The RSI bin with the highest total value (time or volume).
-Value Area (VA)
→ The range of RSI bins that contain a user-specified percentage of total activity (e.g., 70%).
-VAH & VAL
→ Upper and lower RSI boundaries of this Value Area.
These are then drawn as horizontal lines and labeled:
-POC line and label
-VAH line and label
-VAL line and label
This gives you a profile-style view similar to classical volume profile, but entirely on the RSI axis.
5. Color Coding & Visual Design
The histogram bars (boxes) are colored using a smart scheme:
-Below 30 RSI → Oversold zone, uses the Oversold Color (default: green).
-Above 70 RSI → Overbought zone, uses the Overbought Color (default: red).
-Between 30 and 70 RSI → Neutral zone, uses a gradient between:
A soft blue at lower mid levels
A soft orange at higher mid levels
Additional styling:
-POC bin is highlighted in bright yellow.
-Bins inside the Value Area → lower transparency (more solid).
-Bins outside the Value Area → higher transparency (faded).
This makes it easy to visually distinguish:
-Core RSI activity (VA)
-Extremes (oversold/overbought)
-The single dominant zone (POC)
🔹 Calculations
This section summarizes the core logic behind the script and highlights the main building blocks that power the profile.
1. Profile Structure and Bin Initialization
A custom Profile type groups together configuration, bins and drawing objects. During initialization, the script splits the 0 to 100 RSI range into evenly spaced bins, each represented by a Bin record:
method initBins(Profile p) =>
p.bins := array.new()
float step = 100.0 / p.binCount
for i = 0 to p.binCount - 1
float low = i * step
float high = (i + 1) * step
p.bins.push(Bin.new(low, high, 0.0, box(na)))
2. Filling the Profile Over the Lookback Window
On the last bar, the script clears previous drawings and walks backward through the selected lookback window. For each historical bar, it reads the RSI and volume series and feeds them into the profile:
if barstate.islast
myProfile.reset()
int start = math.max(0, bar_index - lookback)
int end = bar_index
for i = 0 to (end - start)
float r = rsi
float v = volume
if not na(r)
myProfile.add(r, v)
The add method converts each RSI value into a bin index and accumulates either a frequency count or the bar volume, depending on the chosen mode:
method add(Profile p, float rsiValue, float volumeValue) =>
int idx = int(rsiValue / (100.0 / p.binCount))
if idx >= p.binCount
idx := p.binCount - 1
if idx < 0
idx := 0
Bin targetBin = p.bins.get(idx)
float addedValue = p.useVolume ? volumeValue : 1.0
targetBin.value += addedValue
3. Finding POC and Building the Value Area
Inside the draw method, the script first scans all bins to determine the maximum value and the total sum. The bin with the highest value becomes the POC. The value area is then constructed by expanding from that center bin until the desired percentage of total activity is covered:
for in p.bins
totalVal += b.value
if b.value > maxVal
maxVal := b.value
pocIdx := i
float vaTarget = totalVal * (p.vaPercent / 100.0)
float currentVaVol = maxVal
int upIdx = pocIdx
int downIdx = pocIdx
while currentVaVol < vaTarget
float upVol = (upIdx < p.binCount - 1) ? p.bins.get(upIdx + 1).value : 0.0
float downVol = (downIdx > 0) ? p.bins.get(downIdx - 1).value : 0.0
if upVol == 0 and downVol == 0
break
if upVol >= downVol
upIdx += 1
currentVaVol += upVol
else
downIdx -= 1
currentVaVol += downVol

Relative Strength Index w/ BandsStandard RSI but with the option to add a shaded zone around the Upper and Lower Bands, based on an offset value.
Value/level of shaded zones need to be modified separately in the Settings from the Upper and Lower Band values.

MTF Trend Dashboard (PSAR, SuperTrend, 200EMA, 9/30 EMA)This script is a multi–timeframe trend dashboard designed to quickly show the market bias across several timeframes in one place.
It does not generate buy/sell signals – it is a visual decision tool to support your own strategy.
What it shows
For up to 5 selectable timeframes, the table displays:
Parabolic SAR – whether PSAR is below (bullish) or above (bearish) the candle.
Supertrend – whether the Supertrend line is below or above the price.
200 EMA status – whether price is trading above (bullish trend) or below (bearish trend) the 200 EMA.
9 / 30 EMA crossover – whether 9 EMA is above (bullish) or below (bearish) the 30 EMA.
Green cells represent bullish conditions, red cells represent bearish conditions.
How to use
Quickly check higher–timeframe trend alignment before entering trades.
Use it as a trend filter for scalping or intraday entries on lower timeframes.
Combine with your own price action / SMC / support–resistance rules for actual entries and exits.

All of MAsCustom indicator with my favorite multiple MAs.
Can switch to different timeframe source.
Default SMAs:
9
20
50
50 @ 2min
200
200 @ 2min
400 @ 2min
800

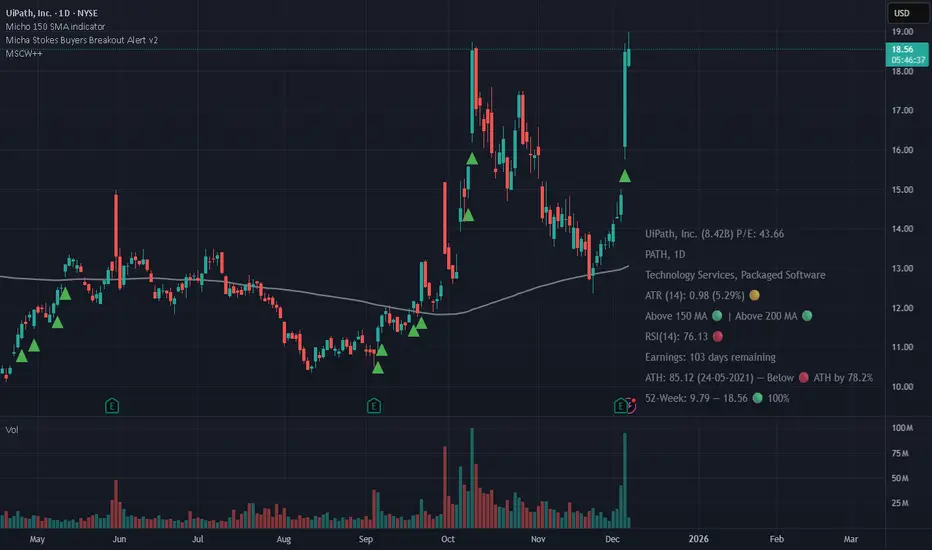
VCP Trendline breakoutThe Signal:
Green Triangles indicate the price is approaching the trendline (Watchlist candidate).
Yellow Triangles indicate the price is very tight against the line (Execution imminent).
The Trigger: When price closes above the Grey Dotted Line, the line stops extending. This is your breakout signal.
Indicator Overview
The The VCP Trendline breakout indicator is a sophisticated technical indicator designed for trend followers and breakout traders (O'Neil, Minervini, Wyckoff styles). This script employs a State Machine logic to identify structural Volatility Contraction Patterns (VCP) in real-time.
It automatically detects valid Bases, tracks the "Right Side" construction, identifies nested handles (contractions), and draws precise supply trendlines—while strictly enforcing structural integrity rules (Higher Lows).
Core Logic & Features
1. Smart Base Detection
Trend Filter: The pattern recognition engine only activates when the price is above the 200 SMA, ensuring you are trading with the primary trend.
Base Validation: It identifies a "Base High" (H1) based on a configurable lookback period. It tracks the depth of the base and automatically invalidates the pattern if the drawdown exceeds the user-defined threshold (default 30%).
2. Recursive Nested Trendlines (VCP)
The indicator is capable of drawing Nested Trendlines (recursive resistance). It doesn't just draw a line from the peak; it identifies internal contractions within the base.
H1 (Primary): The main supply line from the top of the base.
H2, H3 (Internal): Trendlines connecting subsequent lower highs (handles) as volatility contracts.
Smart Fan: Includes a "Clean Fan" mode to show only the most relevant, latest trendline per anchor point.
3. Structural Integrity Enforcement (The "Higher Low" Rule)
This is the standout feature of this script. It performs an Anchor Integrity Check on every bar.
In a valid VCP, every contraction must form a Higher Low.
If the price creates a new pivot (H3) but then crashes lower than the previous contraction's floor (H2), the script identifies this as a Structural Failure.
Auto-Deletion: It immediately retroactively deletes the invalid trendlines associated with that failed contraction, keeping your chart clean and free of "ghost" signals.
4. "Right-Side" Logic
Collision Detection: Trendlines are calculated using "Right-Side Clearance." A line is only drawn if the path from the anchor to the new pivot is unobstructed by price action.
Signal Protection: "Watch" and "Near" signals are suppressed during the decline phase (Left Side). They only appear once the "Bottom" (L1) has been confirmed and price is recovering on the Right Side.
5. Proximity Alerts & Breakouts
Watch Zone (Green Triangle): Appears when the Low of the bar is within 8% (configurable) of a valid trendline.
Near Zone (Yellow Triangle): Appears when the Low of the bar is within 4% (configurable) of a valid trendline.
Breakout Stop: Trendlines are dynamic. The moment a bar closes above a trendline, the line stops extending immediately, marking the exact breakout point.
How to Use This Indicator
The Setup: Look for a stock in an uptrend (Price > 200 SMA).
The Construction: Wait for the script to identify the Base High (H1). As the price corrects and begins to recover, you will see Grey Dotted Lines appear, connecting the highs.
The Contraction: Watch for Nested Trendlines. If you see a second or third line form from a lower high (H2, H3), it indicates a tightening of price action (VCP).
Settings Configuration
Moving Averages
21 EMA, 50 SMA, 200 SMA: Built-in reference averages.
Base Settings
H1 Lookback: How many bars back the script looks to find the "Start" of the base (Default: 21). Increase this for longer-term bases.
Sub-High Pivot Bars: Controls the sensitivity of identifying internal highs (handles).
Max Base Depth: If the base drops more than this % (Default: 30%), the structure is considered failed and lines are removed.
Enable Nested Trendlines: Toggle ON to see internal VCP lines (H2, H3). Toggle OFF to see only the main H1 trendline.
Show Only Latest Line: Keeps the chart clean by removing older lines from the same anchor point.
Visuals & Signals
Near/Watch Zone %: Adjust the sensitivity of the Green/Yellow triangles.
Signal Size: Change the size of the triangle markers.
DISCLAIMER
This is an indicator, not a trading system. Apply good risk management and do your own due diligence before putting your hard earned money into anything.
This script is for educational and analytical purposes only. It does not constitute financial advice. Automated pattern recognition has limitations and should always be verified visually.

Confluence Retournement Haussier - Ultimate V1This indicator was originally designed to visualize the right moment to enter a position. I buy stocks when they are falling, at the bottom before they rebound.
The 30‑minute chart with its 100 EMA was used as the baseline, but it can be applied to multiple timeframes. I even used it on a 1‑second chart for a ticker, and when there is volume it works wonderfully.
It’s up to you to check whether it fits the ticker you’re analyzing by testing it on historical data.
Drawback: it takes up screen space. Feel free to improve it.
See a ticker in freefall and wonder whether it’s a good time to buy or if it will keep falling? Switch your chart to 30 minutes and watch for triangles and green circles to start appearing.
You could call it momentum. Your background begins to show color when there is confluence. If it stays black, don’t buy.
Already in the trade and the screen turns black? Sell, and wait for the colors to return before buying back in

3-bar Swing Liquidity Grab📊 3-BAR SWING LIQUIDITY GRAB
WHAT IT DOES
Automatically detects 3-bar swing highs/lows and alerts you to liquidity grab moments — when price breaks structural levels to trigger stop-losses, then reverses.
SIGNALS AT A GLANCE
Signal What It Means Trade Idea
SH 🟠▼ Swing High (Resistance) Reference level
SL 🔵▲ Swing Low (Support) Reference level
LQH 🔴❌ Fake break ABOVE resistance SHORT ⬇️
LQL 🟢❌ Fake break BELOW support LONG ⬆️
HOW TO TRADE IT
Spot the trend — Is price going up or down?
Wait for signal — LQL (green) in uptrend, LQH (red) in downtrend
Enter on signal — Place order on that bar
Stop Loss — Just outside the swing level
Take Profit — At the next swing level
SETTINGS EXPLAINED
Swing length: 1 = 3-bar swing, 2 = 5-bar swing (use 1 for scalp, 2 for larger TF)
Lookback bars: Time window to find liquidity grabs (10-20 for scalp, 50+ for position)
Toggles: Show/hide swing markers and signals
BEST ON THESE TIMEFRAMES
TF Type Settings
M5-M15 Scalp SL: 1, LB: 10-15
M15-H1 Intraday SL: 1, LB: 15-20
H1-H4 Swing SL: 1-2, LB: 20-50
D+ Position SL: 2, LB: 50+
KEY RULES
✅ DO:
Trade signals aligned with major trend
Always use stop loss
Use 2-5% risk per trade
Confirm with price action
❌ DON'T:
Trade choppy/sideways markets
Ignore the trend
Chase signals
Overtrade
REAL EXAMPLE
LONG Trade (LQL Signal):
text
Uptrend → Swing Low forms at 1.0950
→ Price dips to 1.0930 (below SL)
→ Closes at 1.0955 (above SL) = GREEN ❌ (LQL)
→ BUY at 1.0960
→ Stop Loss: 1.0920
→ Take Profit: 1.1050 (previous Swing High)
WORKS ON
✅ Crypto (Bitcoin, Ethereum, Altcoins)
✅ Forex (EUR/USD, GBP/USD, etc.)
✅ Stocks & Indices
✅ Commodities (Gold, Oil, etc.)
Any asset, any timeframe, any market.
DISCLAIMER
This is a technical analysis tool, not financial advice. Past performance does not guarantee future results. Always use proper risk management and test on a demo account first.

FCPO MASTER v6 – Sideway + Breakout + OB + FVG (TUPLE SAFE)TL;DR cepat
1. Gunakan M5 untuk entry & OB/FVG confirmation.
2. Gunakan M15 untuk confirm trend/false breakout.
3. Gunakan H1 untuk bias arah (overall market).
4. Entry hanya bila signal + OB/FVG/candle rejection (script buatkan).
5. SL 5–8 tick, TP 10–25 tick ikut setup (sideway vs breakout).
6. Follow checklist setiap trade — jangan lompat.
________________________________________
Setup awal (1–2 min)
1. Pasang script FCPO Sideway MASTER – OB + Imbalance + Confirmation di TradingView.
2. Timeframes: buka M5, M15, H1 (susun 3 chart atau 1 chart multi-timeframe).
3. Input default: ATR14, Breakout Buffer 5 tick, RangeLen 20, ADX14, TP12, SL8. (Kau boleh tweak nanti).
4. Aktifkan alerts pada BUY Confirm / SELL Confirm / Sideway Buy / Sideway Sell.
________________________________________
Step-by-step trading process
1) Mulakan dengan H1 — tentukan bias HTF
• Lihat H1 untuk jawapan: Trend Up / Down / Sideway.
• Rule ringkas:
o ADX H1 > 20 + price above H1 EMA → bias Bull
o ADX H1 > 20 + price below H1 EMA → bias Bear
o ADX H1 < 20 → market HTF sideway (no strong bias)
Kenapa: H1 bagi kau idea “kalau breakout pada M5, patut follow atau tolak”.
________________________________________
2) Pergi ke M15 — confirm trend & valid breakout
• M15 kena setuju dengan idea breakout.
o Untuk strong breakout: M15 kena tunjuk candle close di atas/bawah range + volume naik.
o Kalau M5 breakout tapi M15 tak setuju (M15 masih sideway) → treat as fakeout. Jangan masuk.
________________________________________
3) M5 — cari entry & confirmation (OB/FVG + candle)
• M5 adalah tempat kau buat keputusan masuk.
• Tunggu script keluarkan Sideway Buy/Sell atau Breakout Buy/Sell.
• CONFIRM entry mesti ada sekurang-kurangnya 1 dari:
o Bull/Bear Order Block searah signal (script detect).
o FVG / Imbalance zone dipenuhi & price retest.
o Candle rejection (pinbar / bearish/bullish engulfing) pada zone.
Jika tiada confirmation → no trade.
________________________________________
4) Checklist sebelum tekan Buy/Sell (MUST)
• H1 bias tidak melawan trade (prefer sama arah).
• M15 confirm breakout / trend or neutral.
• Script keluarkan signal (sideway or breakout).
• OB or FVG atau candle rejection ada.
• ATR kenaikan jika breakout (untuk breakout trade).
• Volume spike jika breakout.
• Risk:SL <= 2% akaun (position sizing).
Kalau semua ticked → boleh entry.
________________________________________
5) Setting SL / TP & position sizing
• Sideway (scalp): SL = 5–8 tick, TP = 8–12 tick.
• Breakout (trend): SL = 8–12 tick, TP = 15–25+ tick (trail later).
• Position sizing: Risk per trade 1–2%.
o Lot size = (Account Risk RM × 1 tick value) / (SL ticks × tickValue) — (kalau kau gunakan fixed tick value, adjust ikut lot).
(Script tunjuk SL & TP label — follow itu.)
________________________________________
6) Entry types
• A. Sideway Reversal (M5)
o Signal: Sideway Buy / Sideway Sell
o Confirm: OB/FVG or rejection candle at range bottom/top
o Trade: scalp target 8–12 tick, tight SL 5–8 tick
• B. Breakout (M5 entry, M15 confirm)
o Signal: Breakout Buy/Sell (Strong)
o Confirm: ATR expanding + volume spike + M15 alignment
o Trade: trend follow, TP 15–25 tick, trailing stop active
• C. Retest Entry
o Breakout happens, price returns to retest range / OB / FVG → wait for rejection candle then enter. Safer.
________________________________________
7) Trailing & exit rules
• Jika useTrail = true script plots trailing stop (ATR × multiplier).
• Exit rules:
1. Hit TP → close.
2. Hit SL → close.
3. If trailing stop hit → close.
4. If opposing confirmed signal muncul (e.g., SELL confirm while long) → consider close early.
5. If H1 bias flips strongly vs trade → tighten stop or close.
________________________________________
8) Multiple signals & scaling
• Never add to losing position (no averaging down).
• If want scale-in on confirmed trend: add 1 partial size after price moves +10–12 tick in favor and shows continuation candle + no bearish OB/FVG.
• Keep aggregated risk within your max (2–3%).
________________________________________
9) Example trade walkthrough (concrete)
• RangeHigh = 4065, RangeLow = 4035 (contoh).
• Market sideway M5.
Case A — Sideway Sell:
1. Price touches 4064–4065, script shows sidewaySell.
2. Lihat OB: ada bear OB zone di 4062–4066 → confirm.
3. Candle rejection (bearish pinbar) muncul → enter SELL M5.
4. Set SL = 5 tick above rangeHigh = 4070, TP = 10 tick → 4055.
5. Trail jika price turun > 8 tick: aktifkan trailing.
6. Close at TP or trail/SL.
Case B — Breakout Buy:
1. Price closes above 4065 + 5 tick buffer = 4070 on M5. Script shows trueBreakUp.
2. M15 shows candle close above M15 resistance + volume spike → confirm.
3. Enter BUY, SL = 8 tick below entry, TP initial 20 tick, trail with ATR×1.5.
4. Move stop to breakeven after +10 tick, scale out half at +12 tick, leave rest to trail.
________________________________________
10) Journal & review
• Semua trade: record entry time, TF, reason (which confirmations), SL/TP, result, lesson.
• Weekly review: check which confirmation worked best (OB vs FVG vs candle) and tweak settings.
________________________________________
11) Tweaks / optimisations cepat
• Jika terlalu banyak false sideway signals → kurangkan touchDist ke 2 tick.
• Kalau fakeout breakout banyak → tambah tickBuf ke 6–8.
• Nak lebih konservatif → cuma trade breakout yang juga setuju M15.
________________________________________
12) Alerts & execution (practical)
• Pasang alert pada BUY Confirm / SELL Confirm (script).
• Kalau kau guna broker yang support one-click order, siap sediakan template order (SL/TP default).
• Kalau manual, bila alert masuk: buka M5, cepat confirm OB/FVG & candle rejection → entry.
________________________________________
Quick reference table (handy)
• TF utama entry: M5
• Confirm mid-TF: M15
• Bias HTF: H1
• Sideway SL/TP: SL 5–8, TP 8–12
• Breakout SL/TP: SL 8–12, TP 15–25+
• Mandatory confirmation: (Script signal) + (OB or FVG or candle)

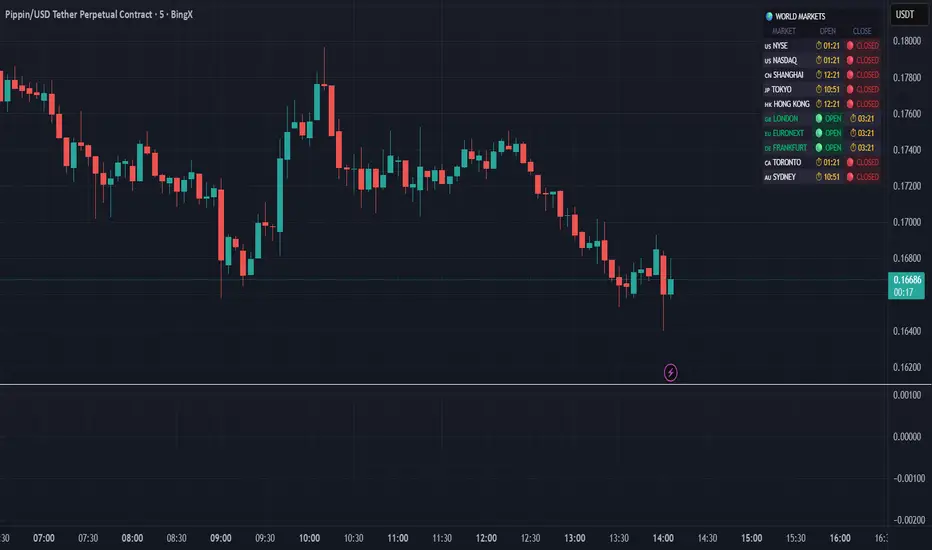
World Markets Table
🌍 World Markets Session Table - Track Global Exchanges in Real-Time
Monitor 10 major stock exchanges worldwide with live market status, countdown timers, and customizable themes. Perfect for multi-market traders, global portfolio managers, and anyone trading across time zones.
✨ Key Features
10 Global Exchanges Tracked:
🇺🇸 NYSE & NASDAQ (New York)
🇨🇳 Shanghai Stock Exchange
🇯🇵 Tokyo Stock Exchange
🇭🇰 Hong Kong Stock Exchange
🇬🇧 London Stock Exchange
🇪🇺 Euronext
🇩🇪 Frankfurt (Xetra)
🇨🇦 Toronto Stock Exchange
🇦🇺 Australian Securities Exchange
Real-Time Market Intelligence:
✅ Live OPEN/CLOSED status with colored indicators
⏱️ Countdown timers to market open/close
🗓️ Automatic weekday/weekend detection
🕒 Optional seconds display for precision timing
🎯 Visual status badges (green for open, red for closed)
Full Customization:
📍 6 table positions (top/bottom × left/center/right)
📏 4 size options (tiny, small, normal, large)
🎨 4 professional themes: Dark, Light, Neon, Ocean
🚩 Toggle country flags on/off
💼 Clean, professional table layout
🎨 Professional Themes
Dark Theme: Sleek charcoal design for night trading
Light Theme: Bright, clean interface for daylight charts
Neon Theme: Vibrant cyberpunk aesthetic with electric colors
Ocean Theme: Calming blue palette for focused analysis
💡 Perfect For
Multi-market traders monitoring global sessions simultaneously
Identifying optimal trading windows across time zones
Planning entries/exits around market opens and closes
Portfolio managers tracking international markets
Forex, indices, and commodities traders
Pre-market and after-hours trading planning
⚙️ How It Works
All market times are calculated in UTC and automatically adjust to your local timezone. The indicator overlays your chart without interfering with price action or technical analysis. Simply add it to any chart, customize the appearance, and stay informed about global market hours.
📊 Usage Tips
Place the table in a non-intrusive position to maintain chart clarity
Use countdown timers to prepare for volatility at market open/close
Match the theme to your chart colors for a cohesive workspace
Enable seconds display when precision timing matters most
Note: This is a display-only indicator showing market hours. It does not generate trading signals or plot price data.
Khango's Key//@version=5
//@sbtnc thank you for doing the base code
//Added additional levels for convienience sake.
indicator('Key Levels SpacemanBTC IDWM', shorttitle='Khangos Key', overlay=true, max_lines_count=100)
//35 works
displayStyle = input.string(defval='Standard', title='Display Style', options= , inline='Display')
mergebool = input.bool(defval=true, title='Merge Levels?', inline='Display')
distanceright = input.int(defval=30, title='Distance', minval=5, maxval=500, inline='Dist')
radistance = input.int(defval=250, title='Anchor Distance', minval=5, maxval=500, inline='Dist')
labelsize = input.string(defval='Medium', title='Text Size', options= )
linesize = input.string(defval='Small', title='Line Width', options= , inline='Line')
linestyle = input.string(defval='Solid', title='Line Style', options= , inline='Line')
GlobalTextType = input.bool(defval=false, title='Global Text ShortHand', tooltip='Enable for shorthand text on all text')
var globalcoloring = input.bool(defval=false, title='Global Coloring', tooltip='Enable for all color controls via one color', inline='GC')
GlobalColor = input.color(title='', defval=color.white, inline='GC')
//var show_tails = input(defval = false, title = "Always Show", type = input.bool)
= request.security(syminfo.tickerid, 'D', , lookahead=barmerge.lookahead_on)
= request.security(syminfo.tickerid, 'D', [time , high ], lookahead=barmerge.lookahead_on)
= request.security(syminfo.tickerid, 'D', [time , low ], lookahead=barmerge.lookahead_on)
cdailyh_open = request.security(syminfo.tickerid, 'D', high, lookahead=barmerge.lookahead_on)
cdailyl_open = request.security(syminfo.tickerid, 'D', low, lookahead=barmerge.lookahead_on)
var monday_time = time
var monday_high = high
var monday_low = low
= request.security(syminfo.tickerid, 'W', , lookahead=barmerge.lookahead_on)
= request.security(syminfo.tickerid, 'W', [time , high ], lookahead=barmerge.lookahead_on)
= request.security(syminfo.tickerid, 'W', [time , low ], lookahead=barmerge.lookahead_on)
= request.security(syminfo.tickerid, 'M', , lookahead=barmerge.lookahead_on)
= request.security(syminfo.tickerid, 'M', [time , high ], lookahead=barmerge.lookahead_on)
= request.security(syminfo.tickerid, 'M', [time , low ], lookahead=barmerge.lookahead_on)
= request.security(syminfo.tickerid, '3M', , lookahead=barmerge.lookahead_on)
= request.security(syminfo.tickerid, '3M', [time , high ], lookahead=barmerge.lookahead_on)
= request.security(syminfo.tickerid, '3M', [time , low ], lookahead=barmerge.lookahead_on)
= request.security(syminfo.tickerid, '12M', , lookahead=barmerge.lookahead_on)
= request.security(syminfo.tickerid, '12M', , lookahead=barmerge.lookahead_on)
= request.security(syminfo.tickerid, '12M', , lookahead=barmerge.lookahead_on)
= request.security(syminfo.tickerid, '240', , lookahead=barmerge.lookahead_on)
= request.security(syminfo.tickerid, '240', [time , high ], lookahead=barmerge.lookahead_on)
= request.security(syminfo.tickerid, '240', [time , low ], lookahead=barmerge.lookahead_on)
//------------------------------ Inputs -------------------------------
var is_intra_enabled = input.bool(defval=false, title='Open', group='4H', inline='4H')
var is_intrarange_enabled = input.bool(defval=false, title='Prev H/L', group='4H', inline='4H')
var is_intram_enabled = input.bool(defval=false, title='Prev Mid', group='4H', inline='4H')
IntraTextType = input.bool(defval=false, title='ShortHand', group='4H', inline='4Hsh')
var is_daily_enabled = input.bool(defval=true, title='Open', group='Daily', inline='Daily')
var is_dailyrange_enabled = input.bool(defval=false, title='Prev H/L', group='Daily', inline='Daily')
var is_dailym_enabled = input.bool(defval=false, title='Prev Mid', group='Daily', inline='Daily')
DailyTextType = input.bool(defval=false, title='ShortHand', group='Daily', inline='Dailysh')
var is_monday_enabled = input.bool(defval=true, title='Range', group='Monday Range', inline='Monday')
var is_monday_mid = input.bool(defval=true, title='Mid', group='Monday Range', inline='Monday')
var untested_monday = false
MondayTextType = input.bool(defval=false, title='ShortHand', group='Monday Range', inline='Mondaysh')
var is_weekly_enabled = input.bool(defval=true, title='Open', group='Weekly', inline='Weekly')
var is_weeklyrange_enabled = input.bool(defval=true, title='Prev H/L', group='Weekly', inline='Weekly')
var is_weekly_mid = input.bool(defval=true, title='Prev Mid', group='Weekly', inline='Weekly')
WeeklyTextType = input.bool(defval=false, title='ShortHand', group='Weekly', inline='Weeklysh')
var is_monthly_enabled = input.bool(defval=true, title='Open', group='Monthly', inline='Monthly')
var is_monthlyrange_enabled = input.bool(defval=true, title='Prev H/L', group='Monthly', inline='Monthly')
var is_monthly_mid = input.bool(defval=true, title='Prev Mid', group='Monthly', inline='Monthly')
MonthlyTextType = input.bool(defval=false, title='ShortHand', group='Monthly', inline='Monthlysh')
var is_quarterly_enabled = input.bool(defval=true, title='Open', group='Quarterly', inline='Quarterly')
var is_quarterlyrange_enabled = input.bool(defval=false, title='Prev H/L', group='Quarterly', inline='Quarterly')
var is_quarterly_mid = input.bool(defval=true, title='Prev Mid', group='Quarterly', inline='Quarterly')
QuarterlyTextType = input.bool(defval=false, title='ShortHand', group='Quarterly', inline='Quarterlysh')
var is_yearly_enabled = input.bool(defval=true, title='Open', group='Yearly', inline='Yearly')
var is_yearlyrange_enabled = input.bool(defval=false, title='Current H/L', group='Yearly', inline='Yearly')
var is_yearly_mid = input.bool(defval=true, title='Mid', group='Yearly', inline='Yearly')
YearlyTextType = input.bool(defval=false, title='ShortHand', group='Yearly', inline='Yearlysh')
var is_londonrange_enabled = input.bool(defval=false, title='London Range', group='FX Sessions', inline='FX')
var is_usrange_enabled = input.bool(defval=false, title='New York Range', group='FX Sessions', inline='FX')
var is_asiarange_enabled = input.bool(defval=false, title='Asia Range', group='FX Sessions', inline='FX')
SessionTextType = input.bool(defval=false, title='ShortHand', group='FX Sessions', inline='FXColor')
Londont = input.session("0800-1600", "London Session")
USt = input.session("1400-2100", "New York Session")
Asiat = input.session("0000-0900", "Tokyo Session")
DailyColor = input.color(title='', defval=#08bcd4, group='Daily', inline='Dailysh')
MondayColor = input.color(title='', defval=color.white, group='Monday Range', inline='Mondaysh')
WeeklyColor = input.color(title='', defval=#fffcbc, group='Weekly', inline='Weeklysh')
MonthlyColor = input.color(title='', defval=#08d48c, group='Monthly', inline='Monthlysh')
YearlyColor = input.color(title='', defval=color.red, group='Yearly', inline='Yearlysh')
quarterlyColor = input.color(title='', defval=color.red, group='Quarterly', inline='Quarterlysh')
IntraColor = input.color(title='', defval=color.orange, group='4H', inline='4Hsh')
LondonColor = input.color(title='', defval=color.white, group='FX Sessions', inline='FXColor')
USColor = input.color(title='', defval=color.white, group='FX Sessions', inline='FXColor')
AsiaColor = input.color(title='', defval=color.white, group='FX Sessions', inline='FXColor')
var pdhtext = GlobalTextType or DailyTextType ? 'PDH' : 'Prev Day High'
var pdltext = GlobalTextType or DailyTextType ? 'PDL' : 'Prev Day Low'
var dotext = GlobalTextType or DailyTextType ? 'DO' : 'Daily Open'
var pdmtext = GlobalTextType or DailyTextType ? 'PDM' : 'Prev Day Mid'
var pwhtext = GlobalTextType or WeeklyTextType ? 'PWH' : 'Prev Week High'
var pwltext = GlobalTextType or WeeklyTextType ? 'PWL' : 'Prev Week Low'
var wotext = GlobalTextType or WeeklyTextType ? 'WO' : 'Weekly Open'
var pwmtext = GlobalTextType or WeeklyTextType ? 'PWM' : 'Prev Week Mid'
var pmhtext = GlobalTextType or MonthlyTextType ? 'PMH' : 'Prev Month High'
var pmltext = GlobalTextType or MonthlyTextType ? 'PML' : 'Prev Month Low'
var motext = GlobalTextType or MonthlyTextType ? 'MO' : 'Monthly Open'
var pmmtext = GlobalTextType or MonthlyTextType ? 'PMM' : 'Prev Month Mid'
var pqhtext = GlobalTextType or QuarterlyTextType ? 'PQH' : 'Prev Quarter High'
var pqltext = GlobalTextType or QuarterlyTextType ? 'PQL' : 'Prev Quarter Low'
var qotext = GlobalTextType or QuarterlyTextType ? 'QO' : 'Quarterly Open'
var pqmtext = GlobalTextType or QuarterlyTextType ? 'PQM' : 'Prev Quarter Mid'
var cyhtext = GlobalTextType or YearlyTextType ? 'CYH' : 'Current Year High'
var cyltext = GlobalTextType or YearlyTextType ? 'CYL' : 'Current Year Low'
var yotext = GlobalTextType or YearlyTextType ? 'YO' : 'Yearly Open'
var cymtext = GlobalTextType or YearlyTextType ? 'CYM' : 'Current Year Mid'
var pihtext = GlobalTextType or IntraTextType ? 'P-4H-H' : 'Prev 4H High'
var piltext = GlobalTextType or IntraTextType ? 'P-4H-L' : 'Prev 4H Low'
var iotext = GlobalTextType or IntraTextType ? '4H-O' : '4H Open'
var pimtext = GlobalTextType or IntraTextType ? 'P-4H-M' : 'Prev 4H Mid'
var pmonhtext = GlobalTextType or MondayTextType ? 'MDAY-H' : 'Monday High'
var pmonltext = GlobalTextType or MondayTextType ? 'MDAY-L' : 'Monday Low'
var pmonmtext = GlobalTextType or MondayTextType ? 'MDAY-M' : 'Monday Mid'
var lhtext = GlobalTextType or SessionTextType ? 'Lon-H' : 'London High'
var lltext = GlobalTextType or SessionTextType ? 'Lon-L' : 'London Low'
var lotext = GlobalTextType or SessionTextType ? 'Lon-O' : 'London Open'
var ushtext = GlobalTextType or SessionTextType ? 'NY-H' : 'New York High'
var usltext = GlobalTextType or SessionTextType ? 'NY-L' : 'New York Low'
var usotext = GlobalTextType or SessionTextType ? 'NY-O' : 'New York Open'
var asiahtext = GlobalTextType or SessionTextType ? 'AS-H' : 'Asia High'
var asialtext = GlobalTextType or SessionTextType ? 'AS-L' : 'Asia Low'
var asiaotext = GlobalTextType or SessionTextType ? 'AS-O' : 'Asia Open'
if globalcoloring == true
DailyColor := GlobalColor
MondayColor := GlobalColor
WeeklyColor := GlobalColor
MonthlyColor := GlobalColor
YearlyColor := GlobalColor
quarterlyColor := GlobalColor
IntraColor := GlobalColor
IntraColor
if weekly_time != weekly_time
untested_monday := false
untested_monday
if is_monday_enabled == true and untested_monday == false
untested_monday := true
monday_time := daily_time
monday_high := cdailyh_open
monday_low := cdailyl_open
monday_low
linewidthint = 1
if linesize == 'Small'
linewidthint := 1
linewidthint
if linesize == 'Medium'
linewidthint := 2
linewidthint
if linesize == 'Large'
linewidthint := 3
linewidthint
var DEFAULT_LINE_WIDTH = linewidthint
var DEFAULT_TAIL_WIDTH = linewidthint
fontsize = size.small
if labelsize == 'Small'
fontsize := size.small
fontsize
if labelsize == 'Medium'
fontsize := size.normal
fontsize
if labelsize == 'Large'
fontsize := size.large
fontsize
linestyles = line.style_solid
if linestyle == 'Dashed'
linestyles := line.style_dashed
linestyles
if linestyle == 'Dotted'
linestyles := line.style_dotted
linestyles
var DEFAULT_LABEL_SIZE = fontsize
var DEFAULT_LABEL_STYLE = label.style_none
var DEFAULT_EXTEND_RIGHT = distanceright
London = time(timeframe.period, Londont)
US = time(timeframe.period, USt)
Asia = time(timeframe.period, Asiat)
var clondonhigh = 0.0
var clondonlow = close
var londontime = time
var flondonhigh = 0.0
var flondonlow = 0.0
var flondonopen = 0.0
var onelondonfalse = false
if London
if high > clondonhigh
clondonhigh := high
clondonhigh
if low < clondonlow
clondonlow := low
clondonlow
if onelondonfalse
londontime := time
flondonopen := open
flondonopen
flondonhigh := clondonhigh
flondonlow := clondonlow
onelondonfalse := false
onelondonfalse
else
if onelondonfalse == false
flondonhigh := clondonhigh
flondonlow := clondonlow
flondonlow
onelondonfalse := true
clondonhigh := 0.0
clondonlow := close
clondonlow
//////////////////////////////////
var cushigh = 0.0
var cuslow = close
var ustime = time
var fushigh = 0.0
var fuslow = 0.0
var fusopen = 0.0
var oneusfalse = false
if US
if high > cushigh
cushigh := high
cushigh
if low < cuslow
cuslow := low
cuslow
if oneusfalse
ustime := time
fusopen := open
fusopen
fushigh := cushigh
fuslow := cuslow
oneusfalse := false
oneusfalse
else
if oneusfalse == false
fushigh := cushigh
fuslow := cuslow
fuslow
oneusfalse := true
cushigh := 0.0
cuslow := close
cuslow
//////////////////////////////////
var casiahigh = 0.0
var casialow = close
var asiatime = time
var fasiahigh = 0.0
var fasialow = 0.0
var fasiaopen = 0.0
var oneasiafalse = false
if Asia
if high > casiahigh
casiahigh := high
casiahigh
if low < casialow
casialow := low
casialow
if oneasiafalse
asiatime := time
fasiaopen := open
fasiaopen
fasiahigh := casiahigh
fasialow := casialow
oneasiafalse := false
oneasiafalse
else
if oneasiafalse == false
fasiahigh := casiahigh
fasialow := casialow
fasialow
oneasiafalse := true
casiahigh := 0.0
casialow := close
casialow
//------------------------------ Plotting ------------------------------
var pricearray = array.new_float(0)
var labelarray = array.new_label(0)
f_LevelMerge(pricearray, labelarray, currentprice, currentlabel, currentcolor) =>
if array.includes(pricearray, currentprice)
whichindex = array.indexof(pricearray, currentprice)
labelhold = array.get(labelarray, whichindex)
whichtext = label.get_text(labelhold)
label.set_text(labelhold, label.get_text(currentlabel) + ' / ' + whichtext)
label.set_text(currentlabel, '')
label.set_textcolor(labelhold, currentcolor)
else
array.push(pricearray, currentprice)
array.push(labelarray, currentlabel)
var can_show_daily = is_daily_enabled and timeframe.isintraday
var can_show_weekly = is_weekly_enabled and not timeframe.isweekly and not timeframe.ismonthly
var can_show_monthly = is_monthly_enabled and not timeframe.ismonthly
get_limit_right(bars) =>
timenow + (time - time ) * bars
// the following code doesn't need to be processed on every candle
if barstate.islast
is_weekly_open = dayofweek == dayofweek.monday
is_monthly_open = dayofmonth == 1
can_draw_daily = (is_weekly_enabled ? not is_weekly_open : true) and (is_monthly_enabled ? not is_monthly_open : true)
can_draw_weekly = is_monthly_enabled ? not(is_monthly_open and is_weekly_open) : true
can_draw_intra = is_intra_enabled
can_draw_intrah = is_intrarange_enabled
can_draw_intral = is_intrarange_enabled
can_draw_intram = is_intram_enabled
pricearray := array.new_float(0)
labelarray := array.new_label(0)
/////////////////////////////////
if is_londonrange_enabled
//label.new(bar_index,high)
london_limit_right = get_limit_right(DEFAULT_EXTEND_RIGHT)
if displayStyle == 'Right Anchored'
londontime := get_limit_right(radistance)
londontime
var londonh_line = line.new(x1=londontime, x2=london_limit_right, y1=flondonhigh, y2=flondonhigh, color=LondonColor, width=DEFAULT_LINE_WIDTH, xloc=xloc.bar_time, style=linestyles)
var londonl_line = line.new(x1=londontime, x2=london_limit_right, y1=flondonlow, y2=flondonlow, color=LondonColor, width=DEFAULT_LINE_WIDTH, xloc=xloc.bar_time, style=linestyles)
var londono_line = line.new(x1=londontime, x2=london_limit_right, y1=flondonopen, y2=flondonopen, color=LondonColor, width=DEFAULT_LINE_WIDTH, xloc=xloc.bar_time, style=linestyles)
var londonh_label = label.new(x=london_limit_right, y=flondonhigh, text=lhtext, style=DEFAULT_LABEL_STYLE, textcolor=LondonColor, size=DEFAULT_LABEL_SIZE, xloc=xloc.bar_time)
var londonl_label = label.new(x=london_limit_right, y=flondonlow, text=lltext, style=DEFAULT_LABEL_STYLE, textcolor=LondonColor, size=DEFAULT_LABEL_SIZE, xloc=xloc.bar_time)
var londono_label = label.new(x=london_limit_right, y=flondonopen, text=lotext, style=DEFAULT_LABEL_STYLE, textcolor=LondonColor, size=DEFAULT_LABEL_SIZE, xloc=xloc.bar_time)
line.set_x1(londonh_line, londontime)
line.set_x2(londonh_line, london_limit_right)
line.set_y1(londonh_line, flondonhigh)
line.set_y2(londonh_line, flondonhigh)
line.set_x1(londonl_line, londontime)
line.set_x2(londonl_line, london_limit_right)
line.set_y1(londonl_line, flondonlow)
line.set_y2(londonl_line, flondonlow)
line.set_x1(londono_line, londontime)
line.set_x2(londono_line, london_limit_right)
line.set_y1(londono_line, flondonopen)
line.set_y2(londono_line, flondonopen)
label.set_x(londonh_label, london_limit_right)
label.set_y(londonh_label, flondonhigh)
label.set_text(londonh_label, lhtext)
label.set_x(londonl_label, london_limit_right)
label.set_y(londonl_label, flondonlow)
label.set_text(londonl_label, lltext)
label.set_x(londono_label, london_limit_right)
label.set_y(londono_label, flondonopen)
label.set_text(londono_label, lotext)
if mergebool
f_LevelMerge(pricearray, labelarray, flondonhigh, londonh_label, LondonColor)
f_LevelMerge(pricearray, labelarray, flondonlow, londonl_label, LondonColor)
f_LevelMerge(pricearray, labelarray, flondonopen, londono_label, LondonColor)
//////////////////////////////////////////////////////////////////////////////////
/////////////////////////////////
if is_usrange_enabled
//label.new(bar_index,high)
us_limit_right = get_limit_right(DEFAULT_EXTEND_RIGHT)
if displayStyle == 'Right Anchored'
ustime := get_limit_right(radistance)
ustime
var ush_line = line.new(x1=ustime, x2=us_limit_right, y1=fushigh, y2=fushigh, color=USColor, width=DEFAULT_LINE_WIDTH, xloc=xloc.bar_time, style=linestyles)
var usl_line = line.new(x1=ustime, x2=us_limit_right, y1=fuslow, y2=fuslow, color=USColor, width=DEFAULT_LINE_WIDTH, xloc=xloc.bar_time, style=linestyles)
var uso_line = line.new(x1=ustime, x2=us_limit_right, y1=fusopen, y2=fusopen, color=USColor, width=DEFAULT_LINE_WIDTH, xloc=xloc.bar_time, style=linestyles)
var ush_label = label.new(x=us_limit_right, y=fushigh, text=lhtext, style=DEFAULT_LABEL_STYLE, textcolor=USColor, size=DEFAULT_LABEL_SIZE, xloc=xloc.bar_time)
var usl_label = label.new(x=us_limit_right, y=fuslow, text=lltext, style=DEFAULT_LABEL_STYLE, textcolor=USColor, size=DEFAULT_LABEL_SIZE, xloc=xloc.bar_time)
var uso_label = label.new(x=us_limit_right, y=fusopen, text=lotext, style=DEFAULT_LABEL_STYLE, textcolor=USColor, size=DEFAULT_LABEL_SIZE, xloc=xloc.bar_time)
line.set_x1(ush_line, ustime)
line.set_x2(ush_line, us_limit_right)
line.set_y1(ush_line, fushigh)
line.set_y2(ush_line, fushigh)
line.set_x1(usl_line, ustime)
line.set_x2(usl_line, us_limit_right)
line.set_y1(usl_line, fuslow)
line.set_y2(usl_line, fuslow)
line.set_x1(uso_line, ustime)
line.set_x2(uso_line, us_limit_right)
line.set_y1(uso_line, fusopen)
line.set_y2(uso_line, fusopen)
label.set_x(ush_label, us_limit_right)
label.set_y(ush_label, fushigh)
label.set_text(ush_label, ushtext)
label.set_x(usl_label, us_limit_right)
label.set_y(usl_label, fuslow)
label.set_text(usl_label, usltext)
label.set_x(uso_label, us_limit_right)
label.set_y(uso_label, fusopen)
label.set_text(uso_label, usotext)
if mergebool
f_LevelMerge(pricearray, labelarray, fushigh, ush_label, USColor)
f_LevelMerge(pricearray, labelarray, fuslow, usl_label, USColor)
f_LevelMerge(pricearray, labelarray, fusopen, uso_label, USColor)
/////////////////////////////////
if is_asiarange_enabled
//label.new(bar_index,high)
asia_limit_right = get_limit_right(DEFAULT_EXTEND_RIGHT)
if displayStyle == 'Right Anchored'
asiatime := get_limit_right(radistance)
asiatime
var asiah_line = line.new(x1=asiatime, x2=asia_limit_right, y1=fasiahigh, y2=fasiahigh, color=AsiaColor, width=DEFAULT_LINE_WIDTH, xloc=xloc.bar_time, style=linestyles)
var asial_line = line.new(x1=asiatime, x2=asia_limit_right, y1=fasialow, y2=fasialow, color=AsiaColor, width=DEFAULT_LINE_WIDTH, xloc=xloc.bar_time, style=linestyles)
var asiao_line = line.new(x1=asiatime, x2=asia_limit_right, y1=fasiaopen, y2=fasiaopen, color=AsiaColor, width=DEFAULT_LINE_WIDTH, xloc=xloc.bar_time, style=linestyles)
var asiah_label = label.new(x=asia_limit_right, y=fasiahigh, text=asiahtext, style=DEFAULT_LABEL_STYLE, textcolor=AsiaColor, size=DEFAULT_LABEL_SIZE, xloc=xloc.bar_time)
var asial_label = label.new(x=asia_limit_right, y=fasialow, text=asialtext, style=DEFAULT_LABEL_STYLE, textcolor=AsiaColor, size=DEFAULT_LABEL_SIZE, xloc=xloc.bar_time)
var asiao_label = label.new(x=asia_limit_right, y=fasiaopen, text=asiaotext, style=DEFAULT_LABEL_STYLE, textcolor=AsiaColor, size=DEFAULT_LABEL_SIZE, xloc=xloc.bar_time)
line.set_x1(asiah_line, asiatime)
line.set_x2(asiah_line, asia_limit_right)
line.set_y1(asiah_line, fasiahigh)
line.set_y2(asiah_line, fasiahigh)
line.set_x1(asial_line, asiatime)
line.set_x2(asial_line, asia_limit_right)
line.set_y1(asial_line, fasialow)
line.set_y2(asial_line, fasialow)
line.set_x1(asiao_line, asiatime)
line.set_x2(asiao_line, asia_limit_right)
line.set_y1(asiao_line, fasiaopen)
line.set_y2(asiao_line, fasiaopen)
label.set_x(asiah_label, asia_limit_right)
label.set_y(asiah_label, fasiahigh)
label.set_text(asiah_label, asiahtext)
label.set_x(asial_label, asia_limit_right)
label.set_y(asial_label, fasialow)
label.set_text(asial_label, asialtext)
label.set_x(asiao_label, asia_limit_right)
label.set_y(asiao_label, fasiaopen)
label.set_text(asiao_label, asiaotext)
if mergebool
f_LevelMerge(pricearray, labelarray, fasiahigh, asiah_label, AsiaColor)
f_LevelMerge(pricearray, labelarray, fasialow, asial_label, AsiaColor)
f_LevelMerge(pricearray, labelarray, fasiaopen, asiao_label, AsiaColor)
//////////////////////////////////////////////////////////////////////////////////
//////////////////////////////////////////////////////////////////////////////////
if can_draw_intra
intra_limit_right = get_limit_right(DEFAULT_EXTEND_RIGHT)
if displayStyle == 'Right Anchored'
intra_time := get_limit_right(radistance)
intra_time
var intra_line = line.new(x1=intra_time, x2=intra_limit_right, y1=intra_open, y2=intra_open, color=IntraColor, width=DEFAULT_LINE_WIDTH, xloc=xloc.bar_time, style=linestyles)
var intra_label = label.new(x=intra_limit_right, y=intra_open, text=iotext, style=DEFAULT_LABEL_STYLE, textcolor=IntraColor, size=DEFAULT_LABEL_SIZE, xloc=xloc.bar_time)
line.set_x1(intra_line, intra_time)
line.set_x2(intra_line, intra_limit_right)
line.set_y1(intra_line, intra_open)
line.set_y2(intra_line, intra_open)
label.set_x(intra_label, intra_limit_right)
label.set_y(intra_label, intra_open)
label.set_text(intra_label, iotext)
if mergebool
f_LevelMerge(pricearray, labelarray, intra_open, intra_label, IntraColor)
//////////////////////////////////////////////////////////////////////////////////
//HIGH HIGH HIGH HIGH HIGH HIGH HIGH HIGH HIGH HIGH HIGH HIGH HIGH HIGH HIGH HIGH
if can_draw_intrah
intrah_limit_right = get_limit_right(DEFAULT_EXTEND_RIGHT)
if displayStyle == 'Right Anchored'
intrah_time := get_limit_right(radistance)
intrah_time
var intrah_line = line.new(x1=intrah_time, x2=intrah_limit_right, y1=intrah_open, y2=intrah_open, color=IntraColor, width=DEFAULT_LINE_WIDTH, xloc=xloc.bar_time, style=linestyles)
var intrah_label = label.new(x=intrah_limit_right, y=intrah_open, text=pihtext, style=DEFAULT_LABEL_STYLE, textcolor=IntraColor, size=DEFAULT_LABEL_SIZE, xloc=xloc.bar_time)
line.set_x1(intrah_line, intrah_time)
line.set_x2(intrah_line, intrah_limit_right)
line.set_y1(intrah_line, intrah_open)
line.set_y2(intrah_line, intrah_open)
label.set_x(intrah_label, intrah_limit_right)
label.set_y(intrah_label, intrah_open)
label.set_text(intrah_label, pihtext)
if mergebool
f_LevelMerge(pricearray, labelarray, intrah_open, intrah_label, IntraColor)
//////////////////////////////////////////////////////////////////////////////////
//LOW LOW LOW LOW LOW LOW LOW LOW LOW LOW LOW LOW LOW LOW LOW LOW
if can_draw_intral
intral_limit_right = get_limit_right(DEFAULT_EXTEND_RIGHT)
if displayStyle == 'Right Anchored'
intral_time := get_limit_right(radistance)
intral_time
var intral_line = line.new(x1=intral_time, x2=intral_limit_right, y1=intral_open, y2=intral_open, color=IntraColor, width=DEFAULT_LINE_WIDTH, xloc=xloc.bar_time, style=linestyles)
var intral_label = label.new(x=intral_limit_right, y=intral_open, text=piltext, style=DEFAULT_LABEL_STYLE, textcolor=IntraColor, size=DEFAULT_LABEL_SIZE, xloc=xloc.bar_time)
line.set_x1(intral_line, intral_time)
line.set_x2(intral_line, intral_limit_right)
line.set_y1(intral_line, intral_open)
line.set_y2(intral_line, intral_open)
label.set_x(intral_label, intral_limit_right)
label.set_y(intral_label, intral_open)
label.set_text(intral_label, piltext)
if mergebool
f_LevelMerge(pricearray, labelarray, intral_open, intral_label, IntraColor)
///////////////////////////////////////////////////////////////////////////////
if can_draw_intram
intram_limit_right = get_limit_right(DEFAULT_EXTEND_RIGHT)
intram_time = intrah_time
intram_open = (intral_open + intrah_open) / 2
if displayStyle == 'Right Anchored'
intram_time := get_limit_right(radistance)
intram_time
var intram_line = line.new(x1=intram_time, x2=intram_limit_right, y1=intram_open, y2=intram_open, color=IntraColor, width=DEFAULT_LINE_WIDTH, xloc=xloc.bar_time, style=linestyles)
var intram_label = label.new(x=intram_limit_right, y=intram_open, text=pimtext, style=DEFAULT_LABEL_STYLE, textcolor=IntraColor, size=DEFAULT_LABEL_SIZE, xloc=xloc.bar_time)
line.set_x1(intram_line, intram_time)
line.set_x2(intram_line, intram_limit_right)
line.set_y1(intram_line, intram_open)
line.set_y2(intram_line, intram_open)
label.set_x(intram_label, intram_limit_right)
label.set_y(intram_label, intram_open)
label.set_text(intram_label, pimtext)
if mergebool
f_LevelMerge(pricearray, labelarray, intram_open, intram_label, IntraColor)
////////////////////////////////////////// MONDAY
if is_monday_enabled
monday_limit_right = get_limit_right(DEFAULT_EXTEND_RIGHT)
if displayStyle == 'Right Anchored'
monday_time := get_limit_right(radistance)
monday_time
var monday_line = line.new(x1=monday_time, x2=monday_limit_right, y1=monday_high, y2=monday_high, color=MondayColor, width=DEFAULT_LINE_WIDTH, xloc=xloc.bar_time, style=linestyles)
var monday_label = label.new(x=monday_limit_right, y=monday_high, text=pmonhtext, style=DEFAULT_LABEL_STYLE, textcolor=MondayColor, size=DEFAULT_LABEL_SIZE, xloc=xloc.bar_time)
line.set_x1(monday_line, monday_time)
line.set_x2(monday_line, monday_limit_right)
line.set_y1(monday_line, monday_high)
line.set_y2(monday_line, monday_high)
label.set_x(monday_label, monday_limit_right)
label.set_y(monday_label, monday_high)
label.set_text(monday_label, pmonhtext)
if mergebool
f_LevelMerge(pricearray, labelarray, monday_high, monday_label, MondayColor)
if is_monday_enabled
monday_limit_right = get_limit_right(DEFAULT_EXTEND_RIGHT)
if displayStyle == 'Right Anchored'
monday_time := get_limit_right(radistance)
monday_time
var monday_low_line = line.new(x1=monday_time, x2=monday_limit_right, y1=monday_low, y2=monday_low, color=MondayColor, width=DEFAULT_LINE_WIDTH, xloc=xloc.bar_time, style=linestyles)
var monday_low_label = label.new(x=monday_limit_right, y=monday_low, text=pmonltext, style=DEFAULT_LABEL_STYLE, textcolor=MondayColor, size=DEFAULT_LABEL_SIZE, xloc=xloc.bar_time)
line.set_x1(monday_low_line, monday_time)
line.set_x2(monday_low_line, monday_limit_right)
line.set_y1(monday_low_line, monday_low)
line.set_y2(monday_low_line, monday_low)
label.set_x(monday_low_label, monday_limit_right)
label.set_y(monday_low_label, monday_low)
label.set_text(monday_low_label, pmonltext)
if mergebool
f_LevelMerge(pricearray, labelarray, monday_low, monday_low_label, MondayColor)
if is_monday_mid
mondaym_limit_right = get_limit_right(DEFAULT_EXTEND_RIGHT)
mondaym_open = (monday_high + monday_low) / 2
if displayStyle == 'Right Anchored'
monday_time := get_limit_right(radistance)
monday_time
var mondaym_line = line.new(x1=monday_time, x2=mondaym_limit_right, y1=mondaym_open, y2=mondaym_open, color=MondayColor, width=DEFAULT_LINE_WIDTH, xloc=xloc.bar_time, style=linestyles)
var mondaym_label = label.new(x=mondaym_limit_right, y=mondaym_open, text=pmonmtext, style=DEFAULT_LABEL_STYLE, textcolor=MondayColor, size=DEFAULT_LABEL_SIZE, xloc=xloc.bar_time)
line.set_x1(mondaym_line, monday_time)
line.set_x2(mondaym_line, mondaym_limit_right)
line.set_y1(mondaym_line, mondaym_open)
line.set_y2(mondaym_line, mondaym_open)
label.set_x(mondaym_label, mondaym_limit_right)
label.set_y(mondaym_label, mondaym_open)
label.set_text(mondaym_label, pmonmtext)
if mergebool
f_LevelMerge(pricearray, labelarray, mondaym_open, mondaym_label, MondayColor)
//////////////////////////////////////////////////////////////////////////////////
////////////////////////DAILY OPEN DAILY OPEN DAILY OPEN DAILY OPEN DAILY OPEN DAILY OPEN DAILY OPEN
if is_daily_enabled
daily_limit_right = get_limit_right(DEFAULT_EXTEND_RIGHT)
if displayStyle == 'Right Anchored'
daily_time := get_limit_right(radistance)
daily_time
var daily_line = line.new(x1=daily_time, x2=daily_limit_right, y1=daily_open, y2=daily_open, color=DailyColor, width=DEFAULT_LINE_WIDTH, xloc=xloc.bar_time, style=linestyles)
var daily_label = label.new(x=daily_limit_right, y=daily_open, text=dotext, style=DEFAULT_LABEL_STYLE, textcolor=DailyColor, size=DEFAULT_LABEL_SIZE, xloc=xloc.bar_time)
line.set_x1(daily_line, daily_time)
line.set_x2(daily_line, daily_limit_right)
line.set_y1(daily_line, daily_open)
line.set_y2(daily_line, daily_open)
label.set_x(daily_label, daily_limit_right)
label.set_y(daily_label, daily_open)
label.set_text(daily_label, dotext)
if mergebool
f_LevelMerge(pricearray, labelarray, daily_open, daily_label, DailyColor)
//////////////////////////////////////////////////////////////////////////////////
//////////////////DAILY HIGH DAILY HIGH DAILY HIGH DAILY HIGH DAILY HIGH DAILY HIGH DAILY HIGH
if is_dailyrange_enabled
dailyh_limit_right = get_limit_right(DEFAULT_EXTEND_RIGHT)
if displayStyle == 'Right Anchored'
dailyh_time := get_limit_right(radistance)
dailyh_time
// draw tails before lines for better visual
var dailyh_line = line.new(x1=dailyh_time, x2=dailyh_limit_right, y1=dailyh_open, y2=dailyh_open, color=DailyColor, width=DEFAULT_LINE_WIDTH, xloc=xloc.bar_time, style=linestyles)
var dailyh_label = label.new(x=dailyh_limit_right, y=dailyh_open, text=pdhtext, style=DEFAULT_LABEL_STYLE, textcolor=DailyColor, size=DEFAULT_LABEL_SIZE, xloc=xloc.bar_time)
line.set_x1(dailyh_line, dailyh_time)
line.set_x2(dailyh_line, dailyh_limit_right)
line.set_y1(dailyh_line, dailyh_open)
line.set_y2(dailyh_line, dailyh_open)
label.set_x(dailyh_label, dailyh_limit_right)
label.set_y(dailyh_label, dailyh_open)
label.set_text(dailyh_label, pdhtext)
if mergebool
f_LevelMerge(pricearray, labelarray, dailyh_open, dailyh_label, DailyColor)
//////////////////////////////////////////////////////////////////////////////////
//////////////////DAILY LOW DAILY LOW DAILY LOW DAILY LOW DAILY LOW DAILY LOW DAILY LOW DAILY LOW
if is_dailyrange_enabled
dailyl_limit_right = get_limit_right(DEFAULT_EXTEND_RIGHT)
if displayStyle == 'Right Anchored'
dailyl_time := get_limit_right(radistance)
dailyl_time
var dailyl_line = line.new(x1=dailyl_time, x2=dailyl_limit_right, y1=dailyl_open, y2=dailyl_open, color=DailyColor, width=DEFAULT_LINE_WIDTH, xloc=xloc.bar_time, style=linestyles)
var dailyl_label = label.new(x=dailyl_limit_right, y=dailyl_open, text=pdltext, style=DEFAULT_LABEL_STYLE, textcolor=DailyColor, size=DEFAULT_LABEL_SIZE, xloc=xloc.bar_time)
line.set_x1(dailyl_line, dailyl_time)
line.set_x2(dailyl_line, dailyl_limit_right)
line.set_y1(dailyl_line, dailyl_open)
line.set_y2(dailyl_line, dailyl_open)
label.set_x(dailyl_label, dailyl_limit_right)
label.set_y(dailyl_label, dailyl_open)
label.set_text(dailyl_label, pdltext)
if mergebool
f_LevelMerge(pricearray, labelarray, dailyl_open, dailyl_label, DailyColor)
//////////////////////////////////////////////////////////////////////////////// Daily MID
if is_dailym_enabled
dailym_limit_right = get_limit_right(DEFAULT_EXTEND_RIGHT)
dailym_time = dailyh_time
dailym_open = (dailyl_open + dailyh_open) / 2
if displayStyle == 'Right Anchored'
dailym_time := get_limit_right(radistance)
dailym_time
var dailym_line = line.new(x1=dailym_time, x2=dailym_limit_right, y1=dailym_open, y2=dailym_open, color=DailyColor, width=DEFAULT_LINE_WIDTH, xloc=xloc.bar_time, style=linestyles)
var dailym_label = label.new(x=dailym_limit_right, y=dailym_open, text=pdmtext, style=DEFAULT_LABEL_STYLE, textcolor=DailyColor, size=DEFAULT_LABEL_SIZE, xloc=xloc.bar_time)
line.set_x1(dailym_line, dailym_time)
line.set_x2(dailym_line, dailym_limit_right)
line.set_y1(dailym_line, dailym_open)
line.set_y2(dailym_line, dailym_open)
label.set_x(dailym_label, dailym_limit_right)
label.set_y(dailym_label, dailym_open)
label.set_text(dailym_label, pdmtext)
if mergebool
f_LevelMerge(pricearray, labelarray, dailym_open, dailym_label, DailyColor)
//////////////////////////////////////////////////////////////////////////////////
if is_weekly_enabled
weekly_limit_right = get_limit_right(DEFAULT_EXTEND_RIGHT)
cweekly_time = weekly_time
if displayStyle == 'Right Anchored'
cweekly_time := get_limit_right(radistance)
cweekly_time
var weekly_line = line.new(x1=cweekly_time, x2=weekly_limit_right, y1=weekly_open, y2=weekly_open, color=WeeklyColor, width=DEFAULT_LINE_WIDTH, xloc=xloc.bar_time, style=linestyles)
var weekly_label = label.new(x=weekly_limit_right, y=weekly_open, text=wotext, style=DEFAULT_LABEL_STYLE, textcolor=WeeklyColor, size=DEFAULT_LABEL_SIZE, xloc=xloc.bar_time)
line.set_x1(weekly_line, cweekly_time)
line.set_x2(weekly_line, weekly_limit_right)
line.set_y1(weekly_line, weekly_open)
line.set_y2(weekly_line, weekly_open)
label.set_x(weekly_label, weekly_limit_right)
label.set_y(weekly_label, weekly_open)
label.set_text(weekly_label, wotext)
if mergebool
f_LevelMerge(pricearray, labelarray, weekly_open, weekly_label, WeeklyColor)
// the weekly open can be the daily open too (monday)
// only the weekly will be draw, in these case we update its label
// if is_weekly_open and can_show_daily
// label.set_text(weekly_label, "DO / WO ")
//////////////////////////////////////////////////////////////////////////////////
////////////////////////////////////////////////////////////////////////////////// WEEKLY HIGH WEEKLY HIGH WEEKLY HIGH
if is_weeklyrange_enabled
weeklyh_limit_right = get_limit_right(DEFAULT_EXTEND_RIGHT)
if displayStyle == 'Right Anchored'
weeklyh_time := get_limit_right(radistance)
weeklyh_time
var weeklyh_line = line.new(x1=weeklyh_time, x2=weeklyh_limit_right, y1=weeklyh_open, y2=weeklyh_open, color=WeeklyColor, width=DEFAULT_LINE_WIDTH, xloc=xloc.bar_time, style=linestyles)
var weeklyh_label = label.new(x=weeklyh_limit_right, y=weeklyh_open, text=pwhtext, style=DEFAULT_LABEL_STYLE, textcolor=WeeklyColor, size=DEFAULT_LABEL_SIZE, xloc=xloc.bar_time)
line.set_x1(weeklyh_line, weeklyh_time)
line.set_x2(weeklyh_line, weeklyh_limit_right)
line.set_y1(weeklyh_line, weeklyh_open)
line.set_y2(weeklyh_line, weeklyh_open)
label.set_x(weeklyh_label, weeklyh_limit_right)
label.set_y(weeklyh_label, weeklyh_open)
label.set_text(weeklyh_label, pwhtext)
if mergebool
f_LevelMerge(pricearray, labelarray, weeklyh_open, weeklyh_label, WeeklyColor)
//////////////////////////////////////////////////////////////////////////////////
////////////////////////////////////////////////////////////////////////////////// WEEKLY LOW WEEKLY LOW WEEKLY LOW
if is_weeklyrange_enabled
weeklyl_limit_right = get_limit_right(DEFAULT_EXTEND_RIGHT)
if displayStyle == 'Right Anchored'
weeklyl_time := get_limit_right(radistance)
weeklyl_time
var weeklyl_line = line.new(x1=weeklyl_time, x2=weeklyl_limit_right, y1=weekly_open, y2=weekly_open, color=WeeklyColor, width=DEFAULT_LINE_WIDTH, xloc=xloc.bar_time, style=linestyles)
var weeklyl_label = label.new(x=weeklyl_limit_right, y=weeklyl_open, text=pwltext, style=DEFAULT_LABEL_STYLE, textcolor=WeeklyColor, size=DEFAULT_LABEL_SIZE, xloc=xloc.bar_time)
line.set_x1(weeklyl_line, weeklyl_time)
line.set_x2(weeklyl_line, weeklyl_limit_right)
line.set_y1(weeklyl_line, weeklyl_open)
line.set_y2(weeklyl_line, weeklyl_open)
label.set_x(weeklyl_label, weeklyl_limit_right)
label.set_y(weeklyl_label, weeklyl_open)
label.set_text(weeklyl_label, pwltext)
if mergebool
f_LevelMerge(pricearray, labelarray, weeklyl_open, weeklyl_label, WeeklyColor)
//////////////////////////////////////////////////////////////////////////////////
//////////////////////////////////////////////////////////////////////////////// Weekly MID
if is_weekly_mid
weeklym_limit_right = get_limit_right(DEFAULT_EXTEND_RIGHT)
weeklym_time = weeklyh_time
weeklym_open = (weeklyl_open + weeklyh_open) / 2
if displayStyle == 'Right Anchored'
weeklym_time := get_limit_right(radistance)
weeklym_time
var weeklym_line = line.new(x1=weeklym_time, x2=weeklym_limit_right, y1=weeklym_open, y2=weeklym_open, color=WeeklyColor, width=DEFAULT_LINE_WIDTH, xloc=xloc.bar_time, style=linestyles)
var weeklym_label = label.new(x=weeklym_limit_right, y=weeklym_open, text=pwmtext, style=DEFAULT_LABEL_STYLE, textcolor=WeeklyColor, size=DEFAULT_LABEL_SIZE, xloc=xloc.bar_time)
line.set_x1(weeklym_line, weeklym_time)
line.set_x2(weeklym_line, weeklym_limit_right)
line.set_y1(weeklym_line, weeklym_open)
line.set_y2(weeklym_line, weeklym_open)
label.set_x(weeklym_label, weeklym_limit_right)
label.set_y(weeklym_label, weeklym_open)
label.set_text(weeklym_label, pwmtext)
if mergebool
f_LevelMerge(pricearray, labelarray, weeklym_open, weeklym_label, WeeklyColor)
////////////////////////////////////////////////////////////////////////////////// YEEEAARRLLYY LOW LOW LOW
if is_yearlyrange_enabled
yearlyl_limit_right = get_limit_right(DEFAULT_EXTEND_RIGHT)
if displayStyle == 'Right Anchored'
yearlyl_time := get_limit_right(radistance)
yearlyl_time
var yearlyl_line = line.new(x1=yearlyl_time, x2=yearlyl_limit_right, y1=yearlyl_open, y2=yearlyl_open, color=YearlyColor, width=DEFAULT_LINE_WIDTH, xloc=xloc.bar_time, style=linestyles)
var yearlyl_label = label.new(x=yearlyl_limit_right, y=yearlyl_open, text=cyltext, style=DEFAULT_LABEL_STYLE, textcolor=YearlyColor, size=DEFAULT_LABEL_SIZE, xloc=xloc.bar_time)
line.set_x1(yearlyl_line, yearlyl_time)
line.set_x2(yearlyl_line, yearlyl_limit_right)
line.set_y1(yearlyl_line, yearlyl_open)
line.set_y2(yearlyl_line, yearlyl_open)
label.set_x(yearlyl_label, yearlyl_limit_right)
label.set_y(yearlyl_label, yearlyl_open)
label.set_text(yearlyl_label, cyltext)
if mergebool
f_LevelMerge(pricearray, labelarray, yearlyl_open, yearlyl_label, YearlyColor)
//////////////////////////////////////////////////////////////////////////////////
////////////////////////////////////////////////////////////////////////////////// YEEEAARRLLYY HIGH HIGH HIGH
if is_yearlyrange_enabled
yearlyh_limit_right = get_limit_right(DEFAULT_EXTEND_RIGHT)
if displayStyle == 'Right Anchored'
yearlyh_time := get_limit_right(radistance)
yearlyh_time
var yearlyh_line = line.new(x1=yearlyh_time, x2=yearlyh_limit_right, y1=yearlyh_open, y2=yearlyh_open, color=YearlyColor, width=DEFAULT_LINE_WIDTH, xloc=xloc.bar_time, style=linestyles)
var yearlyh_label = label.new(x=yearlyh_limit_right, y=yearlyh_open, text=cyhtext, style=DEFAULT_LABEL_STYLE, textcolor=YearlyColor, size=DEFAULT_LABEL_SIZE, xloc=xloc.bar_time)
line.set_x1(yearlyh_line, yearlyh_time)
line.set_x2(yearlyh_line, yearlyh_limit_right)
line.set_y1(yearlyh_line, yearlyh_open)
line.set_y2(yearlyh_line, yearlyh_open)
label.set_x(yearlyh_label, yearlyh_limit_right)
label.set_y(yearlyh_label, yearlyh_open)
label.set_text(yearlyh_label, cyhtext)
if mergebool
f_LevelMerge(pricearray, labelarray, yearlyh_open, yearlyh_label, YearlyColor)
//////////////////////////////////////////////////////////////////////////////////
////////////////////////////////////////////////////////////////////////////////// YEEEAARRLLYY OPEN
if is_yearly_enabled
yearly_limit_right = get_limit_right(DEFAULT_EXTEND_RIGHT)
if displayStyle == 'Right Anchored'
yearly_time := get_limit_right(radistance)
yearly_time
var yearly_line = line.new(x1=yearly_time, x2=yearly_limit_right, y1=yearly_open, y2=yearly_open, color=YearlyColor, width=DEFAULT_LINE_WIDTH, xloc=xloc.bar_time, style=linestyles)
var yearly_label = label.new(x=yearly_limit_right, y=yearly_open, text=yotext, style=DEFAULT_LABEL_STYLE, textcolor=YearlyColor, size=DEFAULT_LABEL_SIZE, xloc=xloc.bar_time)
line.set_x1(yearly_line, yearly_time)
line.set_x2(yearly_line, yearly_limit_right)
line.set_y1(yearly_line, yearly_open)
line.set_y2(yearly_line, yearly_open)
label.set_x(yearly_label, yearly_limit_right)
label.set_y(yearly_label, yearly_open)
label.set_text(yearly_label, yotext)
if mergebool
f_LevelMerge(pricearray, labelarray, yearly_open, yearly_label, YearlyColor)
//////////////////////////////////////////////////////////////////////////////////
//////////////////////////////////////////////////////////////////////////////// yearly MID
if is_yearly_mid
yearlym_limit_right = get_limit_right(DEFAULT_EXTEND_RIGHT)
yearlym_time = yearlyh_time
yearlym_open = (yearlyl_open + yearlyh_open) / 2
if displayStyle == 'Right Anchored'
yearlym_time := get_limit_right(radistance)
yearlym_time
var yearlym_line = line.new(x1=yearlym_time, x2=yearlym_limit_right, y1=yearlym_open, y2=yearlym_open, color=YearlyColor, width=DEFAULT_LINE_WIDTH, xloc=xloc.bar_time, style=linestyles)
var yearlym_label = label.new(x=yearlym_limit_right, y=yearlym_open, text=cymtext, style=DEFAULT_LABEL_STYLE, textcolor=YearlyColor, size=DEFAULT_LABEL_SIZE, xloc=xloc.bar_time)
line.set_x1(yearlym_line, yearlym_time)
line.set_x2(yearlym_line, yearlym_limit_right)
line.set_y1(yearlym_line, yearlym_open)
line.set_y2(yearlym_line, yearlym_open)
label.set_x(yearlym_label, yearlym_limit_right)
label.set_y(yearlym_label, yearlym_open)
label.set_text(yearlym_label, cymtext)
if mergebool
f_LevelMerge(pricearray, labelarray, yearlym_open, yearlym_label, YearlyColor)
////////////////////////////////////////////////////////////////////////////////// QUATERLLYYYYY OPEN
if is_quarterly_enabled
quarterly_limit_right = get_limit_right(DEFAULT_EXTEND_RIGHT)
if displayStyle == 'Right Anchored'
quarterly_time := get_limit_right(radistance)
quarterly_time
var quarterly_line = line.new(x1=quarterly_time, x2=quarterly_limit_right, y1=quarterly_open, y2=quarterly_open, color=quarterlyColor, width=DEFAULT_LINE_WIDTH, xloc=xloc.bar_time, style=linestyles)
var quarterly_label = label.new(x=quarterly_limit_right, y=quarterly_open, text=qotext, style=DEFAULT_LABEL_STYLE, textcolor=quarterlyColor, size=DEFAULT_LABEL_SIZE, xloc=xloc.bar_time)
line.set_x1(quarterly_line, quarterly_time)
line.set_x2(quarterly_line, quarterly_limit_right)
line.set_y1(quarterly_line, quarterly_open)
line.set_y2(quarterly_line, quarterly_open)
label.set_x(quarterly_label, quarterly_limit_right)
label.set_y(quarterly_label, quarterly_open)
label.set_text(quarterly_label, qotext)
if mergebool
f_LevelMerge(pricearray, labelarray, quarterly_open, quarterly_label, quarterlyColor)
//////////////////////////////////////////////////////////////////////////////////
////////////////////////////////////////////////////////////////////////////////// QUATERLLYYYYY High
if is_quarterlyrange_enabled
quarterlyh_limit_right = get_limit_right(DEFAULT_EXTEND_RIGHT)
if displayStyle == 'Right Anchored'
quarterlyh_time := get_limit_right(radistance)
quarterlyh_time
var quarterlyh_line = line.new(x1=quarterlyh_time, x2=quarterlyh_limit_right, y1=quarterlyh_open, y2=quarterlyh_open, color=quarterlyColor, width=DEFAULT_LINE_WIDTH, xloc=xloc.bar_time, style=linestyles)
var quarterlyh_label = label.new(x=quarterlyh_limit_right, y=quarterlyh_open, text=pqhtext, style=DEFAULT_LABEL_STYLE, textcolor=quarterlyColor, size=DEFAULT_LABEL_SIZE, xloc=xloc.bar_time)
line.set_x1(quarterlyh_line, quarterlyh_time)
line.set_x2(quarterlyh_line, quarterlyh_limit_right)
line.set_y1(quarterlyh_line, quarterlyh_open)
line.set_y2(quarterlyh_line, quarterlyh_open)
label.set_x(quarterlyh_label, quarterlyh_limit_right)
label.set_y(quarterlyh_label, quarterlyh_open)
label.set_text(quarterlyh_label, pqhtext)
if mergebool
f_LevelMerge(pricearray, labelarray, quarterlyh_open, quarterlyh_label, quarterlyColor)
//////////////////////////////////////////////////////////////////////////////////
////////////////////////////////////////////////////////////////////////////////// QUATERLLYYYYY Low
if is_quarterlyrange_enabled
quarterlyl_limit_right = get_limit_right(DEFAULT_EXTEND_RIGHT)
if displayStyle == 'Right Anchored'
quarterlyl_time := get_limit_right(radistance)
quarterlyl_time
var quarterlyl_line = line.new(x1=quarterlyl_time, x2=quarterlyl_limit_right, y1=quarterlyl_open, y2=quarterlyl_open, color=quarterlyColor, width=DEFAULT_LINE_WIDTH, xloc=xloc.bar_time, style=linestyles)
var quarterlyl_label = label.new(x=quarterlyl_limit_right, y=quarterlyl_open, text=pqltext, style=DEFAULT_LABEL_STYLE, textcolor=quarterlyColor, size=DEFAULT_LABEL_SIZE, xloc=xloc.bar_time)
line.set_x1(quarterlyl_line, quarterlyl_time)
line.set_x2(quarterlyl_line, quarterlyl_limit_right)
line.set_y1(quarterlyl_line, quarterlyl_open)
line.set_y2(quarterlyl_line, quarterlyl_open)
label.set_x(quarterlyl_label, quarterlyl_limit_right)
label.set_y(quarterlyl_label, quarterlyl_open)
label.set_text(quarterlyl_label, pqltext)
if mergebool
f_LevelMerge(pricearray, labelarray, quarterlyl_open, quarterlyl_label, quarterlyColor)
//////////////////////////////////////////////////////////////////////////////////
//////////////////////////////////////////////////////////////////////////////// QUATERLLYYYYY MID
if is_quarterly_mid
quarterlym_limit_right = get_limit_right(DEFAULT_EXTEND_RIGHT)
quarterlym_time = quarterlyh_time
quarterlym_open = (quarterlyl_open + quarterlyh_open) / 2
if displayStyle == 'Right Anchored'
quarterlym_time := get_limit_right(radistance)
quarterlym_time
var quarterlym_line = line.new(x1=quarterlym_time, x2=quarterlym_limit_right, y1=quarterlym_open, y2=quarterlym_open, color=quarterlyColor, width=DEFAULT_LINE_WIDTH, xloc=xloc.bar_time, style=linestyles)
var quarterlym_label = label.new(x=quarterlym_limit_right, y=quarterlym_open, text=pqmtext, style=DEFAULT_LABEL_STYLE, textcolor=quarterlyColor, size=DEFAULT_LABEL_SIZE, xloc=xloc.bar_time)
line.set_x1(quarterlym_line, quarterlym_time)
line.set_x2(quarterlym_line, quarterlym_limit_right)
line.set_y1(quarterlym_line, quarterlym_open)
line.set_y2(quarterlym_line, quarterlym_open)
label.set_x(quarterlym_label, quarterlym_limit_right)
label.set_y(quarterlym_label, quarterlym_open)
label.set_text(quarterlym_label, pqmtext)
if mergebool
f_LevelMerge(pricearray, labelarray, quarterlym_open, quarterlym_label, quarterlyColor)
////////////////////////////////////////////////////////////////////////////////// Monthly LOW LOW LOW
if is_monthlyrange_enabled
monthlyl_limit_right = get_limit_right(DEFAULT_EXTEND_RIGHT)
if displayStyle == 'Right Anchored'
monthlyl_time := get_limit_right(radistance)
monthlyl_time
var monthlyl_line = line.new(x1=monthlyl_time, x2=monthlyl_limit_right, y1=monthlyl_open, y2=monthlyl_open, color=MonthlyColor, width=DEFAULT_LINE_WIDTH, xloc=xloc.bar_time, style=linestyles)
var monthlyl_label = label.new(x=monthlyl_limit_right, y=monthlyl_open, text=pmltext, style=DEFAULT_LABEL_STYLE, textcolor=MonthlyColor, size=DEFAULT_LABEL_SIZE, xloc=xloc.bar_time)
line.set_x1(monthlyl_line, monthlyl_time)
line.set_x2(monthlyl_line, monthlyl_limit_right)
line.set_y1(monthlyl_line, monthlyl_open)
line.set_y2(monthlyl_line, monthlyl_open)
label.set_x(monthlyl_label, monthlyl_limit_right)
label.set_y(monthlyl_label, monthlyl_open)
label.set_text(monthlyl_label, pmltext)
if mergebool
f_LevelMerge(pricearray, labelarray, monthlyl_open, monthlyl_label, MonthlyColor)
// the weekly open can be the daily open too (monday)
// only the weekly will be draw, in these case we update its label
//////////////////////////////////////////////////////////////////////////////////
////////////////////////////////////////////////////////////////////////////////// MONTHLY HIGH HIGH HIGH
if is_monthlyrange_enabled
monthlyh_limit_right = get_limit_right(DEFAULT_EXTEND_RIGHT)
if displayStyle == 'Right Anchored'
monthlyh_time := get_limit_right(radistance)
monthlyh_time
var monthlyh_line = line.new(x1=monthlyh_time, x2=monthlyh_limit_right, y1=monthlyh_open, y2=monthlyh_open, color=MonthlyColor, width=DEFAULT_LINE_WIDTH, xloc=xloc.bar_time, style=linestyles)
var monthlyh_label = label.new(x=monthlyh_limit_right, y=monthlyh_open, text=pmhtext, style=DEFAULT_LABEL_STYLE, textcolor=MonthlyColor, size=DEFAULT_LABEL_SIZE, xloc=xloc.bar_time)
line.set_x1(monthlyh_line, monthlyl_time)
line.set_x2(monthlyh_line, monthlyh_limit_right)
line.set_y1(monthlyh_line, monthlyh_open)
line.set_y2(monthlyh_line, monthlyh_open)
label.set_x(monthlyh_label, monthlyh_limit_right)
label.set_y(monthlyh_label, monthlyh_open)
label.set_text(monthlyh_label, pmhtext)
if mergebool
f_LevelMerge(pricearray, labelarray, monthlyh_open, monthlyh_label, MonthlyColor)
// the weekly open can be the daily open too (monday)
// only the weekly will be draw, in these case we update its label
//////////////////////////////////////////////////////////////////////////////// MONTHLY MID
if is_monthly_mid
monthlym_limit_right = get_limit_right(DEFAULT_EXTEND_RIGHT)
monthlym_time = monthlyh_time
monthlym_open = (monthlyl_open + monthlyh_open) / 2
if displayStyle == 'Right Anchored'
monthlym_time := get_limit_right(radistance)
monthlym_time
var monthlym_line = line.new(x1=monthlym_time, x2=monthlym_limit_right, y1=monthlym_open, y2=monthlym_open, color=MonthlyColor, width=DEFAULT_LINE_WIDTH, xloc=xloc.bar_time, style=linestyles)
var monthlym_label = label.new(x=monthlym_limit_right, y=monthlym_open, text=pmmtext, style=DEFAULT_LABEL_STYLE, textcolor=MonthlyColor, size=DEFAULT_LABEL_SIZE, xloc=xloc.bar_time)
line.set_x1(monthlym_line, monthlym_time)
line.set_x2(monthlym_line, monthlym_limit_right)
line.set_y1(monthlym_line, monthlym_open)
line.set_y2(monthlym_line, monthlym_open)
label.set_x(monthlym_label, monthlym_limit_right)
label.set_y(monthlym_label, monthlym_open)
label.set_text(monthlym_label, pmmtext)
if mergebool
f_LevelMerge(pricearray, labelarray, monthlym_open, monthlym_label, MonthlyColor)
//////////////////////////////////////////////////////////////////////////////////
if is_monthly_enabled
monthly_limit_right = get_limit_right(DEFAULT_EXTEND_RIGHT)
if displayStyle == 'Right Anchored'
monthly_time := get_limit_right(radistance)
monthly_time
var monthlyLine = line.new(x1=monthly_time, x2=monthly_limit_right, y1=monthly_open, y2=monthly_open, color=MonthlyColor, width=DEFAULT_LINE_WIDTH, xloc=xloc.bar_time, style=linestyles)
var monthlyLabel = label.new(x=monthly_limit_right, y=monthly_open, text=motext, style=DEFAULT_LABEL_STYLE, textcolor=MonthlyColor, size=DEFAULT_LABEL_SIZE, xloc=xloc.bar_time)
line.set_x1(monthlyLine, monthly_time)
line.set_x2(monthlyLine, monthly_limit_right)
line.set_y1(monthlyLine, monthly_open)
line.set_y2(monthlyLine, monthly_open)
label.set_x(monthlyLabel, monthly_limit_right)
label.set_y(monthlyLabel, monthly_open)
label.set_text(monthlyLabel, motext)
if mergebool
f_LevelMerge(pricearray, labelarray, monthly_open, monthlyLabel, MonthlyColor)
/////////////////////////////////////////////////////////////////////////////
// the monthly open can be the weekly open (monday 1st) and/or daily open too
// only the monthly will be draw, in these case we update its label
// if is_monthly_open
// if can_show_daily
// label.set_text(monthlyLabel, "DO / MO ")
// if is_weekly_open
// if can_show_weekly
// label.set_text(monthlyLabel, "WO / MO ")
// if can_show_daily and can_show_weekly
// label.set_text(monthlyLabel, "DO / WO / MO ")
// the start of the line is drew from the first week of the month
// if the first day of the weekly candle (monday) is the 2nd of the month
// we fix the start of the line position on the Prev weekly candle
if timeframe.isweekly and dayofweek(monthly_time) != dayofweek.monday
line.set_x1(monthlyLine, monthly_time - (weekly_time - weekly_time ))

📈 Price Crossed Above 50 SMA (One-Time Marker)//@version=5
indicator("📈 Price Above 50 SMA Marker", overlay=true)
// === Calculate 50 SMA ===
sma50 = ta.sma(close, 50)
priceAboveSMA50 = close > sma50
// === Plot the 50 SMA ===
plot(sma50, title="50 SMA", color=color.orange, linewidth=2)
// === Plot Shape When Price Is Above 50 SMA ===
plotshape(
priceAboveSMA50, // condition to trigger
title="Price Above 50 SMA", // tooltip title
location=location.abovebar, // place above candle
color=color.green, // shape color
style=shape.triangleup, // shape style
size=size.small, // size
text="SMA+" // optional label
)

Diganta Strangle Plot with IV This indicator prints a strangle . You can input both the ce and pe strikes as per your trade. This also plots the IV spikes as white dots and Z score spike as white arrows . This are when one should be ready to exit

HTCTS - Session & Time LiquidityHTCTS - Session & Time Liquidity
1. ภาพรวมการทำงาน (Overview)
อินดิเคเตอร์ตัวนี้ทำหน้าที่ 4 อย่างหลักพร้อมกัน:
Auto DST (ปรับเวลาตามฤดูอัตโนมัติ): คุณไม่ต้องมานั่งแก้เวลาเมื่อตลาดต่างประเทศเปลี่ยนเวลา (Daylight Saving Time) เพราะโค้ดอ้างอิง Timezone ของตลาดนั้นๆ โดยตรง (เช่น NY ใช้ America/New_York)
Session Bars: แสดงแถบสีเล็กๆ ด้านล่างจอเพื่อบอกว่าตอนนี้อยู่ใน Session ไหน (Asia, London, NY AM, NY PM, Thai) แทนการถมสีพื้นหลังซึ่งอาจจะรกตา
High/Low Levels & Sweeps: เมื่อจบ Session โปรแกรมจะตีเส้น High และ Low ของช่วงเวลานั้นทิ้งไว้ ถ้ากราฟวิ่งไปชนเส้นเหล่านั้น (Breakout/Sweep) เส้นจะเปลี่ยนเป็นเส้นประและขึ้นข้อความว่า "(Swept)"
1. Indicator Overview and Purpose (ICT/SMC Framework)
This custom Pine Script indicator is designed specifically for traders utilizing ICT (Inner Circle Trader) or SMC (Smart Money Concepts) methodologies. Its primary function is to simplify the analysis of Time & Price by automatically defining and tracking key market sessions, their resulting liquidity levels (High/Low), and detecting liquidity sweeps (Stop Hunts).
The indicator is designed to be Zero-Maintenance regarding time zones, as it automatically adjusts for Daylight Saving Time (DST) changes in major financial centers (London, New York).
2. Key Features and Logic
A. Automatic DST Handling (Auto-DST)
The script uses specific, location-based time zones for global markets instead of a fixed GMT/UTC offset.
Asia: Uses Asia/Tokyo.
London: Uses Europe/London (Automatically adjusts for BST).
New York (AM/PM): Uses America/New_York (Automatically adjusts for EST/EDT).
This guarantees that the session times displayed on your chart (regardless of your local time, e.g., Thailand GMT+7) always align with the actual opening and closing moments of the corresponding financial market.

Viking Wheel Signals — CSP & CC (BB + RSI Confluence)This indicator highlights moments when Bollinger Bands expand while RSI confirms exhaustion, creating high-probability inflection points for Wheel Strategy entries.
When price tags the lower Bollinger Band while RSI is oversold, it often signals ideal zones for selling Cash-Secured Puts (CSPs). When price tags the upper Bollinger Band with RSI overbought, it helps time Covered Calls (CCs) or anticipate when shares may be called away.
Built specifically for the Wheel Strategy (CSP + CC), this tool maps volatility contractions, expansions, and trend shifts. For best results, use on the Daily chart and combine these signals with your own key support/resistance levels to fine-tune strike selection.
Tags: volatility, bollinger bands, rsi, options trading, wheel strategy, confluence, trend analysis

Trend Gazer: Unified ICT Trading System with Signals# Trend Gazer User Guide (English)
## 📖 Table of Contents
1. (#about-this-indicator)
2. (#quick-start-guide-3-steps)
3. (#detailed-usage)
4. (#settings-customization)
5. (#why-combine-multiple-features)
6. (#faq)
---
## About This Indicator
**Trend Gazer** is an integrated trading system designed to read institutional order flow like professional traders.
### 🎯 3 Problems This Indicator Solves
#### ❌ Problem 1: Too Many Indicators = Information Overload
```
Normal: RSI + MACD + Moving Average + Bollinger Bands... → Cluttered chart
Solution: All integrated into ONE indicator → Clean & Clear
```
#### ❌ Problem 2: Single Indicators Give False Signals
```
Normal: Enter based on RSI alone → Frequent stop-outs
Solution: Structure × Zone × Momentum multi-angle confirmation → Higher win rate
```
#### ❌ Problem 3: Unclear Entry Timing
```
Normal: Know the trend but don't know WHERE to enter
Solution: LS Bounce Signal shows EXACT entry points
```
---
## Quick Start Guide (3 Steps)
### 🚀 STEP 1: Confirm Trend Direction
**Look for CHoCH (Change of Character)**
```
📍 (1.CHoCH) label = Uptrend starting
📍 (a.CHoCH) label = Downtrend starting
```
**Important**: Wait for CHoCH! No direction without it.
---
### 🎯 STEP 2: Find Entry Points
**Wait for LS Bounce Signal (green/red labels)**
```
🟢 "Long@ HL only" label → LONG (buy) candidate
🔴 "Short@ LH only" label → SHORT (sell) candidate
```
**Label text color meaning**:
- **White text**: Clean trend (high confidence)
- **Yellow text**: Trend transition (moderate caution)
---
### 🛡️ STEP 3: Final Confirmation with Bar Color
**Bar color shows market state**
```
🔴 Red bar: BUY zone (buying is favored)
🟢 Green bar: SELL zone (selling is favored)
⚪ White bar: Neutral (wait and see)
```
---
## Detailed Usage
### 📊 Understanding the Chart
#### 1. Labels (Market Structure Changes)
```
(1.CHoCH) / (a.CHoCH) : Trend reversal
(2.SiMS) / (b.SiMS) : Momentum confirmation
(3.BoMS) / (c.BoMS) : Trend continuation
```
#### 2. Boxes (Institutional Order Zones)
```
📦 Blue boxes: Bullish OB (buy orders accumulated)
📦 Red boxes: Bearish OB (sell orders accumulated)
📦 Black transparent boxes: Liquidity Sweep
```
**How to use Order Blocks**:
- Function as support/resistance
- Signals within OB have higher reliability
- Use for stop-loss placement
#### 3. Lines (Trends and Support/Resistance)
```
━━━ Red lines: EMA20, EMA50, EMA100 (short to mid-term trends)
━━━ Blue lines: 60min NPR/BB bands (support/resistance)
```
#### 4. Bar Colors (Filter 6)
```
Bar color = Real-time market state
🔴 Red: Buying is favored
🟢 Green: Selling is favored
⚪ White: Neutral
```
---
### 🎯 Practical Trading Flow
#### 📍 Preparation Phase
```
1. Open chart (recommended: 5min or 15min)
2. Add Trend Gazer to chart
3. Start in observation mode (don't enter yet)
```
#### 📍 Entry Decision
```
✅ CHoCH confirms direction → Uptrend starting
✅ LS Bounce Signal "Long@ HL only" appears
→ Entry point candidate
✅ Bar turns red → Market supports buying
→ Entry decision 🎯
✅ Place stop below nearest Order Block (blue box)
```
#### 📍 Exit Decision
```
🔴 Opposite LS Bounce Signal "Short@ LH only" appears
→ Consider taking profit
🔴 Bar turns green
→ Potential trend reversal, review position
🔴 Stop loss hit
→ Exit with loss
```
---
### 💡 Tips for Higher Win Rate
#### ✅ DO's
```
1. Enter AFTER CHoCH appears
2. Prioritize white-text LS Bounce Signals
3. Check higher timeframe (1H or Daily) trend
4. Emphasize signals within Order Blocks
5. Use bar color as final confirmation
```
#### ❌ DON'Ts
```
1. Enter before CHoCH → No clear direction
2. Enter only on yellow text → Unstable transition period
3. Ignore bar color → Trading against market state
4. Don't check Order Blocks → Unclear support/resistance
5. Enter same direction consecutively → Overtrading
```
---
## Settings Customization
### 🔧 How to Open Settings
```
1. Right-click on indicator name on chart
2. Select "Settings..."
3. Settings panel opens
```
---
### 📋 Recommended Setting Profiles
#### 🔰 Beginner Settings (Simple)
**Goal**: Reduce noise, show only important signals
```
【FILTERS】
✅ Bonus Filter: ON
✅ Filter 6 (OB/BB/NPR Zone Filter): ON
❌ Direction Filter: OFF
❌ Liquidation Reversal Filter: OFF
❌ ICT Market Structure Filter: OFF
❌ EMA Trend Filter: OFF
❌ OB/FVG Filter 1: OFF
❌ OB/FVG Filter 2: OFF
【SIGNALS】
✅ Signal 0 (Bonus): ON
✅ Signal 1 (VWC Change): ON
✅ Signal 2 (Liq Rev): ON
❌ Signal 3 (LS): OFF (complex alone)
❌ Signal 4 (LS Break): OFF
❌ Signal 5 (OB+LS NPR): OFF
❌ Signal 6 (OB+LS EMA): OFF
【LS BOUNCE SIGNAL】
✅ Exclude EMA50 from touch detection: OFF
❌ Only show when EMA fills are mixed: OFF
```
**What happens with this setup**:
- Only Bonus (black background) signals display
- LS Bounce Signals clearly visible
- Noisy signals filtered out
---
#### 💪 Intermediate Settings (Balanced)
**Goal**: Enable key filters for better accuracy
```
【FILTERS】
✅ Bonus Filter: ON
✅ Filter 6 (OB/BB/NPR Zone Filter): ON
✅ ICT Market Structure Filter: ON
❌ Direction Filter: OFF
❌ Liquidation Reversal Filter: OFF
❌ EMA Trend Filter: OFF
❌ OB/FVG Filter 1: OFF
❌ OB/FVG Filter 2: OFF
【SIGNALS】
✅ Signal 0 (Bonus): ON
✅ Signal 1 (VWC Change): ON
✅ Signal 2 (Liq Rev): ON
✅ Signal 3 (LS): ON
❌ Signal 4 (LS Break): OFF
❌ Signal 5 (OB+LS NPR): OFF
❌ Signal 6 (OB+LS EMA): OFF
【LS BOUNCE SIGNAL】
✅ Exclude EMA50 from touch detection: OFF
❌ Only show when EMA fills are mixed: OFF
```
**What happens with this setup**:
- Signals only after CHoCH (trend confirmed)
- Filter 6 changes bar colors
- Liquidity Sweeps also displayed
---
#### 🚀 Advanced Settings (Full Utilization)
**Goal**: Master all features
```
【FILTERS】
✅ Bonus Filter: ON
✅ Filter 6 (OB/BB/NPR Zone Filter): ON
✅ ICT Market Structure Filter: ON
✅ Direction Filter: ON
✅ EMA Trend Filter: ON
❌ Liquidation Reversal Filter: OFF (optional)
✅ OB/FVG Filter 1: ON
✅ OB/FVG Filter 2: ON
【SIGNALS】
✅ All ON
【LS BOUNCE SIGNAL】
✅ Exclude EMA50 from touch detection: ON (reduce EMA50 noise)
✅ Only show when EMA fills are mixed: ON (show only transition zones)
```
**What happens with this setup**:
- Fewer signals (precision-focused)
- Multiple confirmations greatly reduce false signals
- Only signals confirmed by trend, momentum, and zones
---
### 🎨 Display Customization
#### Change Label Size
```
【BUY/SELL SIGNAL APPEARANCE】
→ "BUY/SELL Label Size"
→ Choose from: tiny / small / normal / large / huge
Recommended: small (default)
```
#### Order Block Display Settings
```
【ORDER BLOCK (OB) SETTINGS】
✅ Show Current TF OB: Current timeframe OB
✅ Show 1min OB: 1-minute OB
✅ Show 5min OB: 5-minute OB
✅ Show 15min OB: 15-minute OB
Recommended: Only 15min OB ON (simple)
```
#### Liquidity Sweep Display
```
【LIQUIDITY SWEEPS SETTINGS】
→ "Sweep Length": Sensitivity (small=frequent, large=selective)
→ "Sweep Option": Standard / Maximum
Recommended: Length=40, Option=Standard
```
#### NPR/BB Bands Display
```
【NPR (NON-REPAINT STDEV) SETTINGS】
✅ Display 60min NPR Bands: 60-minute support/resistance
❌ Display Current TF NPR Bands: Current timeframe (optional)
Recommended: Only 60min ON
```
---
### ⚙️ Advanced Settings
#### Fine-tune Filter 6
```
【FINAL FILTERS】
→ "Enable Filter 6 (OB/BB/NPR Zone Filter)"
When ON:
- Bars color-coded red/green/white
- Behavior at OB, NPR/BB touches controlled
```
#### LS Bounce Signal Adjustments
```
【LS BOUNCE SIGNAL】
→ "Exclude EMA50 from touch detection"
OFF: Detect NPR/BB/EMA50 (all 3)
ON: Detect NPR/BB only (exclude EMA50)
→ "Only show when EMA fills are mixed"
OFF: Show all LS Bounce Signals
ON: Show only transition zone signals (yellow text)
```
#### MTF (Multi-Timeframe) Control
```
【ORDER BLOCK (OB) SETTINGS】
→ "Disable MTF on 1hr+ Charts"
ON: Disable MTF on 1H+ (save memory)
OFF: MTF enabled on all timeframes
Recommended: ON (unnecessary on larger timeframes)
```
---
### 🎯 Purpose-Based Configuration Guide
#### 🔍 Goal 1: Reduce Signal Count
```
✅ Bonus Filter: ON
✅ ICT Market Structure Filter: ON
✅ Filter 6: ON
✅ All Signals OFF, only Signal 0 ON
```
#### 🔍 Goal 2: Get More Signals
```
❌ All Filters OFF
✅ All Signals ON
```
#### 🔍 Goal 3: Trend Following Only
```
✅ ICT Market Structure Filter: ON
✅ Direction Filter: ON
✅ EMA Trend Filter: ON
```
#### 🔍 Goal 4: Counter-Trend Trading
```
✅ LS Bounce Signal: ON
✅ Filter 6: ON
❌ ICT Market Structure Filter: OFF
```
#### 🔍 Goal 5: Day Trading (5-15min charts)
```
✅ Show 15min OB: ON
✅ Display 60min NPR Bands: ON
✅ LS Bounce Signal: ON
❌ Show 1min/5min OB: OFF
```
#### 🔍 Goal 6: Scalping (1-5min charts)
```
✅ Show 5min OB: ON
✅ Show 15min OB: ON
✅ Display 60min NPR Bands: ON
✅ All Signals: ON
```
---
### 💾 Saving and Loading Settings
#### Save Settings
```
1. Click "..." in top-right of Settings screen
2. Select "Save as default"
→ Same settings auto-applied next time
```
#### Reset Settings
```
1. Click "..." in top-right of Settings screen
2. Select "Reset settings"
→ Return to default settings
```
---
## Why Combine Multiple Features?
### 🎯 Problem: Single Indicator Limitations
Common trader problems:
```
❌ RSI alone → Trade against trend, lose
❌ Moving Average alone → Late entry timing
❌ Support/Resistance alone → Caught by false breakouts
```
**Markets are complex**. One angle isn't enough.
---
### 💡 Solution: Multi-Angle Integrated Approach
#### 1️⃣ Structure × Zone × Momentum
```
📐 Structure (ICT CHoCH)
→ "Which direction is likely?"
📦 Zone (OB/NPR/BB)
→ "Where will price react?"
💨 Momentum (EMA/VWC)
→ "Is there momentum now?"
```
**When all 3 align = Highest win-rate timing**
---
#### 2️⃣ Multi-Timeframe Analysis
```
Big picture: Confirm Daily direction
Medium-term: Check 1H Order Blocks
Short-term: Time entry on 5min
```
**Short-term entries aligned with higher timeframes = Better win rate**
---
#### 3️⃣ Understanding Liquidity
```
🎣 Institutional strategy:
1. Intentionally move price opposite to stop out retail
2. Then, move in real direction
💡 Liquidity Sweep = Visualize this "trap"
→ Read institutional order flow
```
---
### 🧠 Integration Examples
#### Case 1: RSI Alone vs Integrated System
**Scenario**: RSI at 30 (oversold)
```
❌ RSI-only decision:
→ "Buy!"
→ But downtrend continues, loss 😢
✅ Trend Gazer:
CHoCH check → Still downtrend ❌
Order Block → In Bearish OB ❌
LS Bounce → SHORT signal only ❌
→ Skip or SHORT
→ Avoid loss ✅
```
**Result**: Multiple filters block wrong entry
---
#### Case 2: LS Bounce Signal 2-Stage Logic
**Scenario**: Price touches 60min NPR lower band
```
🔍 Traditional method:
Touched → Buy!
→ But price continues down 😢
✅ Trend Gazer:
Stage 1: NPR touch + red bar → Flag ON
Stage 2: EMA20 crosses above EMA50 → Confirm bounce
→ Now "Long@ HL only" displays
→ Entry → Success ✅
```
**Result**: Not just "touch" but "touch + bounce confirmation" improves accuracy
---
### 🎓 Progressive Learning Design
This indicator is designed for **beginners to advanced**:
```
📖 Beginner (Month 1):
Use only CHoCH + LS Bounce Signal
→ Learn trend and entry points
📖 Intermediate (Months 2-3):
Add Order Block + Bar Color
→ Learn support/resistance and filtering
📖 Advanced (Month 6+):
Master all features
→ Read institutional order flow
```
**Ultimate goal**: Indicator becomes confirmation tool. Your market sense becomes primary.
---
### 🔬 Technical Advantages
#### 1. Non-Repaint STDEV (NPR)
```
Normal Bollinger Bands:
→ Past data changes (repaints)
→ Inaccurate backtesting
NPR:
→ Past data doesn't change (non-repaint)
→ Reliable verification possible
```
#### 2. 2-Stage Signal Logic
```
Traditional: Condition met → Immediate signal
→ Many false signals
Trend Gazer: Condition1 → Flag ON → Condition2 → Signal
→ Confirmation step improves accuracy
```
#### 3. Alternating Filter
```
Problem: Same-direction signals spam
→ Overtrading
Solution: LONG → SHORT → LONG alternating only
→ Prevent unnecessary entries
```
---
### 💎 Conclusion: Why Integration?
```
Single indicator = "Partial truth"
Integrated system = "3D market perspective"
```
**Markets are multifaceted**. One angle isn't enough.
Trend Gazer **integrates multiple screens pros watch simultaneously into ONE**,
allowing beginners to read charts with institutional perspective.
---
## FAQ
### ❓ Q1: Which timeframe is best?
**A**: Depends on trading style
```
Scalping: 1min ~ 5min
Day Trading: 5min ~ 15min
Swing: 1H ~ 4H
```
**Important**: LS Bounce Signal only works on 30min and below.
---
### ❓ Q2: Too many signals, confused
**A**: Enable filters
```
【Recommended Settings】
✅ Bonus Filter: ON
✅ Filter 6: ON
✅ ICT Market Structure Filter: ON
→ Show only Signal 0
```
This significantly reduces signal count.
---
### ❓ Q3: No CHoCH appearing, what to do?
**A**: Wait or check higher timeframe
```
Method 1: Wait for CHoCH (recommended)
Method 2: Check higher timeframe (e.g., Daily) for trend
Method 3: Disable ICT Filter (not recommended)
```
**When trend is unclear, sitting out is also strategy**.
---
### ❓ Q4: LS Bounce Signal not appearing
**A**: Checkpoints
```
1. Are you on 30min or below chart?
→ Doesn't show on 1H+
2. Are NPR/BB bands displayed?
→ Check Settings "Display 60min NPR Bands"
3. Is EMA50 excluded?
→ If "Exclude EMA50" is ON, EMA50 signals won't show
```
---
### ❓ Q5: Bar color not changing?
**A**: Check Filter 6
```
Settings → FINAL FILTERS
→ Confirm "Enable Filter 6 (OB/BB/NPR Zone Filter)" is ON
If ON but still not changing:
→ Current price may be outside OB/NPR/BB zones
```
---
### ❓ Q6: Too many Order Blocks, hard to see
**A**: Narrow down displayed OBs
```
Settings → ORDER BLOCK (OB) SETTINGS
Recommended:
❌ Show Current TF OB: OFF
❌ Show 1min OB: OFF
❌ Show 5min OB: OFF
✅ Show 15min OB: ON (only this)
```
---
### ❓ Q7: How to improve win rate?
**A**: Thorough multiple confirmations
```
Checklist:
✅ CHoCH appeared
✅ LS Bounce Signal (white text)
✅ Bar color matches (red bar=LONG, green bar=SHORT)
✅ Signal within Order Block
✅ Aligns with higher timeframe trend
Enter ONLY when all align
```
---
### ❓ Q8: Want to practice on demo
**A**: Recommended practice method
```
Week 1: Observation only
→ Watch signals and chart movement
→ Resist entering
Weeks 2-3: Keep records
→ Screenshot when signal appears
→ Record subsequent movement
Week 4+: Start demo trading
→ Start with small amounts
→ Continue keeping records
```
---
### ❓ Q9: Are there alert features?
**A**: Yes, multiple alerts available
```
Setup method:
1. Right-click indicator on chart
2. Select "Add Alert..."
3. Choose from:
- ANY ALERT: BUY/SELL Signals
- BUY ONLY ALERT
- SELL ONLY ALERT
- MS UP / MS DOWN
- BAR COLOR: RED / LIME
- LS BOUNCE: LONG / SHORT Signal
```
---
### ❓ Q10: Works on other markets?
**A**: Yes, works on all markets
```
✅ Cryptocurrency (BTC, ETH, etc.)
✅ Forex (EUR/USD, USD/JPY, etc.)
✅ Stocks (individual stocks, indices)
✅ Futures (oil, gold, etc.)
```
Works on any market with price and volume data.
---
## 📋 Disclaimer
### ⚠️ Important Notice
This indicator is for **educational and informational purposes only**.
```
❌ NOT investment advice
❌ Does NOT guarantee profits
❌ Past results do NOT guarantee future performance
```
### Risk Warning
```
⚠️ Trading involves substantial risk
⚠️ Only trade with funds you can afford to lose
⚠️ Practice extensively on demo account before live trading
⚠️ Make your own informed decisions and act at your own risk
```
---
## 📞 Support
### Feedback & Questions
Feel free to ask questions in TradingView comments section.
### Bug Reports
Please report with specific details (timeframe, symbol, screenshots).
---
**Author**: rasukaru666
**License**: Mozilla Public License 2.0
**Last Updated**: December 2025
**Version**: Latest
---
**Thank you for using Trend Gazer!**
**Happy Trading! 📈**
---------------

X FP Imbalancesprovides advanced volume profile analysis by isolating and visualizing market aggression at a granular price level. It is a powerful tool for short-term and intraday traders seeking objective confirmation of supply and demand dynamics, primarily used to identify high-probability reversal or continuation points based on order flow principles.
Key Functionality and Methodology
The indicator operates by transforming standard time-based candle data into a Volume-at-Price footprint, focusing specifically on aggressive market activity.
Granular Aggression Measurement (Delta)
The script dynamically segments the price range into discrete price levels (tickAmount). This granularity is controlled either by a user-defined fixed tick count or automatically adjusted using the Average True Range (ATR) to adapt the box size to current market volatility.
The script uses lower timeframe data (e.g., 1-minute bars) to accurately distribute the total volume into each price level, distinguishing between aggressive buying (Up Volume) and aggressive selling (Down Volume).
The core output is Delta, which is the net difference between aggressive buying and aggressive selling at each price level.
Stacked Imbalance Identification
The indicator identifies an imbalance when the volume from one side (e.g., aggressive buyers) overwhelms the total volume at that level by a user-defined percentage (imbalanceP).
A single price level where the Delta percentage exceeds the threshold is defined as an Imbalance.
The Stacked Imbalance is the primary signal, triggered when the imbalance is detected on a user-defined number of consecutive price levels (stacked) in the same direction (e.g., 3 consecutive levels of aggressive buying). This signals a high-conviction structural break or strong rejection.
Stacked imbalances are visually highlighted and can trigger real-time alerts upon bar close.
Strategic Applications
This indicator is invaluable for traders who integrate order flow concepts into their decision-making process.
One-Sided Stack (Supply/Demand Zone): Aggressive selling (Red Stack) at a high price, followed by price reversal, identifies a Structural Supply Zone (Resistance). The level is where sellers aggressively rejected demand, leaving an untested area of supply.
Overlapping Stacks (Climax Reversal): Consecutive Buy Stacks followed immediately by Sell Stacks in a tight range signals Buyer Exhaustion and an immediate Climax Reversal. The buying power was absorbed and instantly overwhelmed by waiting supply.
Absence of Stack: When price moves sharply through a level without creating any Stacked Imbalances, it suggests an Orderly Move or Liquidity Void. The absence of resistance means the market move is structurally weak and often vulnerable to a retest.
The choice between a Fixed Tick Distance (for micro-pattern precision) and ATR-based sizing (for volatility-adjusted analysis) allows the user to tailor the indicator to specific asset classes and trading styles.

IMPORTANT Levels by SBImportant levels by SB based on gann levels.One can plot these levels once on the chart and can work on these levels .When ever market market come at any of these levels .User can wait for the price action and accordingly user can get inside the trade
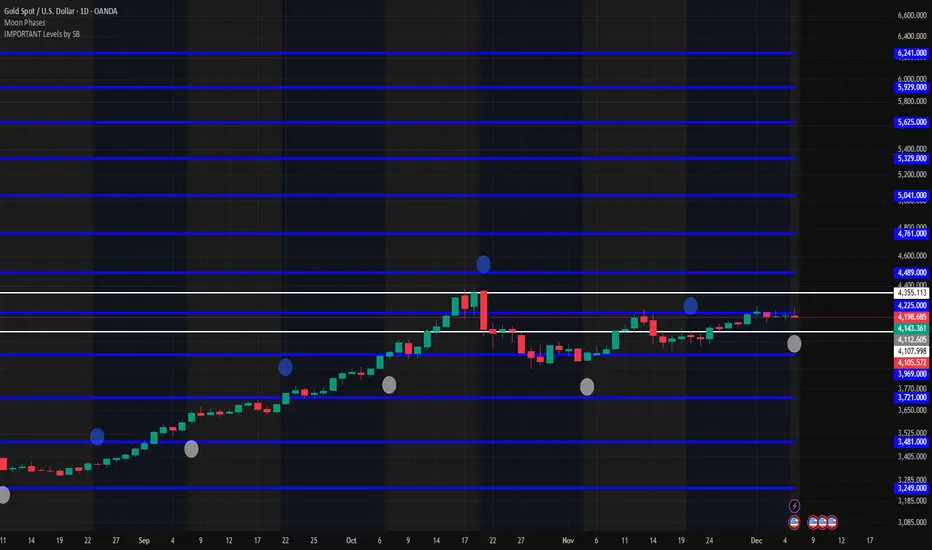
RSI For Loop
RSI For Loop – Enhanced RSI Dominance Oscillator
Original concept & innovation ©@viResearch
Enhanced version with historical-comparison loop, median-based statistical strength bands, asymmetric thresholds, and visual upgrades
Core Concept (viResearch)
viResearch was the first to introduce the groundbreaking idea of replacing traditional fixed RSI levels with a loop-based scoring system that evaluates RSI behavior across a defined range, creating a dynamic, self-normalizing momentum score that dramatically reduces false signals in trending markets.
Key Enhancements in This Version
I kept the core brilliance of viResearch's loop concept but completely rewrote the scoring mechanism to make it even more powerful and adaptive:
1. Historical Dominance Comparison
The loop directly compares the current RSI value to the actual RSI values of the previous 1–99 bars (user-adjustable).
→ +1 for every past bar the current RSI beats
→ –1 for every past bar it loses to
This transforms the indicator into a true RSI Dominance / Percentile-Rank oscillator that instantly shows whether current momentum is stronger or weaker than nearly all recent history – perfectly adaptive to any market regime, volatility level, or asset.
2. Median + 3σ Statistical Strength Bands
Added a rolling median of the dominance score plus dynamic ±3σ bands calculated from the RSI score median standard deviation.
These bands identify genuinely extreme momentum phases (statistically rare events) that only occur during the strongest momentum or capitulation moves – giving high-conviction confirmation.
3. Visual & Practical Upgrades
- Clean bar/candle coloring
- On-chart triangle signals at trend changes
- Diamond stepline ±3σ bands
- Built-in alerts for both trend changes and extreme strength phases
- 9 professional color themes
How to Use It
Primary Trend Signals
- Green triangle + bullish bar color → New bullish momentum regime (score crosses above +15)
- Magenta triangle + bearish bar color → New bearish momentum regime (score crosses below –28)
These are some of the cleanest trend-change signals you will ever see – especially powerful on daily/weekly charts.
Extreme Strength Confirmation
Score breaks above the upper 3σ diamond line → Exceptional bullish strength/dominance (add to longs, strength behind the asset)
Score breaks below the lower 3σ diamond line → Exceptional bearish strength/dominance (capitulation or weakness)
These are rarer, very high-probability zones.
Zero-Line Context
Above zero = current RSI stronger than average recent history
Below zero = weaker than average recent history
Near zero = choppy/range-bound (stay out or mean-reversion trade)
Recommended Settings
RSI Length: 46
Loop range: 1 to 99 (~3–6 months on daily)
Long Threshold: +15
Short Threshold: –28
Median Length: 225
SD Length: 60
Works on all assets and timeframes. Absolutely deadly on daily/weekly for swing and position trading, and still excellent on 4H/30min for crypto/stocks.
This enhanced version honors viResearch's original genius while improving on it with true historical comparison and statistical extreme detection – delivering what is, in my opinion, one of the cleanest and most powerful momentum/trend indicators available on TradingView.
Backtests are based on past results and are not indicative of future performance.

3-Bar Inversion Pattern (Entry & Invalidation Levels)Very simple 3-bar inversion pattern looking for a bar that extends in the previous bar's direction, bar 2 having a body no bigger than 50% of bar 1's. and Bar 3 having a body close beyond the open of bar 1. Invalidation is set to the highest point of the 3 par pattern.

Relative Strength Line by QuantxThe Relative Strength Line compares the price performance of a stock against a benchmark index (e.g., NIFTY, S&P 500, Bank Nifty, etc.).
It does not indicate momentum of the stock itself — it indicates whether the stock is outperforming or underperforming the market.
🔍 How To Read It
RSL Behavior Meaning
RSL moving up Stock is outperforming the benchmark (strong leadership)
RSL moving down Stock is underperforming the benchmark (weakness vs market)
RSL breaking above previous highs Strong institutional demand, leadership candidate
RSL trending sideways Stock is performing similar to the index (no leadership)
📈 Why It Matters
Institutional traders and top-performing strategies focus on stocks showing relative strength BEFORE price breakout.
A stock making new RSL highs even before a price breakout often becomes a top performer in the coming trend.
🧠 Core Trading Edge
You don’t need to predict the market.
Just identify which stocks are being accumulated and leading the market right now — that’s what the Relative Strength Line reveals.
