,,,//@version=5
indicator(title='Moving Average Exponential', shorttitle='EMA', overlay=true, timeframe='')
len = input.int(6, minval=1, title='Length')
len1 = input.int(13, minval=1, title='Length')
len2 = input.int(24, minval=1, title='Length')
len3 = input.int(55, minval=1, title='Length')
src = input(close, title='Source')
offset = input.int(title='Offset', defval=0, minval=-500, maxval=500)
out = ta.ema(src, len)
out1 = ta.ema(src, len1)
out2 = ta.ema(src, len2)
out3 = ta.ema(src, len3)
plot(out, title='EMA', color=color.new(color.yellow, 0), offset=offset)
plot(out1, title='EMA1', color=color.new(color.blue, 0), offset=offset)
plot(out2, title='EMA2', color=color.new(color.red, 0), offset=offset)
plot(out3, title='EMA2', color=color.new(#19e82a, 0), offset=offset)
Göstergeler ve stratejiler

Market Internals Dashboard: Trend, Breadth, Volume PressureOverview
The Market Internals Dashboard Pro is a professional-grade toolkit modeled after what prop firms and institutional desks use to understand real intraday market conditions.
Instead of relying solely on price, this indicator analyzes three critical internal forces:
USI:TICK : Microstructure buying/selling pressure
USI:ADD : Market breadth participation (advancers vs decliners proxy)
USI:VOLD : Volume pressure (buying vs selling volume)
These internals determine whether the market is:
Trending or ranging
Bullish or bearish
Likely to follow through or mean-revert
Favoring continuation trades or fade setups
The script also produces a Market Environment Score (–3 to +3) and a real-time Trade Recommendation Table that updates every bar. This helps answer the single most important question in intraday trading: “What type of trades should I be taking right now given current market conditions?”
1. TICK Proxy: Microstructure Pressure
Measures buying vs. selling aggressiveness across the market This proxy simulates the NYSE TICK index by evaluating whether bars close above or below the prior bar.
Positive TICK → Buyers lifting offers
Negative TICK → Sellers hitting bids
Neutral TICK → No microstructure conviction
Why it matters:
Strong TICK is often the earliest sign of:
Trend initiation
Algorithmic buy/sell programs
Shifts in short‑term sentiment
Weak or choppy TICK often signals:
Range conditions
Failed breakouts
Low‑quality trend attempts
2. ADD Proxy: Market Breadth Strength
Shows how many stocks are participating in a move Because real USI:ADD data isn't available for all users, this script uses a self-contained breadth approximation built from:
Price slope
Volatility expansion
Volume‑weighted directional pressure
Why it matters? Breadth reveals whether the move is:
Broad and healthy → likely to continue
Narrow and weak → vulnerable to reversal
Strong trends require strong breadth. Weak breadth often precedes:
Failed breakouts
Reversal setups
Chop (ewww)
3. VOLD Proxy: Volume Pressure
The most important internal of all. This proxy measures whether trading volume is flowing into up bars or down bars.
Positive VOLD → Net buying pressure
Negative VOLD → Net selling pressure
Why it matters:
VOLD is considered the "truth serum" of the tape:
Strong VOLD drives trend days
Negative VOLD kills long setups
Mixed VOLD creates chop
You should rarely trend trade against VOLD.
4. Market Environment Score (–3 to +3)
The Environment Score combines the three internals into a single view:
|| Score || Interpretation || Market Type ||
| +3 | Strong Bull | Trend Day (Long) |
| +2 | Bull | Pullback Buys / Breakout Continuation |
| +1 | Mild Bull | Conservative Long Scalps |
| 0 | Neutral | CHOP – VWAP Reversions / Fades |
| -1 | Mild Bear | Short Failed Breakouts |
| -2 | Bear | Trend Shorts / Breakdown Continuation |
| -3 | Strong Bear | Trend Day (Short) |
Why it matters:
The market behaves differently depending on internal alignment. This score prevents traders from:
Forcing trend trades on chop days
Chasing breakouts when breadth is weak
Fading strong directional days
It tells you in real time whether conditions favor:
Trend following
Mean reversion
Breakout continuation
Liquidity grabs
Or sitting out
5. Trade Recommendation Engine
Based on the Environment Score, the indicator outputs a real-time playbook recommending which trade types have the highest probability of success right now.
Examples:
Score = 0 (Neutral)
VWAP Reversions
Liquidity Grabs
Failed Breakouts
Quick Scalps
Score = +2/+3 (Strong Bull)
Pullback Buys
Breakout Continuation
Trend Longs
Score = -2/-3 (Strong Bear)
Pullback Shorts
Breakdown Continuation
Trend Shorts Only
This turns the internals into a trade selection engine, not just a data display.
Why Market Internals Matter
Most indicators look only at price, but price is the result, not the cause.
Market internals show:
Where volume is flowing
Whether buying is aggressive or passive
How many stocks are participating
Whether algorithms are supporting or fighting the move
This dashboard helps traders:
Avoid chop
Stay out of low‑quality setups
Time entries with institutional flows
Improve win rate by trading the right setups at the right times
Final Notes
Works on any symbol or timeframe
Fully customizable colors
Two clean visual tables: Internals + Trade Playbook
Ideal for futures, ETFs, and options day traders
If you enjoy this tool, please like, comment, or follow. More enhancements are coming.
Trade smart.

Titan AI: Smart MFI OscillatorTitan AI: Smart MFI Oscillator is not your standard Momentum indicator. It is a next-generation Hybrid Intelligence Engine designed to detect the true state of market liquidity. Unlike traditional oscillators that rely on static levels (like 80/20), Titan AI employs an Unsupervised Learning Algorithm (K-Means Clustering)** to adaptively classify Money Flow in real-time.
This indicator is built for traders who need to filter out noise and see the structural reality of the market. It answers the critical question: "Is the market actually trending with volume, or is it stuck in equilibrium?"
With the integrated "Smart MFI (INFO)" Dashboard, you get a tactical Heads-Up Display (HUD) that stabilizes complex volatility data into clear, institutional signals.
💎 Key Features
1. Adaptive AI Brain (K-Means Clustering):
Standard oscillators fail because they don't adapt to volatility changes. Titan AI solves this by running a clustering algorithm on historical data to define dynamic "Overbought" and "Oversold" zones.
- Result: The indicator "breathes" with the market, providing accurate signals in both low-volatility ranges and high-volatility trends.
2. Institutional Flow Classification:
The core logic doesn't just measure ups and downs; it classifies the **Money Flow Index (MFI)** into three institutional states displayed on the panel:
- 🟢 ACCUMULATION: Strong buying pressure detected (Smart Money Entry).
- 🔴 DISTRIBUTION: Strong selling pressure detected (Smart Money Exit).
- ⚪ EQUILIBRIUM: The market is balanced/ranging. (No Edge).
3. Visual Histogram & Whale Detector:
- Classic Flow: Green/Red bars for buying/selling pressure.
- 🐋 WHALE ACTIVITY (White Bars): The histogram turns WHITE when current volume exceeds 200% of the average**. This visually confirms that big players (Whales) are driving the price movement.
4. "Squeeze" & Extreme Blocks:
- Orange Blocks: These appear when momentum is statistically overextended. In a strong trend, this indicates a **"Turbo Zone"**. In a weak market, it signals imminent exhaustion.
- Peak Circles: Visual markers for potential tops and bottoms based on adaptive band crosses.
5. Smart MFI (INFO) Dashboard (HUD):
A professional panel fixed to your screen that uses Confirmed Data to prevent repainting.
- Trend: Macro direction (EMA 200).
- Momentum (AI): Immediate impulse direction.
- Flow (AI): The exact institutional state + numeric value.
🚀 How to Use
1. Trend Following (The Flow)
- Long Setup: Wait for the Dashboard to show TREND: BULLISH and FLOW: ACCUMULATION. Enter when the histogram is Green or White (Whale Volume).
- Short Setup: Wait for TREND: BEARISH and FLOW: DISTRIBUTION. Enter when the histogram is Red or White.
2. Trading Reversals (The Extremes)
- Exhaustion: If you see Orange Blocks followed by a Circle/Triangle, the move is overextended.
- Execution: Do not fade the move immediately. Wait for the Dashboard's Momentum to flip (e.g., from Bullish to Bearish) to confirm the reversal.
3. Filtering Noise (The Smart Filter)
- If the Dashboard says FLOW: EQUILIBRIUM (Grey), volatility is dead. Stay out of the market or wait for a breakout confirmed by an Accumulation/Distribution signal.
⚙️ Settings
- AI Training Data: Adjusts how much historical data the K-Means algorithm uses (Default: 300).
- Visuals: Toggle the classic Money Flow Histogram, Divergence Lines, or the Dashboard itself.
- Positions: You can move the panel to any corner of the chart.
⚠️ Disclaimer
This tool is for educational and analytical purposes only. Trading involves significant risk. Always use proper risk management. Past performance does not guarantee future results. BINANCE:BTCUSDT.P

BTC – LEVR: Leverage Efficiency & Volume RatioLEVR: Leverage Efficiency & Volume Ratio
Observation-only. Data: IntoTheBlock.
Overview
The Leverage Efficiency & Volume Ratio (LEVR) is a market structure oscillator designed to detect "Paper Bubbles" and "Organic Bottoms" by separating speculative greed from network utility. While most indicators analyze price action, LEVR analyzes market fragility. It operates on the thesis that Sustainable Rallies are driven by Spot/Network Activity, while Fragile Rallies are driven by Derivatives Leverage.
Synergy
How it works with VERI
LEVR is designed to be the tactical counterpart to the fundamental VERI Indicator (Valuation & Entity Ratio Index).
Use VERI for Strategy: To identify Value. (Is Bitcoin cheap? Are Whales buying?)
Use LEVR for Risk: To identify Structure. (Is the current price move real, or is it a leverage bubble about to pop?)
The "Perfect Setup"
The strongest buy signals occur when VERI is in the Accumulation Zone (Whales buying) AND LEVR is in the Organic Zone (Leverage is flushed out) (as it was the case in the Dec 2022 Bear Market Bottom).
Why LEVR is Unique
Standard indicators often fail to contextualize Open Interest:
vs. Raw Open Interest: Raw OI always trends up over time as the market grows. LEVR solves this by normalizing OI against Active Addresses. This reveals when leverage is outpacing actual adoption.
vs. ELR (Estimated Leverage Ratio): Classic ELR divides Open Interest by Exchange Reserves. However, Exchange Reserves are notoriously difficult to track accurately. LEVR uses Active Addresses (Network Utility) as a cleaner, more reliable denominator for network health.
Methodology
The Mathematics: The indicator calculates a normalized Z-Score ratio between two IntoTheBlock datasets:
The Numerator (Greed): Perpetual Open Interest. The total dollar value of all open futures contracts. This represents the "Gambling" capital.
The Denominator (Utility): Active Addresses. The number of unique addresses transacting on-chain. This represents the "Real" user base.
The Formula : LEVR = Z-Score ( Perpetual Open Interest / Active Addresses )
How to Interpret the Visuals
The line color changes dynamically to reflect the current risk regime:
🟥 Speculative Premium (Red Line > 2.0) :
Signal: "Leverage Bubble."
Context: Open Interest is rising significantly faster than User Growth. The rally is fueled by debt.
Risk: High probability of a "Long Squeeze" or liquidation cascade.
🟦 Organic Base (Blue Line < -1.5) :
Signal: "Spot Driven Market."
Context: Speculators have been flushed out, but active network usage remains high. The line turns Blue to signal a healthy opportunity zone.
Risk: Low. Historically marks robust bottoms where hands are strong.
🟧 Neutral (Orange Line) :
The market is in a transition phase between organic growth and speculation.
Settings & Inputs
Users can customize the sensitivity of the Z-Score to fit their trading style (in brackets their current standard value):
Lookback Period (365) : The rolling window used to establish the "Baseline." A 365-day window captures the yearly trend.
Signal Smoothing (7) : A short moving average to reduce daily data noise.
Bubble Zone Top/Bottom (3.0 / 2.0) : The thresholds for the Red Zone. Raising the "Top" value will only show the most extreme, generational leverage bubbles.
Organic Zone Top/Bottom (-1.5 / -2.5) : The thresholds for the Green Zone. Lowering these values requires a deeper "flush" to trigger a signal.
Optimization
This indicator is mathematically optimized for the Daily (1D) timeframe. Using it on lower timeframes may result in noise due to the daily resolution of on-chain data.
Important Note on Historical Data
Please be aware that aggregated global Perpetual Open Interest data only becomes reliable and widely available starting around 2020-2021.
Pre-2021: The indicator will show a flat line or empty values. This is not a bug; it reflects the lack of historical derivatives market data for that period.
2021-Present: The indicator functions fully as intended.
Credits
Concept inspired by the "Estimated Leverage Ratio" (ELR) popularised by CryptoQuant and analysts like Willy Woo. LEVR adapts this concept for TradingView by substituting Exchange Reserves with Network Activity for better reliability.
Disclaimer
This tool is for research purposes only. It visualizes market structure data and does not constitute financial advice.
Tags
bitcoin, btc, open interest, leverage, on-chain, intotheblock, risk, derivatives, levr, veri

S&P Options Patterns Detector (6-20 Candles)Pattern detector for S&P options. Detects alerts for bullish or bearish signals for any stock in S&P 500

Session important reference linesThis indicator automatically plots crucial price reference points for the Regular Trading Hours (RTH) session, including Yesterday's High/Low/Close, Session Open, Midpoint, and the Initial Balance (IB) range with its 2x extension .
In the example above the lines are:
Dotted green - Today's open price
Dashed yellow - Today's mid line
Solid yellow - Initial Balance high/low
Dotted yellow - Initial Balance extension
Dotted dark green - Previous session high
Dotted dark red - Previous session low
Dotted orange - Previous session close

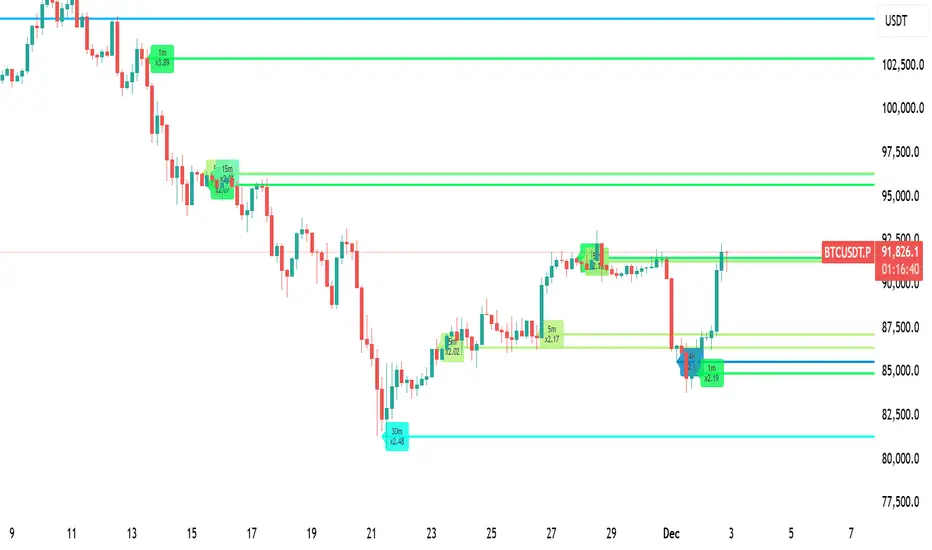
LiquidityPulse Multi-Timeframe Volume Zones/ LevelsLiquidityPulse Multi-Timeframe Volume Zones/ Levels
Non-repainting: levels appear on bar close and do not change.
What This Indicator Does
This indicator scans lower-timeframe price action to identify bars where volume and candle behaviour suggest that a notable price interaction occurred. When all conditions align, the script extracts a precise price level from that bar, plots it on your higher-timeframe chart, and extends it forward so you can observe whether the market interacts with it again later.
Each selected timeframe is processed independently. For every timeframe you enable, the script looks for the following criteria:
1. A shift in candle direction between the previous bar and the current bar
2. A close-to-open body alignment , helping filter out irregular or noisy movement
3. A volume increase relative to the recent average , based on a user-selected multiplier
If these conditions are met, the script marks the corresponding price level on the chart. You can enable up to seven lower timeframes at once, each with its own independent settings, colours, strength filters, and display capacity. This allows you to build a layered, multi-timeframe view of the levels/ zones.
How It Works
1. Candle Behaviour Shift
The script checks whether the previous bar and the current bar show opposing directional behaviour. This helps highlight moments that may reflect a shift in directional behaviour or a change in price movement characteristics.
2. Body Alignment
The previous bar’s close must closely align with the current bar’s open. This requirement reduces random noise and focuses detection on areas where structure between candles is unusually clean.
3. Volume Requirement
The combined volume of the current bar and the previous bar must exceed the recent average by a multiplier you choose.
Lower multiplier - more levels
Higher multiplier - only the most significant activity spikes qualify
This filters for bars with above-average participation (volume).
4. Price Level Identification
If all conditions are met, a price edge is defined:
Bearish pressure: upper edge
Bullish pressure: lower edge
This edge marks the price level where the qualifying candle behaviour occurred.
5. Zone Drawing
Each qualifying event produces:
A horizontal line marking the level
A (optional) shaded box around the level
A label showing the timeframe and the exact volume multiplier amount detected
The level then extends forward so you can monitor future interactions.
Key Settings
Zone Strength (Volume Multiplier)
Determines how selective the volume filter is.
Lower settings show more frequent activity
Higher settings restrict detection to only the strongest activity (volume) increases
Multi-Timeframe Framework
Enable/disable per timeframe
Custom source timeframe (e.g., 1m, 5m, 15m, etc.)
Strength threshold per timeframe
How many recent levels to display per timeframe (Show Last N Zones.)
You can display a single timeframe or stack several to highlight clustering.
How traders can use this indicator
This script is not a buy/sell signal generator. It is best used as a structural overlay that helps you identify:
Where candle behaviour abruptly shifted with increased volume
Whether multiple timeframes highlight similar levels
Comparing how frequently these conditions appear across different timeframes
How price behaves when revisiting areas of prior activity (levels)
Why this type of detection can be informative
Higher-timeframe charts compress a large amount of lower-timeframe activity. By identifying where the script found notable changes in direction, structure, and relative volume on a lower timeframe, it provides a way to reference points in the price history where behaviour differed from nearby bars. Displaying these levels on a higher timeframe allows traders to see how these conditions align with their broader analysis.
Disclaimer
This indicator does not measure true liquidity or order flow. It uses candle structure and relative-volume comparisons as interpretive tools, and the plotted levels do not represent signals or predictions. All analysis is user-interpreted, and past behaviour does not imply future behaviour.
FUSED 9.5 INSTITUTIONAL [FINAL] - AgTradezInstitutional style Indicator that gives you trend direction, MSS, with Tp levels and much more.

BTC Price Prediction Model [Global PMI]V2🇺🇸 English Guide
1. Introduction
This indicator was created by GW Capital using Gemini Vibe Coding technology. It leverages advanced AI coding capabilities to reconstruct complex macroeconomic models into actionable trading tools.
2. Credits
Special thanks to the original model author, Marty Kendall. His research into the correlation between Bitcoin's price and macroeconomic factors lays the foundation for this algorithm.
3. Model Principles & Formula
This model calculates the "Fair Value" of Bitcoin based on four key macroeconomic pillars. It assumes that Bitcoin's price is a function of Global Liquidity, Network Security, Risk Appetite, and the Economic Cycle.
💡 Unique Insight: PMI & The 4-Year Cycle
A key distinguishing feature of this model is the hypothesis that Bitcoin's famous "4-Year Halving Cycle" may be intrinsically linked to the Global Business Cycle (PMI), rather than just supply shocks.
Therefore, the model incorporates PMI as a valuation "Amplifier".
Note: Due to TradingView data limitations, US PMI is currently used as the proxy for the global cycle.
The Formula
$$\ln(BTC) = \alpha + (1 + \beta \cdot PMI_{z}) \times $$
Global Liquidity (M2): Sum of M2 supply from US, China, Eurozone, and Japan (converted to USD). Represents the pool of fiat money available to flow into assets.
Network Security (Hashrate): Bitcoin's hashrate, representing the physical security and utility of the network.
Risk Appetite (S&P 500): Used as a proxy for global risk sentiment.
Economic Cycle (PMI Z-Score): US Manufacturing PMI is used to amplify or dampen the valuation based on where we are in the business cycle (Expansion vs. Contraction).
4. How to Use
The indicator plots the Fair Value (White Line) and four sentiment bands based on statistical deviation (Z-Score).
Sentiment Zones
🚨 Extreme Greed (Red Zone): Price > +0.3 StdDev. Historically indicates a market top or overheated sentiment.
⚠️ Greed (Orange Zone): Price > +0.15 StdDev. Bullish momentum is strong but caution is advised.
⚖️ Fair Value (White Line): The theoretical "correct" price based on macro data.
😨 Fear (Teal Zone): Price < -0.15 StdDev. Undervalued territory.
💎 Extreme Fear (Green Zone): Price < -0.3 StdDev. Historically a generational buying opportunity.
Sentiment Score (0-100)
100: Maximum Greed (Top)
50: Fair Value
0: Maximum Fear (Bottom)
5. Usage Recommendations
Timeframe: Daily (1D) or Weekly (1W) ONLY.
Reason: The underlying data sources (M2, PMI) are updated monthly. The S&P 500 and Hashrate are daily. Using this indicator on intraday charts (e.g., 15m, 1h, 4h) adds no value because the fundamental data does not change that fast.
Long-Term View: This is a macro-cycle indicator designed for identifying cycle tops and bottoms over months and years, not for day trading.
6. Disclaimer
This indicator is for educational and informational purposes only. It does not constitute financial advice. The model relies on historical correlations which may not hold true in the future. All trading involves risk. GW Capital and the creators assume no responsibility for any trading losses.
7. Support Us ❤️
If you find this indicator useful, please Boost 👍, Comment, and add it to your Favorites! Your support keeps us going.
🇨🇳 中文说明 (Chinese Version)
1. 简介
本指标由 GW Capital 使用 Gemini Vibe Coding 技术制作。利用先进的 AI 编程能力,将复杂的宏观经济模型重构为可执行的交易工具。
2. 致谢
特别感谢模型原作者 Marty Kendall。他对这一算法的研究奠定了基础,揭示了比特币价格与宏观经济因素之间的深层联系。
3. 模型原理与公式
该模型基于四大宏观经济支柱计算比特币的“公允价值”。它假设比特币的价格是全球流动性、网络安全性、风险偏好和经济周期的函数。
💡 独家洞察:PMI 与 4年周期
本模型的一个核心独特之处在于:我们认为比特币著名的“4年减半周期”背后的真正驱动力,可能与全球商业周期 (PMI) 高度同步,而不仅仅是供应减半。
因此,模型特别引入 PMI 作为估值的“放大器” (Amplifier)。
注:由于 TradingView 数据源限制,目前采用历史数据最详尽的美国 PMI 作为全球周期的代理指标。
模型公式
$$\ln(BTC) = \alpha + (1 + \beta \cdot PMI_{z}) \times $$
全球流动性 (M2): 美、中、欧、日四大经济体的 M2 总量(折算为美元)。代表可流入资产的法币资金池。
网络安全性 (Hashrate): 比特币全网算力,代表网络的物理安全性和实用价值。
风险偏好 (S&P 500): 作为全球风险情绪的代理指标。
经济周期 (PMI Z-Score): 美国制造业 PMI 用于根据商业周期(扩张 vs 收缩)来放大或抑制估值。
4. 指标用法
指标会在图表上绘制 公允价值 (白线) 以及基于统计偏差 (Z-Score) 的四条情绪带。
情绪区间
🚨 极度贪婪 (红色区域): 价格 > +0.3 标准差。历史上通常预示市场顶部或情绪过热。
⚠️ 一般贪婪 (橙色区域): 价格 > +0.15 标准差。多头动能强劲,但需谨慎。
⚖️ 公允价值 (白线): 基于宏观数据的理论“正确”价格。
😨 一般恐惧 (青色区域): 价格 < -0.15 标准差。进入低估区域。
💎 极度恐惧 (绿色区域): 价格 < -0.3 标准差。历史上通常是代际级别的买入机会。
情绪评分 (0-100)
100: 极度贪婪 (顶部)
50: 公允价值
0: 极度恐惧 (底部)
5. 使用建议
周期: 仅限日线 (1D) 或周线 (1W)。
原因: 底层数据源(M2, PMI)是月度更新的。标普500和算力是日度更新的。在日内图表(如15分钟、1小时、4小时)上使用此指标没有任何意义,因为基本面数据不会变化得那么快。
长期视角: 这是一个宏观周期指标,旨在识别数月甚至数年的周期顶部和底部,而非用于日内交易。
6. 免责声明
本指标仅供教育和参考使用,不构成任何财务建议。该模型依赖于历史相关性,未来可能不再适用。所有交易均涉及风险。GW Capital 及制作者不对任何交易损失承担责任。

Opcje: Sugestia Strike'ów (HV Based)How to interpret this script?
1. Dotted Lines:
Red (Upper): The price level above which the asset is statistically unlikely to rise within X days. This is where you look for a Strike Price to sell a CALL option (Short Call).
Green (Lower): The price level below which the asset is statistically unlikely to fall. This is where you look for a Strike Price to sell a PUT option (Short Put).
2. Sigma Multiplier (Important!):
The default setting is 2.0. This represents 2 Standard Deviations.
In a normal distribution, 2 standard deviations cover approximately 95% of outcomes.
This means you theoretically have a 95% probability that the option will expire worthless (meaning you keep the full premium), but the premium received will be lower.
If you change it to 1.0, you will be closer to the current price = higher premium, but the risk of assignment (exercise) increases to about 32%.
3. DTE (Days to Expiration):
Enter the actual number of days for the option you intend to sell (e.g., 45). The script will calculate where the price might be in 45 days based on current volatility.

ADX with 20 ThresholdI wanted an ADX with a threshold line so I created an indicator.
ADX (20 Threshold) Cheat-Sheet
Purpose: Filter trades by trend strength.
Indicator: ADX (derived from DMI) with optional +DI/−DI lines.
Key Rules:
ADX > 20: Trend is strong → trade OK
ADX < 20: Trend is weak/choppy → avoid trades
Optional +DI / −DI: Shows momentum direction
HTF Use: Stable trend confirmation
LTF Use: Optional filter with EMA slope for entries
Tips:
Combine with EMAs or MACD for directional bias.
ADX does not indicate direction, only strength.
Best used to avoid low-probability trades in sideways markets.

Global M2(USD) V2This indicator tracks the total Global M2 Money Supply in USD. It aggregates economic data from the world's four largest central banks (Fed, PBOC, ECB, BOJ). The script automatically converts non-USD money supplies (CNY, EUR, JPY) into USD using real-time exchange rates to provide a unified view of global liquidity.
Usage
Macro Analysis: Overlay this on assets like Bitcoin or the S&P 500 to see if price appreciation is driven by fiat currency debasement ("money printing").
Liquidity Trends: A rising orange line indicates expanding global liquidity (generally bullish for risk assets), while a falling line suggests monetary tightening.
Real-time Data: A label at the end of the line displays the exact raw total in USD for precise tracking.
该脚本旨在追踪以美元计价的全球 M2 货币供应总量。它聚合了四大央行(美联储、中国央行、欧洲央行、日本央行)的经济数据,并通过实时汇率将非美货币(人民币、欧元、日元)统一折算为美元,从而构建出一个标准化的全球流动性指标。
用法
宏观对冲: 将其叠加在比特币或股票图表上,用于判断资产价格的上涨是否由全球法币“大放水”推动。
趋势研判: 橙色曲线向上代表全球流动性扩张(通常利好风险资产),向下则代表流动性紧缩。
数据直观: 脚本会在图表末端生成一个标签,实时显示当前全球 M2 的具体美元总额。

MA + ATR Channel V2This script creates a dynamic volatility channel (similar to a Keltner Channel). It plots a central Moving Average (SMA or EMA) to represent the baseline trend and uses the Average True Range (ATR) to calculate the Upper and Lower bands. The channel automatically widens during high volatility and narrows during low volatility.
Usage
Mean Reversion: In sideways markets, prices touching the outer bands often tend to revert back to the central line.
该脚本构建了一个基于波动率的动态通道(类似肯特纳通道)。它以**移动平均线(SMA或EMA)为中轴判断趋势,并利用真实波幅(ATR)**计算通道宽度。通道范围会随市场波动加剧而变宽,随波动平缓而收窄。
用法
震荡回归: 在横盘行情中,价格触及通道边缘时,往往有回调至中轴的倾向。

Market Regime & Bias Assistant [Prototype v1.1]
Market Regime & Bias Assistant
### **Overview**
The **Market Regime & Bias Assistant** is an all-in-one trend filtration and trading system designed to keep traders on the right side of the market. Instead of relying on a single moving average, this indicator combines **ADX (Trend Strength)**, **Multi-Timeframe EMAs**, **RSI**, and **Volume Spread Analysis (VSA)** concepts to generate a quantitative "Confidence Score" for the current market bias.
It automatically adapts its settings based on your timeframe (Intraday vs. Swing) and provides clear visual cues via background shading, candle coloring, and a data panel.
---
### **Key Features**
* **Auto-Adaptive Modes:** Automatically switches between "Intraday" and "Swing" settings based on your timeframe.
* *Intraday:* Uses faster EMAs (Aggressive 9/30 or Conservative 20/50) and VWAP.
* *Swing:* Uses standard 20/50 EMAs with 200/800 long-term context moving averages.
* **Market Regime Detection:** Identifies if the market is in a **Trend (Bull/Bear)** or a **Range (Neutral)** using a combination of ADX thresholds and EMA alignment.
* **Confidence Scoring (0-100):** A proprietary algorithm that scores the quality of the trend based on RSI alignment, Volume confirmation, and Long-term EMA context.
* **Vector Volume Candles:** Color-coded candles to highlight institutional activity (High Volume) vs. Climactic Volume (Exhaustion).
* **Pullback Signals:** "L" and "S" markers indicating high-probability entries after a pullback into the EMA value zone.
* **Data Dashboard:** A bottom-right panel displaying the current Mode, Regime, Bias, and quantitative Confidence Score.
---
### **How to Read the Visuals**
#### **1. Background Colors (The Regime)**
* **Green Background:** Confirmed **Bullish Trend**. Only look for Longs.
* **Red Background:** Confirmed **Bearish Trend**. Only look for Shorts.
* **Gray Background:** **Neutral / Range**. The market is chopping or consolidating. Stand aside or trade strictly mean-reversion.
#### **2. Candle Colors (Vector Volume)**
* **Green/Red Borders:** Normal volume.
* **Blue / Fuchsia:** **High Volume (1.2x Average)**. Indicates institutional interest or a breakout.
* **Lime / Bright Red:** **Climactic Volume (1.8x Average)**. Indicates potential exhaustion or a stopping volume event.
#### **3. The EMAs**
* **Fast/Slow Lines:** Show the immediate trend direction.
* **Gray/White Lines:** The 200 and 800 EMAs. These act as major support/resistance levels and define the "Big Picture" bias.
* **Lime Line (Intraday Only):** The VWAP (Volume Weighted Average Price).
---
### **How to Use This Indicator**
**Step 1: Check the Regime**
Look at the background color and the Dashboard panel. Is the Trend Strength "Strong" or "Very Strong"?
* *Rule:* Do not take trend-following trades if the Regime is "Range/Neutral."
**Step 2: Check the Confidence**
The dashboard calculates a score from 0 to 100.
* **High Confidence (>67):** All systems go. Alignment of RSI, Volume, and Trend.
* **Medium Confidence (34-66):** Caution warranted. Usually implies divergence in RSI or low volume.
* **Low Confidence (<34):** The trend is weak or failing.
**Step 3: Wait for the Setup (The Arrows)**
The indicator looks for pullbacks into the "Value Zone" (the space between the Fast and Slow EMA).
* **Triangle Up (L):** Appears when price pulls back into the zone during a Bull trend, then bounces out with volume confirmation.
* **Triangle Down (S):** Appears when price rallies into the zone during a Bear trend, then rejects lower.
---
### **Settings & Customization**
* **Mode:** Default is "Auto," but you can force "Intraday" or "Swing" manually.
* **Intraday Style:** Choose between "Aggressive" (9 EMA / 30 EMA) for scalping or "Conservative" (20 EMA / 50 EMA) for day trading.
* **ADX Threshold:** Adjusts how strict the trend filter is (Default: 20).
* **Visual Toggles:** Turn off/on the Panel, Background shading, or Vector candles to clean up your chart.
### **Alerts**
This script comes with built-in alert conditions for:
1. **Bullish Regime Start**
2. **Bearish Regime Start**
3. **High-Confidence Setup Detected**

Squeeze & StructureTitle: Ultimate Squeeze & Market Structure
Description: This all-in-one trading system combines two of the most powerful concepts in technical analysis: Volatility Compression (The Squeeze) and Market Structure (SMC).
It is designed to solve the biggest problem breakout traders face: False Breakouts. By waiting for a Volatility Squeeze to release energy, and confirming it with a structural Break of Structure (BoS) or Change of Character (CHoCH), traders can identify high-probability setups with precision.
How It Works (The "Trifecta" Logic):
1. The Energy (The Squeeze): Using the classic TTM Squeeze logic, the indicator monitors the relationship between Bollinger Bands (price volatility) and Keltner Channels (average range).
Red Cloud: Volatility is compressed. The market is coiling like a spring. This is the Setup Phase.
Breakout: When price expands outside the bands, the energy is released.
2. The Structure (SMC & ZigZag): Built on a custom Non-Repainting ZigZag engine, the indicator objectively maps swing highs and lows to define the trend.
BoS (Break of Structure): Signals trend continuation. Price breaks a previous pivot in the direction of the trend.
CHoCH (Change of Character): Signals potential reversal. Price breaks a significant pivot in the opposite direction of the trend.
Ghost Line: A dotted line shows the live, developing leg of the ZigZag before it is confirmed, helping you anticipate the next pivot.
3. The Confluence (The Strategy): The most powerful signals occur when these two forces align.
Example: A Red Squeeze releases into a Bullish Breakout (Fuchsia Cloud), immediately followed by a Bullish CHoCH. This confirms that not only is volatility expanding, but the structural trend has officially reversed to the upside.
Visual Guide:
☁️ Cloud Colors (Volatility):
🟥 Red: Squeeze ON (Consolidation).
🟣 Fuchsia: Bullish Momentum Breakout.
🔵 Blue: Bearish Momentum Breakout.
🟡 Yellow: Armed/Waiting for Pullback (if Pullback mode is active).
⬜ Gray/Green: Normal Trending.
🏷️ Labels (Structure):
H / L: Confirmed Swing Highs and Lows.
BoS: Break of Structure (Trend Continuation).
CHoCH: Change of Character (Trend Reversal).
Features:
Dual Entry Modes: Choose between "Breakout" (immediate signal) or "Pullback" (waits for a retest of the midline).
Momentum Filter: Breakouts are only colored if the 20 SMA slope agrees with the direction.
Fully Customizable: Adjust ZigZag Sensitivity (Depth/Deviation), Squeeze lengths, and all colors.
Alerts: Triggers available for Squeeze Start, Breakouts, and Armed status.
Credits: This script incorporates concepts from the TTM Squeeze and standard Smart Money Concepts (SMC) market structure analysis. It uses a custom, non-repainting pivot detection algorithm to ensure historical accuracy.

BTC Price Prediction Model [Global PMI]🇨🇳 中文说明 (Chinese Version)
1. 简介
本指标由 GW Capital 使用 Gemini Vibe Coding 技术制作。利用先进的 AI 编程能力,将复杂的宏观经济模型重构为可执行的交易工具。
2. 致谢
特别感谢模型原作者 Marty Kendall。他对这一算法的研究奠定了基础,揭示了比特币价格与宏观经济因素之间的深层联系。
3. 模型原理与公式
该模型基于四大宏观经济支柱计算比特币的“公允价值”。它假设比特币的价格是全球流动性、网络安全性、风险偏好和经济周期的函数。
模型公式
$$\ln(BTC) = \alpha + (1 + \beta \cdot PMI_{z}) \times $$
全球流动性 (M2): 美、中、欧、日四大经济体的 M2 总量(折算为美元)。代表可流入资产的法币资金池。
网络安全性 (Hashrate): 比特币全网算力,代表网络的物理安全性和实用价值。
风险偏好 (S&P 500): 作为全球风险情绪的代理指标。
经济周期 (PMI Z-Score): 美国制造业 PMI 用于根据商业周期(扩张 vs 收缩)来放大或抑制估值。
4. 指标用法
指标会在图表上绘制 公允价值 (白线) 以及基于统计偏差 (Z-Score) 的四条情绪带。
情绪区间
🚨 极度贪婪 (红色区域): 价格 > +0.3 标准差。历史上通常预示市场顶部或情绪过热。
⚠️ 一般贪婪 (橙色区域): 价格 > +0.15 标准差。多头动能强劲,但需谨慎。
⚖️ 公允价值 (白线): 基于宏观数据的理论“正确”价格。
😨 一般恐惧 (青色区域): 价格 < -0.15 标准差。进入低估区域。
💎 极度恐惧 (绿色区域): 价格 < -0.3 标准差。历史上通常是代际级别的买入机会。
情绪评分 (0-100)
100: 极度贪婪 (顶部)
50: 公允价值
0: 极度恐惧 (底部)
5. 使用建议
周期: 仅限日线 (1D) 或周线 (1W)。
原因: 底层数据源(M2, PMI)是月度更新的。标普500和算力是日度更新的。在日内图表(如15分钟、1小时、4小时)上使用此指标没有任何意义,因为基本面数据不会变化得那么快。
长期视角: 这是一个宏观周期指标,旨在识别数月甚至数年的周期顶部和底部,而非用于日内交易。
6. 免责声明
本指标仅供教育和参考使用,不构成任何财务建议。该模型依赖于历史相关性,未来可能不再适用。所有交易均涉及风险。GW Capital 及制作者不对任何交易损失承担责任。
🇺🇸 English Guide (英文说明)
1. Introduction
This indicator was created by GW Capital using Gemini Vibe Coding technology. It leverages advanced AI coding capabilities to reconstruct complex macroeconomic models into actionable trading tools.
2. Credits
Special thanks to the original model author, Marty Kendall. His research into the correlation between Bitcoin's price and macroeconomic factors lays the foundation for this algorithm.
3. Model Principles & Formula
This model calculates the "Fair Value" of Bitcoin based on four key macroeconomic pillars. It assumes that Bitcoin's price is a function of Global Liquidity, Network Security, Risk Appetite, and the Economic Cycle.
The Formula
$$\ln(BTC) = \alpha + (1 + \beta \cdot PMI_{z}) \times $$
Global Liquidity (M2): Sum of M2 supply from US, China, Eurozone, and Japan (converted to USD). Represents the pool of fiat money available to flow into assets.
Network Security (Hashrate): Bitcoin's hashrate, representing the physical security and utility of the network.
Risk Appetite (S&P 500): Used as a proxy for global risk sentiment.
Economic Cycle (PMI Z-Score): US Manufacturing PMI is used to amplify or dampen the valuation based on where we are in the business cycle (Expansion vs. Contraction).
4. How to Use
The indicator plots the Fair Value (White Line) and four sentiment bands based on statistical deviation (Z-Score).
Sentiment Zones
🚨 Extreme Greed (Red Zone): Price > +0.3 StdDev. Historically indicates a market top or overheated sentiment.
⚠️ Greed (Orange Zone): Price > +0.15 StdDev. Bullish momentum is strong but caution is advised.
⚖️ Fair Value (White Line): The theoretical "correct" price based on macro data.
😨 Fear (Teal Zone): Price < -0.15 StdDev. Undervalued territory.
💎 Extreme Fear (Green Zone): Price < -0.3 StdDev. Historically a generational buying opportunity.
Sentiment Score (0-100)
100: Maximum Greed (Top)
50: Fair Value
0: Maximum Fear (Bottom)
5. Usage Recommendations
Timeframe: Daily (1D) or Weekly (1W) ONLY.
Reason: The underlying data sources (M2, PMI) are updated monthly. The S&P 500 and Hashrate are daily. Using this indicator on intraday charts (e.g., 15m, 1h, 4h) adds no value because the fundamental data does not change that fast.
Long-Term View: This is a macro-cycle indicator designed for identifying cycle tops and bottoms over months and years, not for day trading.
6. Disclaimer
This indicator is for educational and informational purposes only. It does not constitute financial advice. The model relies on historical correlations which may not hold true in the future. All trading involves risk. GW Capital and the creators assume no responsibility for any trading losses.

The Biz (ADX/DI/RSI Revised)This is an indicator that will help you trade the GEX, showing when price is trending hard, or about to reverse, and will guide you in picking direction and bias. (INDICATOR SLIGHTLY LAGS)

OTA ATR Stop BufferOTA ATR indicator calculates and displays the Daily Average True Range (ATR), and two customizable ATR percentage values in a clean table format. It provides values in ticks and points, helping traders set stop-loss buffers based on market volatility.

S&P 500 Breadth: Bull vs Bear (20DMA)S&P 500 Breadth: Bull vs Bear (20DMA)
Use as simple market breadth
Strategy: HMA 50 + Supertrend SniperHMA 50 + Supertrend Confluence Strategy (Trend Following with Noise Filtering)
Description:
Introduction and Concept This strategy is designed to solve a common problem in trend-following trading: Lag vs. False Signals. Standard Moving Averages often lag too much, while price action indicators can generate false signals during choppy markets. This script combines the speed of the Hull Moving Average (HMA) with the volatility-based filtering of the Supertrend indicator to create a robust "Confluence System."
The primary goal of this script is not just to overlay two indicators, but to enforce a strict rule where a trade is only taken when Momentum (HMA) and Volatility Direction (Supertrend) are in perfect agreement.
Why this combination? (The Logic Behind the Mashup)
Hull Moving Average (HMA 50): We use the HMA because it significantly reduces lag compared to SMA or EMA by using weighted calculations. It acts as our primary Trend Direction detector. However, HMA can be too sensitive and "whipsaw" during sideways markets.
Supertrend (ATR-based): We use the Supertrend (Factor 3.0, Period 10) as our Volatility Filter. It uses Average True Range (ATR) to determine the significant trend boundary.
How it Works (Methodology) The strategy uses a boolean logic system to filter out low-quality trades:
Bullish Confluence: The HMA must be rising (Slope > 0) AND the Close Price must be above the Supertrend line (Uptrend).
Bearish Confluence: The HMA must be falling (Slope < 0) AND the Close Price must be below the Supertrend line (Downtrend).
The "Choppy Zone" (Noise Filter): This is a unique feature of this script. If the HMA indicates one direction (e.g., Rising) but the Supertrend indicates the opposite (e.g., Downtrend), the market is considered "Choppy" or indecisive. In this state, the script paints the candles or HMA line Gray and exits all positions (optional setting) to preserve capital.
Visual Guide & Signals To make the script easy to interpret for traders who do not read Pine Script, I have implemented specific visual cues:
Green Cross (+): Indicates a LONG entry signal. Both HMA and Supertrend align bullishly.
Red Cross (X): Indicates a SHORT entry signal. Both HMA and Supertrend align bearishly.
Thick Line (HMA): The main line changes color based on the trend.
Green: Bullish Confluence.
Red: Bearish Confluence.
Gray: Divergence/Choppy (No Trade Zone).
Thin Step Line: This is the Supertrend line, serving as your dynamic Trailing Stop Loss.
Strategy Settings
HMA Length: Default is 50 (Mid-term trend).
ATR Factor/Period: Default is 3.0/10 (Standard for trend catching).
Exit on Choppy: A toggle switch allowing users to decide whether to hold through noise or exit immediately when indicators disagree.
Risk Warning This strategy performs best in trending markets (Forex, Crypto, Indices). Like all trend-following systems, it may experience drawdown during prolonged accumulation/distribution phases. Please backtest with your specific asset before using it with real capital.

STRAT - MTF Dashboard + FTFC + Reversals v2.7# STRAT Indicator - Complete Description
## Overview
A comprehensive multi-timeframe STRAT trading system indicator that combines market structure analysis, flip levels, Full Timeframe Continuity (FTFC), and reversal pattern detection across 12 timeframes.
## Core Features
### 1. **Multi-Timeframe STRAT Dashboard**
- Displays STRAT combos (1, 2u, 2d, 3) across 12 timeframes: 1m, 5m, 15m, 30m, 1H, 4H, 12H, Daily, Weekly, Monthly, Quarterly, Yearly
- Color-coded directional bias (green/red/doji)
- Inside bars (●) and Outside bars (●) highlighted
- Current timeframe marked with ★
### 2. **HTF Flip Levels with Smart Grouping**
- Displays higher timeframe (HTF) flip levels (open prices) as labels on the right side
- Automatically groups multiple timeframes at the same price level (e.g., "★ 1H/4H/D")
- Current timeframe flip level always displayed with ★ marker
- Color-coded: Green (above price) / Red (below price)
### 3. **Full Timeframe Continuity (FTFC)**
- User-selectable 4 timeframes for FTFC analysis (default: D, W, M, Q)
- Green line: FTFC Up (highest open of 4 timeframes)
- Red line: FTFC Down (lowest open of 4 timeframes)
- Identifies when price is above/below all 4 timeframe opens
### 4. **Hammer & Shooting Star Detection**
- **Hammer Pattern**: Long lower wick (≥2x body), small upper wick, signals potential bottom reversal
- **Shooting Star Pattern**: Long upper wick (≥2x body), small lower wick, signals potential top reversal
- Scans last 100 bars (adjustable) and marks ALL historical patterns
- Chart markers: 🔨 (Hammer) below bars, 🔻 (Shooting Star) above bars
- Dashboard column shows reversal patterns for each timeframe
- Adjustable wick-to-body ratio sensitivity (1.5 to 5.0)
### 5. **Debug Tables**
- **FTFC Debug**: Shows close vs. 4 timeframe opens, confirms all-green/all-red conditions
- **Reversal Debug**: Real-time analysis of current bar - body size, wick measurements, ratios, and pattern qualification
## Settings
### Display Settings
- Dashboard position (9 options: top-left to bottom-right)
- Dashboard text size (tiny to huge)
- Label offset and text size
- Toggle individual features on/off
### FTFC Settings
- Select 4 custom timeframes for continuity analysis
- Default: Daily, Weekly, Monthly, Quarterly
### Reversal Settings
- **Wick to Body Ratio**: Sensitivity for pattern detection (default 2.0)
- **Lookback Bars**: How many historical bars to scan (default 100, max 500)
- Show/hide reversal markers on chart
- Show/hide reversal debug table
## Use Cases
1. **Momentum Trading**: Identify STRAT setups (2-2, 2-1-2 reversals, 3-bar plays) across multiple timeframes
2. **Swing Trading**: Use HTF flip levels as support/resistance and FTFC for trend confirmation
3. **Reversal Trading**: Catch hammer/shooting star patterns at key levels for counter-trend entries
4. **Multi-Timeframe Analysis**: Confirm alignment across timeframes before entering trades
## How to Use
### For STRAT Traders
- Look for 2-1-2 reversal setups in the dashboard
- Watch for inside bars (●) at HTF flip levels for breakout trades
- Use outside bars (●) to identify potential volatility expansion
### For Reversal Traders
- 🔨 Hammers after downtrends = potential long entries
- 🔻 Shooting stars after uptrends = potential short entries
- Combine with HTF flip levels for high-probability setups
### For Trend Followers
- FTFC green line above = bullish structure
- FTFC red line below = bearish structure
- Enter when price breaks and holds above/below FTFC levels
## Visual Elements
- **Green Labels**: HTF flip levels above current price (resistance)
- **Red Labels**: HTF flip levels below current price (support)
- **Lime Line**: FTFC Up (highest timeframe open)
- **Red Line**: FTFC Down (lowest timeframe open)
- **🔨 Icon**: Hammer pattern (potential reversal up)
- **🔻 Icon**: Shooting Star pattern (potential reversal down)
- **★ Symbol**: Current timeframe or multiple timeframes grouped
## Performance Notes
This indicator performs 12 multi-timeframe security calls and may take 15-30 seconds to calculate on initial load. This is normal for comprehensive MTF analysis.
## Version
v2.7 - Simplified reversal detection, current TF labeling, optimized performance
---
**Perfect for**: STRAT traders, multi-timeframe analysts, reversal pattern traders, swing traders looking for high-probability setups with confluence across timeframes.

OBV + WaveTrend Volume Scalper [GratefulFutures]This script is a combination script of three different strategies that provides buy and sell signals based on the change of volume with momentum confirmations.
Sources used:
This script relies on the outstanding scripts of the great script writer LazyBear: LazyBear
The following scripts were used in this publication:
1. A modified "On-Balance Volume Oscillator" modified from LazyBear's original script:
2. Wavetrend Oscillator with crosses, Author: LazyBear
3. Squeeze Momentum Oscillator, Author: LazyBear
This script functions based on the following criteria being true:
1. On balance volume oscillator turning from negative to positive (buy) or positive to negative (sell)
2. Squeeze Momentum value is increasing (buy) or decreasing (sell)
3. Wavetrend 1 (wt1) is greater than wavetrend 2 (wt2) (buy)/ Wavetrend 1 (wt1) is less than wavetrend 2 (wt2) (sell)
By combining these factors the indicator is able to signal exactly when net buying turns to net selling (OBV) and when this change is most advantageous to continue based on the momentum and price action of the underlying asset (SQMOMO and Wavetrend).
This allows you to pair volume and price action for a powerful tool to identify where price will reverse or continue providing exceptional entries for short term trades, especially when combined with other aspects such as support and resistance, or volume profile.
How to use:
Simply adjust the settings to your preference and read the given signals as generated.
Settings
There are multiple ways to tune the signals generated. It is set standard for my preferred use on a 1 minute chart.
OBV Oscillator Settings
The first 4 dropdowns in the Inputs section tune the On Balance Volume Oscillator (OBVO) portion of the indicator. You can choose if you want it to calculate based on close, open, high, low, or other value.
The most impactful in the entire settings is going to be the length and smoothing of the OBVO EMA. Making this number lower increasing the sensitivity to changes in volume, making the signals come quicker but is more susceptible to quick fluctuations. A value of between (5-20) is reasonable for the OBVO EMA length. There is a separate smoothing factor titled OBV Smoothing Length and below that, OBV Smoothing Type , a value of (2) is standard with "SMA" for smoothing type with a value of between 2-10 being reasonable. You may also play with these values to see what you like for your trading style.
Wavetrend Settings
The next 3 options are to modify the wavetrend portion of the indicator. I do not modify these from standard, and feel that they work appropriately on all time frames at the following values: n1 length (10), n2 length (20), Wavetrend Signal SMA length (4)
Squeeze Momentum Settings
The following 5 options through the end modify the Squeeze momentum portion of the indicator. The only one that modifies the signals generated is the KC Length , Making this number lower increasing the sensitivity to changes in price action, making the signals come quicker but is more susceptible to quick fluctuations. A value of between (18-25) is reasonable for KC Length .
Style Setting
You may select if you want to see the buy and sell signals. The following 5 options Raw OBV Osc through Squeeze Momentum allow you to see where each specific requirement was met, posted as a vertical line, but for live use it is recommended to turn all of these vertical lines off and only use the buy and sell signals.
Time Frames:
While this script is most effective on shorter time frames (1 minute for scalping and daytrading) it is also viable to use it on longer timeframes, due to the nature of its components being independent of time frame.
Examples of use - (Green and red vertical lines are for visualization purpose and are not part of the script)
SPY 1 Minute (Factory Settings):
SPX 15 minutes (Factory Settings):
Considerations
This script is meant primarily for short term trading, trades on the basis of seconds to minutes primarily. While they can be a good indication of volume lining up with momentum, it is always wise to use them in combination with other factors such as support, resistance, market structure, volume levels, or the many other techniques out there...
As Always... Happy Trading.
-Not_A_Mad_Scientist (GreatfulFutures Trade University)

Vdubus Divergence Wave Pattern Generator V1The Vdubus Divergence Wave Theory
10 years in the making & now finally thanks to AI I have attempted to put my Trading strategy & logic into a visual representation of how I analyse and project market using Core price action & MacD. Enjoy :)
A Proprietary Structural & Momentum Confluence SystemPart 1: The Strategic Concept1. The Core Philosophy: "Geometry + Physics"Traditional technical analysis often fails because traders confuse location with timing.Geometry (Price Patterns): Tells us WHERE the market is likely to reverse (e.g., at a resistance level or harmonic D-point).Physics (Momentum): Tells us WHEN the energy driving the trend has actually shifted. The Vdubus Theory posits that a trade should never be taken based on Geometry alone. A valid signal requires a specific, fractal decay in momentum—a "Handshake" between price structure and energy exhaustion.2. The 3-Wave Momentum Filter (The Engine)Most traders look for simple divergence (2 points). The Vdubus Theory demands a 3-Wave Structure to confirm the true state of the market.A. The Standard Reversal (Exhaustion)This is the "Safe" entry, catching the slow death of a trend.Wave 1 $\rightarrow$ 2 (The Warning): Price pushes higher, but momentum is lower (Standard Divergence). This signals that the trend is tapping the brakes.Wave 2 $\rightarrow$ 3 (The Confirmation): Price pushes to a final extreme (often a stop-hunt), but momentum is flat or lower than Wave 2 ("No Divergence").The Logic: This confirms that the buyers have expended all remaining energy. The engine is dead.
B. The Climax Reversal (The Trap)This is the "Aggressive" entry, catching V-shape reversals.Wave 1 $\rightarrow$ 2 (The Bait): Price pushes higher, and momentum is Stronger/Higher (No Divergence). This sucks in retail traders who believe the trend is accelerating.Wave 2 $\rightarrow$ 3 (The Snap): Price pushes again, but momentum suddenly collapses (Divergence).The Logic: A "Strong to Weak" shift. The market traps traders with a show of strength before hitting a "concrete wall" of limit orders.C. The Predator (The Trend Continuation)The Logic: Trends rarely move in straight lines. The "Predator" looks for Hidden Divergence during a pullback.The Signal: Price makes a Higher Low (Trend Structure Intact), but Momentum makes a Lower Low (Oversold Trap). This signals the end of the correction and the resumption of the main trend.3. The "Clean Path" PrincipleA trade is only valid if there is no opposing force. If you are looking to Sell (Bearish Reversal), the opposing Bullish momentum must be weak or neutral. If the "Enemy" is strong, the trade is skipped.
Part 2: The Indicator Breakdown
Tool Name: Vdubus Divergence Wave Pattern Generator V1
This script automates your analysis by combining ZigZag Pattern Recognition (Geometry) with your Custom MACD Logic (Physics).
1. The "Golden" Settings
The physics engine is tuned to your specific discovery:
Fast Length: 8
Slow Length: 21
Signal Length: 5
Lookback: 3 (Sensitive enough to catch the exact pivot points).
2. Signal Generation Logic
The indicator scans for four distinct setups. Here is the exact logic code translated into English:
Signal 1: Standard Reversal (Green/Red Pattern)
Geometry: The ZigZag algorithm identifies a 5-point structure (X-A-B-C-D), such as a Gartley, Bat, or Butterfly.
Physics Check:
Finds the last 3 momentum peaks matching the price highs.
Rule: Momentum Peak 2 must be < Peak 1 (Divergence).
Rule: Momentum Peak 3 must be <= Peak 2 (Confirmation/No Div).
Output: Draws the colored pattern and labels it (e.g., "Bearish Gartley (Exhaustion)").
Signal 2: Climax Reversal (Orange Pattern)
Geometry: Identifies the same 5-point structures.
Physics Check:
Rule: Momentum Peak 2 is >= Peak 1 (Strength/No Div).
Rule: Momentum Peak 3 is < Peak 2 (Sudden Failure/Div).
Output: Draws the pattern in Orange labeled "⚠️ CLIMAX REVERSAL". This is your "Trap" detector.
Signal 3: Rounded Top/Bottom (Navy/Maroon Label)
Geometry: Price is compressing or rounding over.
Physics Check:
Scans for 4 consecutive waves of momentum decay.
Rule: Peak 1 > Peak 2 > Peak 3 > Peak 4.
Output: Places a label indicating a "Multi-Wave Decay," identifying turns that don't have sharp pivots.
Signal 4: The Predator (Purple Pattern)
Geometry: Identifies a trend pullback (Higher Low for Buys).
Physics Check:
Rule: Momentum makes a Lower Low while Price makes a Higher Low (Hidden Divergence).
Output: Draws a Purple pattern labeled "🦖 PREDATOR" to signal trend continuation.
3. The Confluence Dashboard
Located in the corner of the screen, this provides a final "Safety Check."
Logic: It compares the absolute value (strength) of the most recent Bearish Momentum Peak vs. the most recent Bullish Momentum Low.
Output:
Green (Bulls Strong): Buying pressure is dominant. Safe to Buy, Dangerous to Sell.
Red (Bears Strong): Selling pressure is dominant. Safe to Sell, Dangerous to Buy.
Grey (Neutral): Forces are balanced.
Summary of Potential
This system solves the "Trader's Dilemma" of entering too early or too late. By waiting for the 3rd Wave, you effectively filter out the market noise and only commit capital when the opposing side has structurally and physically collapsed. It transforms trading from a guessing game into a disciplined execution of identifying Geometric Exhaustion.
Logic 1 / PREVIOUS DIVERGENCE PROJECTS future TREND BREAKS / Reversals *Not in script*
Logic 2 / Wave 1 to 2 = Divergence / Wave 2 to 3 = NO divergence = Signal
Reverse logic: Wave 1 to 2 = NO Divergence / Wave 2 to 3 = Divergence = Signal
