PSP Universal First Hour Trading SystemPSP Universal First Hour Trading System
Type: Indicator (Pine v5)
Works on: Any symbol & intraday timeframe
Idea: Trade the breakout of the first-hour range with auto Targets/SL, clean signals, and a full P&L dashboard.
What it does
Automatically detects the first-hour session (fully configurable start time & timezone) and draws:
First Hour High / Low
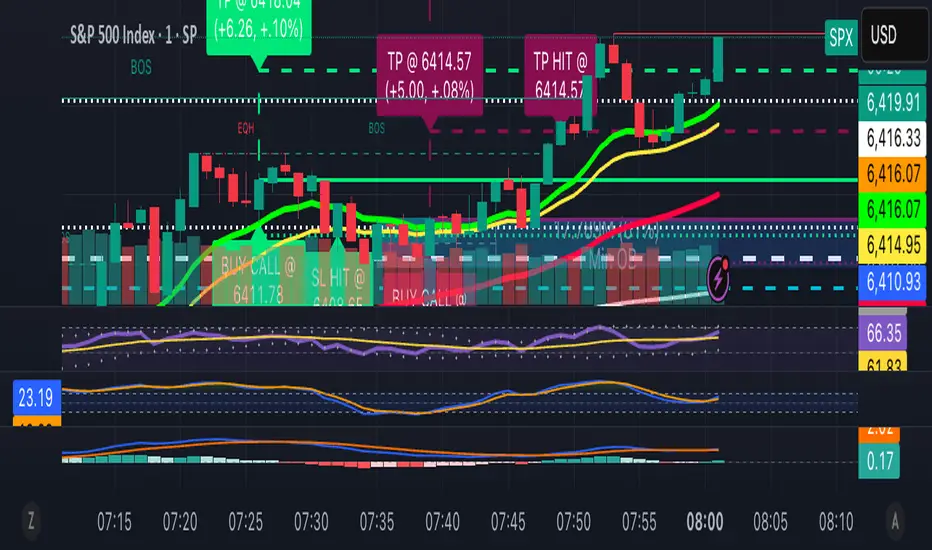
Projected Target and Stop-Loss for both directions
Triggers one signal per day on breakout:
🟢 BUY when price breaks above the First Hour High
🔴 SELL when price breaks below the First Hour Low
Lets you choose Signal timing:
Close = confirms at candle close (more reliable)
Touch = triggers intra-bar (more responsive)
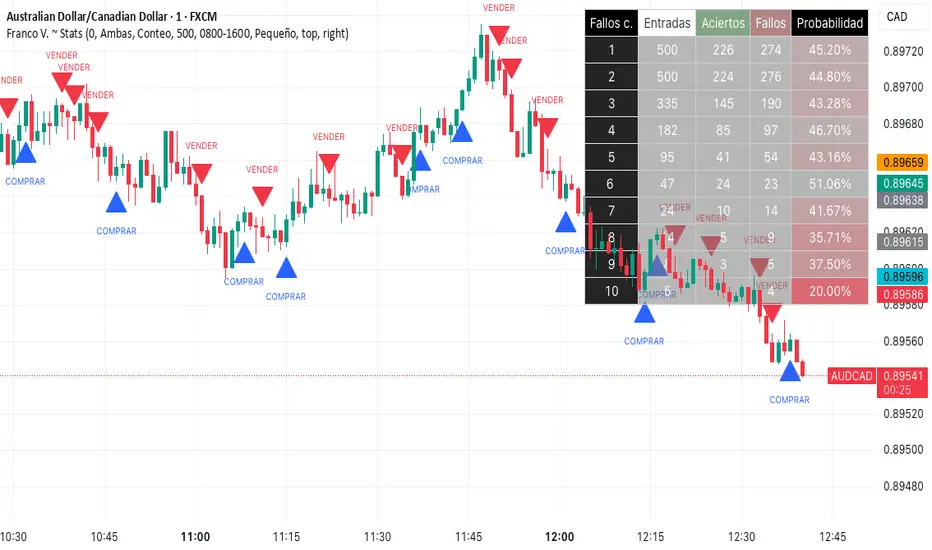
Tracks and displays a comprehensive P&L table: trades, win rates, avg P/L, R:R, today’s stats, and ₹ results based on your lot-size.
P&L Dashboard (auto-updating)
Totals: Trades, Win Rate, Target Hits vs Misses
Breakdown: Buy vs Sell counts & win%
Averages: Avg Profit, Avg Loss, R:R
Today’s Section: Trades, Win%, Targets, Misses, Today P&L (Pts & ₹)
Overall: Total Profit/Loss (Pts & ₹), Net P&L, est. ROI (base ₹1L)
Context: Timeframe, Session time, Target mode/values, Candles, Status
How to use
Add the indicator to your chart.
Set your session start time, timezone, and first-hour length to match the market.
Choose Points or Percentage for Target/SL and set values.
Decide whether signals should confirm on Close (recommended) or on Touch.
(Optional) Set From Date and Lot Size to compute accurate ₹ stats.
Enable alerts for automation or notifications.
Good to know
Designed to avoid multiple trades per day—first valid breakout only.
Lines and labels are non-repainting when using Signal on Close.
Works across indices, stocks, futures, and crypto; adjust Target/SL to instrument volatility.
Best-practice presets (suggestions)
Indices (5-min): Target 40–80 pts, SL 25–40 pts
Large-cap stocks (5–10 min): Target 0.5–1.0%, SL 0.3–0.6%
Crypto (5–15 min): Start with % mode (e.g., TGT 0.5–1.0%, SL 0.3–0.7%)
Pine Script® göstergesi