Options
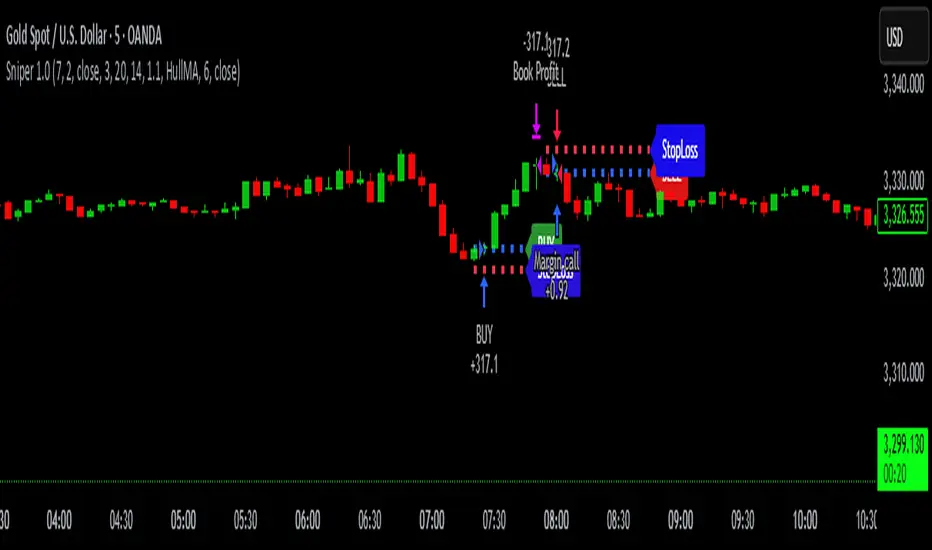
Sniper 1.0Overview
The tool is a powerful, real-time trendline-based breakout tool enhanced with RSI confirmation and EMA insights. Designed for scalpers and intraday traders, this script blends smart price action with momentum analytics to help identify high-probability breakout opportunities with precision. tool pridict TOP and BOTTOM easily.
User Benefits
Improved Entry Accuracy: Catch TOP and BOTTOM
Trend Confidence: Visual trendlines adapt in real-time based on ATR slopes.
Multi-Timeframe Insights: Analyze lower timeframe breakouts with 15-minute RSI filtering.
Speed & Clarity: Get directional hints with a color-coded EMA.
Flexible Backpainting: Backtest with dynamic trendlines or forward-only for cleaner real-time visuals.
Key Features
Dynamic Trendlines: Automatically plots real-time up/down trendlines using pivot points and ATR slope mechanics.
Breakout Signals with RSI Confirmation: Identifies breakouts when price crosses trendlines and RSI supports the move.
EMA Trend Filter: Highlights trend strength with EMA and signals momentum shifts.
Custom Timeframe RSI Input: Leverage higher or lower timeframe RSI for added signal filtering.
Alert Ready: Set alerts for bullish or bearish breakouts confirmed by RSI.
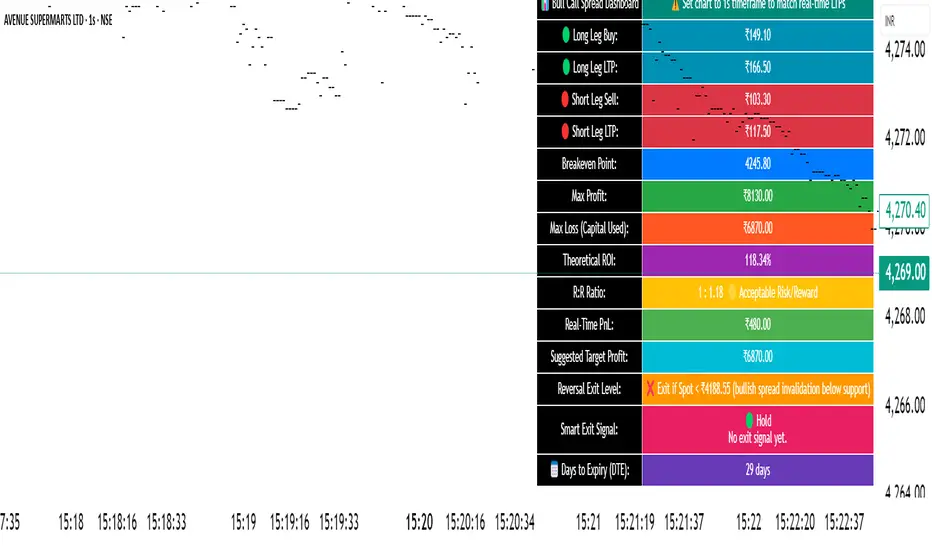
🧠 STWP Dashboard (Bull Call Spread / Bear Put Spread)________________________________________
🧠 STWP Options Strategy Dashboard (Bull Call Spread/ Bear Put Spread)
Author: @simpletradewithpatience
Markets: NSE (India)
Best timeframe: 1-second chart
Built with: Pine Script v5
________________________________________
📌 Overview
A real-time options strategy dashboard tailored for NSE traders, designed for two-leg spreads:
✅ Bull Call Spread → Buy Lower Strike CE, Sell Higher Strike CE
✅ Bear Put Spread → Buy Higher Strike PE, Sell Lower Strike PE
This tool gives you a real-time, color-coded visual interface with:
Entry premiums & breakeven levels
Live LTPs & PnL
ROI & Risk: Reward
Smart Exit logic
Alerts for expiry, Greeks, and PnL events
It’s fully manual, for educational and tracking use only — not for automated trading.
________________________________________
📌 Key Features
✅ Track Bull Call & Bear Put Spreads
✅ Live LTP tracking via symbol input
✅ Real-time PnL, breakeven, max profit/loss
✅ ROI & Risk:Reward calculation
✅ Smart Exit logic with trade verdicts
✅ Invalidation logic with Reversal Exit
✅ Manual input of Greeks (Delta, Gamma, Theta, IV%)
✅ Greek-based alerts for Gamma Risk, IV Crush, Theta Decay
✅ Days to Expiry (DTE) tracking
✅ Fully customizable alert system
✅ Clean, emoji-labelled dashboard UI
✅ Built for Indian NSE options only
✅ Requires 1-second chart for correct data
________________________________________
📌 Option Symbol Inputs (LTP Tracking)
✅ Long Leg Symbol (Buy): Lower strike CE (Bull Call) or higher strike PE (Bear Put)
✅ Short Leg Symbol (Sell): Higher strike CE (Bull Call) or lower strike PE (Bear Put)
✅ Symbol Tips: Use TradingView's dropdown to select NSE option symbols like NSE:RELIANCE25JUL3000CE
⚠️ Providing valid option symbols is crucial — it powers all live tracking and calculations.
________________________________________
📌 Trade Setup Parameters
Spot Price at Entry
Long & Short Strike Prices
Buy Price (Long Leg)
Sell Price (Short Leg)
Lot Size & Number of Lots
Loss Bearable Amount (₹) → Used by Smart Exit logic to issue early warnings
________________________________________
📌 Expiry Date Input
Expiry Year, Month, and Day
🎯 Used to calculate Days to Expiry (DTE) and enable:
⏱️ Expiry alerts like “Less than 2 Days”, “Theta Risk”, and more
📉 Smart Exit logic adjusts based on time decay
________________________________________
📌 Greeks (Optional)
🔹 Default Mode: Don’t Enter Greeks
🔹 Optional Mode: Enter Greeks for both legs (Delta, Gamma, Theta, IV%)
🔍 Enabling Greeks unlocks:
Net Delta, Gamma, Theta, IV
Greek-based warnings (e.g. Gamma Risk, Theta Risk)
A dashboard Greek Verdict:
🟢 Conservative 🟡 Moderate Risk 🔴 Aggressive Risk
________________________________________
📌 Dashboard Display
🎯 Strategy Type (Bull or Bear Spread)
📈 Entry Premiums & Live LTPs
💹 Breakeven, Max Profit/Loss, Net Premium
📊 ROI % & Risk:Reward (with verdict)
📉 Real-time PnL using tick-by-tick data
🚦 Smart Exit verdict: Hold, Exit Soon, or Book Profit
🔁 Reversal Exit Price (spread invalidation logic)
📆 Days to Expiry (DTE)
📐 Greek Data (if enabled) with Net & Average values
⚠️ Greek Risk Verdict for managing directional risk
________________________________________
📌 Alert System (Built-in Alerts)
🎯 Target Profit Hit
❌ Max Loss Reached
🛑 Loss Bearable Limit Breached
📍 Hold Signal
📉 Book Loss / Exit Soon
⏳ Expiry Nearing
⚠️ Spread Invalidation Alert (via Reversal Price breach)
💥 High Gamma Risk (if Gamma > ±0.05)
📉 High IV Alert (if IV > 35%)
🚨 Combined Master Alert – fires if any key condition is triggered
________________________________________
📌 Smart Exit System
⚙️ Context-aware, dynamic trade assistant
✅ Analyses real-time market, PnL, expiry risk, reversal risk
✅ Gives exit suggestions based on:
Time decay
Price invalidation
Breach of defined loss/profit thresholds
✅ Keeps you objective — no emotional exits
________________________________________
📌 Reversal Exit Logic
🔁 Detects directional failure in spread structure
Bull Call Spread: Invalidation = Spot falls 25% of net premium below long strike
Bear Put Spread: Invalidation = Spot rises 25% of net premium above short strike
📉 Alerts you to exit even before loss appears
🎯 Designed for directional traders using spread logic
💡 Acts as a breakdown or breakout filter
________________________________________
⚠️ Important Notes
✅ Built for NSE Options – not for global exchanges
✅ Only for Bull Call & Bear Put spreads
✅ Use on 1-second chart only
❌ Will not work properly on higher timeframes
✅ Manual tool only – doesn’t place trades
✅ For educational and research use only
________________________________________
💬 How to Use This Dashboard
Choose Your Strategy
Bull Call or Bear Put
Input Symbols & Strikes
Use Tradingview dropdown to select accurate NSE option symbols
Enter Buy/Sell Prices
Add premiums, lot size, no. of lots
(Optional) Enable Greeks
Add Delta, Gamma, Theta, IV for both legs
Set Expiry Date
Year, Month, Day — activates DTE & expiry alerts
Monitor Dashboard
Live PnL, Max P/L, ROI, R:R, Smart Exit, Reversal Levels
(Optional) Enable Alerts
Get notified for PnL events, expiry risk, Greek risk, spread failure
________________________________________
🤝 Final Note
This tool was built with patience and care by @simpletradewithpatience to help fellow options traders trade more objectively, systematically, and confidently.
Feel free to share feedback on Tradingview.
Happy Trading! 📈
Stay disciplined. Stay smart.
________________________________________
🔠 Glossary
PnL – Profit & Loss
LTP – Last Traded Price
IV – Implied Volatility
DTE – Days to Expiry
ROI – Return on Investment
R:R – Risk to Reward Ratio
CE / PE – Call / Put Option
SEBI – Securities and Exchange Board of India
________________________________________
⚠️ Disclaimer
This script is for educational and research purposes only.
I am not a SEBI-registered advisor.
No buy or sell recommendations are made.
Trading options involves significant risk.
Use proper risk management and always consult a licensed advisor if in doubt.
The author is not responsible for any financial losses incurred.
By using this tool, you agree to these terms.
________________________________________
🕶️ StealthFlow™ Prime – Option Sniper Signal System🕶️ How to Use the StealthFlow™ Prime – Option Sniper Signal System
Welcome to the StealthFlow™ Prime – your edge in the fast-moving world of Nifty & Bank Nifty options.
🔑 Access Instructions:
1. I’ve granted access to your TradingView username.
2. Open your TradingView account.
3. Go to “Indicators” → “Invite-only scripts”
4. Search and click on:
🕶️ StealthFlow™ Prime – Option Sniper Signal System
✅ It will now load automatically on your chart.
📈 Recommended Chart Setup
Parameter Setting
Timeframe 5-minute or 15-minute (also check with 3 mins)
Symbol NIFTY or BANKNIFTY
Chart Type Candlestick
Session Intraday only
🧠 How It Works (Simplified)
This system detects momentum shifts and hidden price action flows based on:
• Supertrend logic (breakouts)
• Volume-weighted indicators (VWMA & VWAP)
• EMA for directional trend
🔔 Trade Signals:
• 🟢 BUY Signal:
A green “BUY” label appears below the candle when the system detects a bullish breakout.
• 🔴 SELL Signal:
A red “SELL” label appears above the candle when momentum flips bearish.
Use these signals to time your entry into CE/PE positions — especially after consolidation or breakout setups.
⚠️ Pro Tips for Option Traders:
• Only trade in high-volume sessions (9:30 AM – 11:30 PM IST)
• Avoid trades near big events (RBI policy, global news)
• Target ATM or slightly ITM options with 1–2 lots for low-risk entries
• Combine with price action at support/resistance for sniper accuracy
📲 Optional: Set Alerts
1. Click “Alerts”
2. Condition: Choose StealthFlow BUY Alert or SELL Alert
3. Set to: Once per Bar Close
4. Enable Push, Email, Popup as per your preference
5. Click Create
Now you’ll get instant notifications when a trade signal fires — no need to stare at charts all day.

Max Profit Min Loss Options Strategyoption when to buy and sell calls and puts indicator. it uses the rsi macd and volume indicators. it has high profit and low loses
🔁 A.X.I.S Fibonacci Engine V2 – Smart Projected Pathway🔁 A.X.I.S Fibonacci Engine V2 – Smart Projected Pathway indicator
The A.X.I.S Fibonacci Engine V2 is a next-generation Fibonacci projection tool designed for traders seeking advanced, adaptive levels that respond to true multi-timeframe market structure. Built from the ground up for active traders—scalpers, swing traders, and position players—it fuses traditional Fibonacci logic with dynamic price projection and smart anchor logic.
How It Works:
Multi-Timeframe Anchoring:
Anchors your Fibonacci levels to High Timeframe (HTF) pivots for powerful bias and “macro” market structure, while also utilizing Low Timeframe (LTF) swing detection for precise “micro” projection and pathway analysis.
Dynamic Pathway Projection:
Beyond static lines, this engine allows Fibonacci levels to be projected forward, following the price path between significant swings—giving you projected targets and active “pathways” instead of just fixed retracement bands.
Trend-Adaptive Logic:
Determines bullish/bearish bias based on where HTF price closes relative to a moving average (HTF EMA-20), meaning the plotted fibs automatically adjust to uptrends or downtrends. No need to guess direction.
Auto-Cleanup & Smart Management:
Old lines and labels are deleted automatically to keep your chart clean, and levels are recalculated with every new significant swing (“leg”)—no manual intervention needed.
Key Features:
Multi-Timeframe Input:
Choose both HTF (for “anchor” pivots) and LTF (for “projection” pivots) independently.
Fine-tune swing sensitivity for both anchors and pathway pivots.
Classic + Projected Mode:
Choose between standard horizontal Fibs or enable Dynamic Pathway Mode to project levels diagonally into future bars, creating “fib pathways.”
Color Customization:
Individualize bullish/bearish fib colors, line style (solid, dashed, dotted), thickness, label position, and transparency.
Special “golden zone” highlighting for the most critical levels (0.618/0.786).
Visual Anchors:
Optionally plot markers for HTF swing pivots for extra clarity.
Chart Cleanliness:
Script manages and deletes its own objects—no more chart clutter!
Real-Time Auto-Update:
All levels and pathways update in real time as market structure changes.
User-Friendly Labels:
Toggle on/off fib level labels, with position and background adjustments.
Practical Trading Applications:
Swing/Position Trading:
Use HTF pivots for macro context, then project LTF fibs into the future for potential reversal/extension targets.
Scalping:
Deploy on lower timeframes with micro pivots for intraday levels and short-term projected moves.
Dynamic Take-Profit & Entry Zones:
Identify evolving TP and re-entry zones as price carves out new swings, even in choppy or trending conditions.
Trend Confirmation:
Let the engine determine trend direction, so your fibs are always aligned with prevailing momentum.
How to Use:
Add to Chart:
Apply the indicator to any chart or timeframe.
Set Your Anchors:
Pick the HTF (anchor) and LTF (projection) timeframes.
Adjust swing sensitivity (lookback) as needed.
Enable/Disable Dynamic Pathway:
For regular fibs, leave off.
For projected “pathways,” turn it ON—lines will project forward along the likely path of the next move.
Adjust Colors, Labels, and Styles:
Fine-tune everything for clarity and your personal style.
Watch for Changes:
As new pivots form, the script will update levels in real time, keeping your roadmap fresh.
(Optional) Show Macro Swings:
Toggle on/off to plot markers for the most recent HTF pivots.
Who Is It For?
Day traders, scalpers, and swing traders wanting true projected price targets—not just static fibs.
Traders tired of redrawing fibs after every new swing.
Anyone who wants a clean, dynamic, and truly adaptive fib tool that blends macro and micro market structure into one engine.
What Makes It Different?
True multi-timeframe awareness:
Adapts to both macro (HTF) and micro (LTF) structure.
Automatic trend recognition:
Fibs align with price action—no manual flipping.
Projected, not just static:
See where fib levels could land, not just where they were.
Cleanest chart management:
Deletes its own lines and labels on every update—no mess, ever.
Note:
This tool is for educational and informational purposes only. Not financial advice. Always use proper risk management!
Any issues or feature requests? Drop a comment below or reach out!
Happy trading and welcome to the A.X.I.S revolution.
— I5X-Albatross

NY/LDN/TOK Stock Exchange Opening HoursThis indicator displays vertical dotted lines marking the exact opening times of the three major global stock exchanges: New York (NYSE), London (LSE), and Tokyo (TSE). Perfect for traders who need to track market opening sessions across different time zones.
Features:
New York Stock Exchange (NYSE): 9:30 AM EST/EDT
London Stock Exchange (LSE): 8:00 AM GMT/BST
Tokyo Stock Exchange (TSE): 9:00 AM JST
Key Highlights:
✓ Automatic daylight saving time adjustments for NY and London
✓ Individual color customization for each market
✓ Toggle on/off functionality for each exchange
✓ Clean vertical dotted lines (1-pixel width) that extend across the entire chart
✓ Interactive legend in bottom-right corner showing active markets
✓ Weekdays only (Monday-Friday) - no weekend lines
✓ Uses official local time zones for accurate timing
Customizable Settings:
Enable/disable individual exchanges
Custom color selection for each market line
Dynamic legend that shows only enabled markets
Time Zone Handling:
The indicator automatically handles daylight saving time transitions using official time zones:
America/New_York (EST/EDT)
Europe/London (GMT/BST)
Asia/Tokyo (JST - no DST)
Perfect for:
Multi-market traders
Session overlap analysis
Global market timing coordination
Institutional trading schedules
Simply add to your chart and customize colors/visibility in the indicator settings. The legend will automatically update to show your active markets in their respective colors.

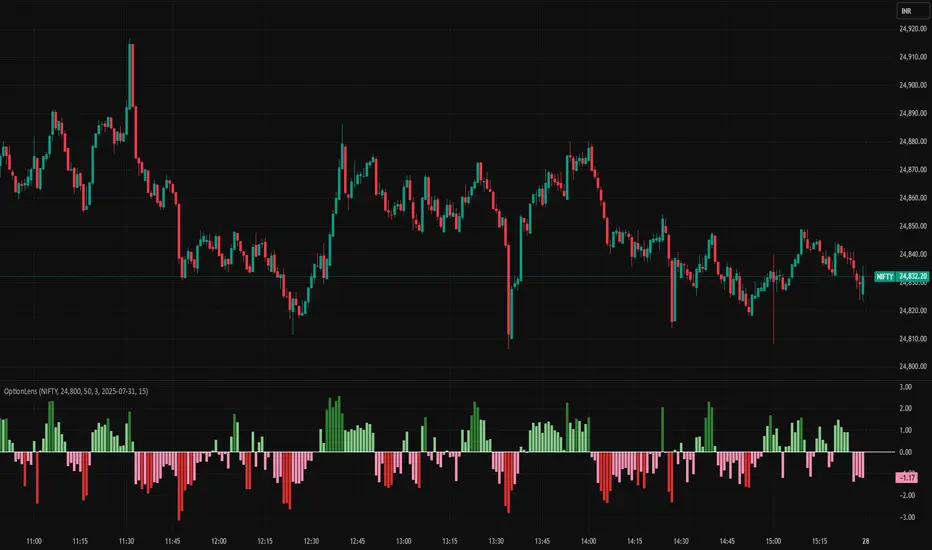
OptionLens for NSE IndicesOptionLens is a unique tool designed to give traders of NIFTY, BANKNIFTY, FINNIFTY, and MIDCPNIFTY real-time insights into market sentiment by analyzing live option premiums across multiple strike prices. Unlike traditional indicators, OptionLens draws on the collective effect of option pricing mechanics—including the influence of Delta (directional conviction), Gamma (momentum of Delta), Theta (impact of time decay), Vega (volatility response), and Rho (interest rate sensitivity). By tracking how traders are bidding for Calls and Puts around the ATM strike, it estimates whether the broader market is leaning bullish or bearish—reflected as a 4-color histogram:
Dark Green bars signal strong bullish sentiment
Light Green bars reflect a developing bullish bias or price consolidation
Light Red bars suggest mild bearish undertones or price consolidation
Dark Red bars represent strong bearish momentum
OptionLens does not rely on volume or open interest but uses price action in the options market to offer a clean, visual snapshot of sentiment shifts. It includes built-in alerts for significant sentiment transitions, making it an ideal companion for intraday and swing traders seeking a deeper edge from the derivatives market.
Arambhik's Option Buyer Trend📈 Arambhik's Option Buyer Trend
Crafted for Intraday Option Buyers | Precision. Logic. Control.
This advanced trend-following tool helps option buyers capture directional momentum using layered confirmations and adaptive risk management, fine-tuned for the Indian derivatives market.
🔍 Core Features
🔵 Primary Trend Detection: Built with JMA & Kalman Filter for smooth trend recognition.
⚡ Two-Step Entry Validation: Confirms entries using dual ADX logic (on both option chart and underlying).
🧠 Smart Market Mode: Automatically detects market condition (Volatile / Slow) using India VIX and adjusts strategy logic.
🧮 Dynamic Risk Control: ATR-based Stop Loss with 3 Reward Targets (TP1, TP2, TP3) and ADX-guided trailing stop climb.
🟣 Optional Exit Logic: Especially effective in slow markets to protect mid-trend gains.
📊 Visual Aids: Clean plotting of Entry, SL, TPs, and Trailing SL along with real-time profit/loss labels.
🔔 Alerts: Alerts for Entry, Exit, Profit Booking, and Stop Loss for better automation.
🛠️ Usage Guide
Apply on: NIFTY/BANKNIFTY Option CE/PE charts
Chart Selection:
▸ At The Money (ATM) — recommended
▸ Up to 2 strikes In The Money (ITM)
▸ Or up to 4 strikes Out Of The Money (OTM)
Timeframe: 3-minute (recommended)
Settings Reminder:
☑️ Be sure to set the correct underlying (e.g., NIFTY or BANKNIFTY) in the indicator settings.
☑️ Set the ADX values for the option and underlying market as per your preference—the default values are optimized and good enough for most users.
☑️ Keep all other settings unchanged (default) for best results.
⚠️ Disclaimer
This indicator is for educational purposes only. The author is not SEBI registered. Please paper trade or backtest thoroughly before using it live. Use at your own discretion and risk.

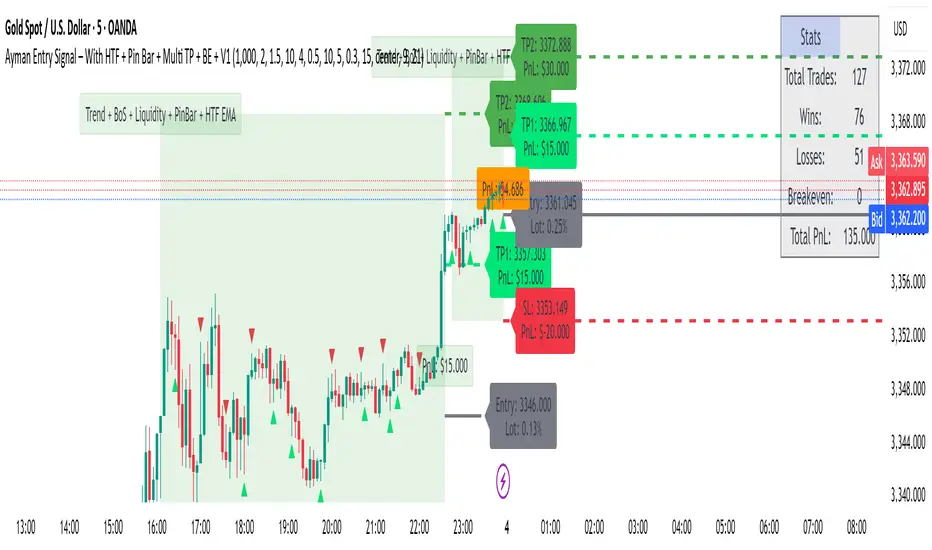
Ayman Entry Signal – With HTF + Pin Bar
A professional and versatile trading indicator combining classic technical analysis with Smart Money Concepts to detect high-probability entry points.
Designed especially for scalping gold and forex pairs on lower timeframes. Fully customizable to suit any trading style.
✅ Key Features:
EMA Trend Confirmation
Break of Structure (BoS) Detection
Order Block Zone Recognition
Fair Value Gap (FVG) Confirmation
Liquidity Sweep Detection
Pin Bar Candlestick Confirmation
Higher Timeframe Confirmation (HTF EMA + HTF BoS)
🎯 Smart Risk Management:
Automatically calculates Stop Loss (SL) and Take Profit (TP) based on the selected timeframe.
Dynamically adjusts lot size based on account capital and risk percentage.
📈 How It Works:
The indicator triggers a Buy or Sell signal only when a selected set of conditions are met, including:
Trend direction (EMA crossover)
Break of structure
Presence within strong supply/demand zones
Confirmation from higher timeframe
Reversal Pin Bar pattern
🛎 Alerts:
Built-in alert system notifies you instantly when a valid Buy or Sell signal is triggered.
⚙️ Customizable Settings:
Risk Percentage
Capital Size
HTF timeframe
Enable/Disable individual filters (EMA, BoS, OB, FVG, Liquidity, Pin Bar, HTF)
📌 Best Timeframes:
1-min, 5-min, and 15-min – especially during high-volume sessions like London or New York.
🔸 Note:
This is not financial advice. Always backtest and use manual confirmations before live trading.
Mental Reminder# Mental Reminder - Trading Psychology Overlay
## 🧠 Why This Indicator Matters
Trading success isn't just about technical analysis - it's about psychology. The biggest enemy of profitable trading is often our own emotions and impulses. This indicator serves as your constant mental anchor, displaying personalized reminders that keep you focused on what truly matters.
## 💡 Core Purpose
**Combat Emotional Trading**
Every trader knows the feeling - you see a price movement and your emotions take over. This overlay keeps your trading rules and mindset visible at all times, acting as a psychological brake against impulsive decisions.
**Reinforce Discipline**
Whether it's "Wait for confirmation", "Risk management first", or "The market will always be here tomorrow" - having your key principles constantly visible helps internalize good trading habits.
**Maintain Patience**
In a world of instant gratification, successful trading requires patience. A simple "Let the setup come to you" reminder can prevent countless premature entries and exits.
## 🎯 Real Trading Applications
- **Pre-market reminder**: "Review your plan" before market open
- **During drawdowns**: "Trust the process" or "Losses are part of the game"
- **In volatile markets**: "Stay calm" or "Stick to your strategy"
- **During winning streaks**: "Don't get overconfident" or "Risk management still matters"
- **FOMO moments**: "There will always be another trade"
## 🔄 The Psychology Behind Visual Reminders
Studies show that visual cues are more effective than trying to remember rules mentally. When you're in the heat of trading, emotions can cloud judgment. A constant visual reminder cuts through the emotional noise and brings you back to your planned approach.
**Why Fixed Position Works**
Unlike annotations that move with price, this reminder stays in your peripheral vision - always there, never intrusive, but impossible to ignore when you need it most.
Your trading edge isn't just your strategy - it's your ability to execute it consistently. This simple tool helps bridge the gap between knowing what to do and actually doing it.

🟡🔵🟢🔴Beginner's Assistant by carljchapman🟡🔵🟢🔴
Overview
This indicator dynamically marks highs and lows of the premarket (4:00am-9:30amEST) and opening range. It displays Fair Value Gaps, 9 and 21 period Exponential Moving Averages (EMA) and the Volume Weighted Average Price (VWAP). To really help beginners, it marks suggested entry points on the chart with green or red triangles, when a reasonable trend appears.
Features
Automatically draws blue lines for Premarket High and Low values
Dynamically marks the opening Range region
Visual entry signals for long and short opportunities
Primarily used for stocks/funds , but works with forex and crypto
Quick configuration settings to tailor details for your experience level
Mobile friendly mode
Supports alerts
How To Use
Open your chart, and select a 1 or 2 minute timeframe.
Watch for green triangles and red triangles, hinting at entries for long or short positions. Pay particular attention to the price action as it approaches the bounds of the opening range and the premarket levels. I suggest also using a MACD indicator for confirmation of the trend.
For scalping 0dte Options, switch frequently between the 1 ,2 and 5 minute or higher timeframes. Do this so you will not miss an entry opportunity or be unaware of the overall trend.
As a beginner, until you have refined your strategy and develop risk management, take profits as low as 10%. A small profit can quickly become a much larger loss. With 0dte options, time will devour your profits even when the price doesn’t budge.
What makes this indicator so beginner friendly?
Charts with too many lines and colors are are a nightmare for beginners! And empty charts do not tell the whole story. Simple checkboxes in the configuration settings let you turn on and off features to match your comfort level. As you become more familiar you might try turning off the suggested entries to see if you would have selected the same or better ones yourself. Just one example of how you will learn and verify your knowledge. You will quickly spot Opening Range Breakouts and more.
Why are the triangle pointers not simply above or below the bars?
As a beginner, I like to review charts to see how much the price changed, then estimate how much a contract would move based on its delta. A mouthful, I know. But what price does an arrow pointing up below a bar reflect? Would I have entered at the open or close, low or high? This indicator helps by putting the marker close to the price when indicated. It can even display the actual price on the bar. This is helpful for you to make fast calculations without a measuring tool.
I am an experienced trader. Can this help me make winning trades?
Sure. It can also help you make losing ones! Profit is not guaranteed with any indicator or strategy. This indicator is designed to assist you as you learn and while you trade. You won't see the words BUY or SELL. This is not a signal bot! It is merely a tool to assist you. You can learn a lot by spending time observing price movement using this indicator without ever making a single trade.
🟡🔵🟢🔴

🟡🔵🟢🔴Beginner's Assistant by carljchapman🟡🔵🟢🔴
Overview
This indicator dynamically marks highs and lows of the premarket (4:00am-9:30amEST) and opening range. It displays Fair Value Gaps, 9 and 21 period Exponential Moving Averages (EMA) and the Volume Weighted Average Price (VWAP). To really help beginners, it marks suggested entry points on the chart with green or red triangles, when a reasonable trend appears.
Features
Automatically draws blue lines for Premarket High and Low values
Dynamically marks the opening Range region
Visual entry signals for long and short opportunities
Primarily used for stocks/funds , but works with forex and crypto
Quick configuration settings to tailor details for your experience level
Mobile friendly mode
Supports alerts
How To Use
Open your chart, and select a 1 or 2 minute timeframe.
Watch for green triangles and red triangles, hinting at entries for long or short positions. Pay particular attention to the price action as it approaches the bounds of the opening range and the premarket levels. As with any indicator, confirmation is helpful. I personally use MACD to confirm the direction of each probable trend.
For scalping 0dte contracts: You should switch very often between 1 and 2 min timeframes and look carefully for quality entry opportunities. TP (take profit) quickly with gains of 15% or more until you develop and refine your own strategy and risk management. Beginners like to see profit; just remember that a small profit is better than what could quickly become a large loss!
What makes this indicator so beginner friendly?
Charts with too many lines and colors are are a nightmare for beginners! And empty charts do not tell the whole story. Simple checkboxes in the configuration settings let you turn on and off features to match your comfort level. As you become more familiar you might try turning off the suggested entries to see if you would have selected the same or better ones yourself. Just one example of how you will learn and verify your knowledge. You will quickly spot Opening Range Breakouts and more.
Why are the triangle pointers not simply above or below the bars?
As a beginner, I like to review charts and see how much the price changed, to estimate how much a contract would move based on its delta. A mouthful, I know. But what price does an arrow pointing up below a bar reflect? Would I have entered at the open or close, low or high? This indicator helps by putting the marker close to the price when indicated. It can even display the actual price on the bar. This is helpful for you to make fast calculations without a measuring tool.
I am an experienced trader. Can this help me make winning trades?
Sure. It can also help you make losing trades! Profit is never guaranteed with any indicator or strategy. This indicator is designed to assist as you learn and trade. You won't see the words BUY or SELL. This is not a signal bot! It is merely a tool to assist you. You can learn a lot by just observing price movement while using this indicator without making a single trade.
🟡🔵🟢🔴

PM20/40/100/200 by Emprendetica📊 PM20/40/100/200 – Custom Moving Averages by Emprendetica
This indicator plots four simple moving averages (SMA): 20, 40, 100, and 200 periods. It’s designed for multi-timeframe traders who need quick and clear visualization of momentum and structural alignment across intraday and daily charts.
✅ Ideal for:
Detecting breakout readiness
Confirming trend strength (e.g., PM20 > PM40, PM100 > PM200)
Monitoring price structure with consistent dynamic support/resistance
📌 Created by Isaías Espinoza and the Emprendetica team.
🌐 More tools at: emprendetica.com

NSE/BSE Straddle/Strangle Candle ChartStraddle Candlestick Strategy Indicator
This custom Pine Script indicator is designed to visualize the price action of options using a candlestick chart for Nifty, BankNifty, FINNIFTY, and Midcap indices. It combines Call and Put options for multiple strikes around the underlying asset, creating a detailed view of market movement in a straddle strategy.
Key Features:
Candlestick Visualization: The indicator plots candlestick charts based on the combined price action of both Call and Put options, helping traders analyze price trends for different strikes.
Multi-Strike Options Analysis: It dynamically calculates and plots strike prices above and below the At-the-Money (ATM) strike, offering a comprehensive look at potential price movement across various strike levels.
Customizable Inputs: Users can adjust the strike interval, choose between different index symbols, and customize the appearance of the indicator (e.g., font size, table layout, and color themes).
User-Friendly Dashboard: A clear, customizable dashboard presents the strike price data, along with essential candlestick details, to help users understand the overall market trends at a glance.
Use Case:
This indicator is ideal for traders using straddle strategies on NSE options. It gives users a clear and intuitive visual representation of price action around the ATM strike, helping traders make informed decisions based on the options' movement.
Notes:
The VWAP (Volume-Weighted Average Price) is included for added insight, allowing traders to identify market direction and trends more effectively.
Focused on candlestick price action analysis, without including unnecessary indicators like RSI, Supertrend, or MA.
Perfect for options traders seeking clarity in price movement for better trade execution.

Position Size Calculator with Fees# Position Size Calculator with Portfolio Management - Manual
## Overview
The Position Size Calculator with Portfolio Management is an advanced Pine Script indicator designed to help traders calculate optimal position sizes based on their total portfolio value and risk management strategy. This tool automatically calculates your risk amount based on portfolio allocation percentages and determines the exact position size needed while accounting for trading fees.
## Key Features
- **Portfolio-Based Risk Management**: Calculates risk based on total portfolio value
- **Tiered Risk Allocation**: Separates trading allocation from total portfolio
- **Automatic Trade Direction Detection**: Determines long/short based on entry vs stop loss
- **Fee Integration**: Accounts for trading fees in position size calculations
- **Risk Factor Adjustment**: Allows scaling of position size up or down
- **Visual Display**: Shows all calculations in a clear, color-coded table
- **Automatic Risk Calculation**: No need to manually input risk amount
## Input Parameters
### Total Portfolio ($)
- **Purpose**: The total value of your investment portfolio
- **Default**: 0.0
- **Range**: Any positive value
- **Step**: 0.01
- **Example**: If your total portfolio is worth $100,000, enter 100000
### Trading Portfolio Allocation (%)
- **Purpose**: The percentage of your total portfolio allocated to active trading
- **Default**: 20.0%
- **Range**: 0.0% to 100.0%
- **Step**: 0.01
- **Example**: If you allocate 20% of your portfolio to trading, enter 20
### Risk from Trading (%)
- **Purpose**: The percentage of your trading allocation you're willing to risk per trade
- **Default**: 0.1%
- **Range**: Any positive value
- **Step**: 0.01
- **Example**: If you risk 0.1% of your trading allocation per trade, enter 0.1
### Entry Price ($)
- **Purpose**: The price at which you plan to enter the trade
- **Default**: 0.0
- **Range**: Any positive value
- **Step**: 0.01
### Stop Loss ($)
- **Purpose**: The price at which you will exit if the trade goes against you
- **Default**: 0.0
- **Range**: Any positive value
- **Step**: 0.01
### Risk Factor
- **Purpose**: A multiplier to scale your position size up or down
- **Default**: 1.0 (no scaling)
- **Range**: 0.0 to 10.0
- **Step**: 0.1
- **Examples**:
- 1.0 = Normal position size
- 2.0 = Double the position size
- 0.5 = Half the position size
### Fee (%)
- **Purpose**: The percentage fee charged per transaction
- **Default**: 0.01% (0.01)
- **Range**: 0.0% to 1.0%
- **Step**: 0.001
## How Risk Amount is Calculated
The script automatically calculates your risk amount using this formula:
```
Risk Amount = Total Portfolio × Trading Allocation (%) × Risk % ÷ 10,000
```
### Example Calculation:
- Total Portfolio: $100,000
- Trading Allocation: 20%
- Risk per Trade: 0.1%
**Risk Amount = $100,000 × 20 × 0.1 ÷ 10,000 = $20**
This means you would risk $20 per trade, which is 0.1% of your $20,000 trading allocation.
## Portfolio Structure Example
Let's say you have a $100,000 portfolio:
### Allocation Structure:
- **Total Portfolio**: $100,000
- **Trading Allocation (20%)**: $20,000
- **Long-term Investments (80%)**: $80,000
### Risk Management:
- **Risk per Trade (0.1% of trading)**: $20
- **Maximum trades at risk**: Could theoretically have 1,000 trades before risking entire trading allocation
## How Position Size is Calculated
### Trade Direction Detection
- **Long Trade**: Entry price > Stop loss price
- **Short Trade**: Entry price < Stop loss price
### Position Size Formulas
#### For Long Trades:
```
Position Size = -Risk Factor × Risk Amount / (Stop Loss × (1 - Fee) - Entry Price × (1 + Fee))
```
#### For Short Trades:
```
Position Size = -Risk Factor × Risk Amount / (Entry Price × (1 - Fee) - Stop Loss × (1 + Fee))
```
## Output Display
The indicator displays a comprehensive table with color-coded sections:
### Portfolio Information (Light Blue Background)
- **Portfolio (USD)**: Your total portfolio value
- **Trading Portfolio Allocation (%)**: Percentage allocated to trading
- **Risk as % of Trading**: Risk percentage per trade
### Trade Setup (Gray Background)
- **Entry Price**: Your specified entry price
- **Stop Loss**: Your specified stop loss price
- **Fee (%)**: Trading fee percentage
- **Risk Factor**: Position size multiplier
### Risk Analysis (Red Background)
- **Risk Amount**: Automatically calculated dollar risk
- **Effective Entry**: Actual entry cost including fees
- **Effective Exit**: Actual exit value including fees
- **Expected Loss**: Calculated loss if stop loss is hit
- **Deviation from Risk %**: Accuracy of risk calculation
### Final Result (Blue Background)
- **Position Size**: Number of shares/units to trade
## Usage Examples
### Example 1: Conservative Long Trade
- **Total Portfolio**: $50,000
- **Trading Allocation**: 15%
- **Risk per Trade**: 0.05%
- **Entry Price**: $25.00
- **Stop Loss**: $24.00
- **Risk Factor**: 1.0
- **Fee**: 0.01%
**Calculated Risk Amount**: $50,000 × 15% × 0.05% ÷ 100 = $3.75
### Example 2: Aggressive Short Trade
- **Total Portfolio**: $200,000
- **Trading Allocation**: 30%
- **Risk per Trade**: 0.2%
- **Entry Price**: $150.00
- **Stop Loss**: $155.00
- **Risk Factor**: 2.0
- **Fee**: 0.01%
**Calculated Risk Amount**: $200,000 × 30% × 0.2% ÷ 100 = $120
**Actual Risk**: $120 × 2.0 = $240 (due to risk factor)
## Color Coding System
- **Green/Red Header**: Trade direction (Long/Short)
- **Light Blue**: Portfolio management parameters
- **Gray**: Trade setup parameters
- **Red**: Risk-related calculations and results
- **Blue**: Final position size result
## Best Practices
### Portfolio Management
1. **Keep trading allocation reasonable** (typically 10-30% of total portfolio)
2. **Use conservative risk percentages** (0.05-0.2% per trade)
3. **Don't risk more than you can afford to lose**
### Risk Management
1. **Start with small risk factors** (1.0 or less) until comfortable
2. **Monitor your total exposure** across all open positions
3. **Adjust risk based on market conditions**
### Trade Execution
1. **Always validate calculations** before placing trades
2. **Account for slippage** in volatile markets
3. **Consider position size relative to liquidity**
## Risk Management Guidelines
### Conservative Approach
- Trading Allocation: 10-20%
- Risk per Trade: 0.05-0.1%
- Risk Factor: 0.5-1.0
### Moderate Approach
- Trading Allocation: 20-30%
- Risk per Trade: 0.1-0.15%
- Risk Factor: 1.0-1.5
### Aggressive Approach
- Trading Allocation: 30-40%
- Risk per Trade: 0.15-0.25%
- Risk Factor: 1.5-2.0
## Troubleshooting
### Common Issues
1. **Position Size shows 0**
- Verify all portfolio inputs are greater than 0
- Check that entry price differs from stop loss
- Ensure calculated risk amount is positive
2. **Very small position sizes**
- Increase risk percentage or risk factor
- Check if your risk amount is too small for the price difference
3. **Large risk deviation**
- Normal for very small positions
- Consider adjusting entry/stop loss levels
### Validation Checklist
- Total portfolio value is realistic
- Trading allocation percentage makes sense
- Risk percentage is conservative
- Entry and stop loss prices are valid
- Trade direction matches your intention
## Advanced Features
### Risk Factor Usage
- **Scaling up**: Use risk factors > 1.0 for high-confidence trades
- **Scaling down**: Use risk factors < 1.0 for uncertain trades
- **Never exceed**: Risk factors that would risk more than your comfort level
### Multiple Timeframe Analysis
- Use different risk factors for different timeframes
- Consider correlation between positions
- Adjust trading allocation based on market conditions
## Disclaimer
This tool is for educational and planning purposes only. Always verify calculations manually and consider market conditions, liquidity, and correlation between positions. The automated risk calculation assumes you're comfortable with the mathematical relationship between portfolio allocation and individual trade risk. Past performance doesn't guarantee future results, and all trading involves risk of loss.

MA Crossover Strategy with TP/SL (5 EMA Filter)How the Strategy Works on a 5-Minute Chart:
Data Input (5-Minute Candles):
Every single data point (candle) on your chart will represent 5 minutes of price action (Open, High, Low, Close for that 5-minute period).
All calculations (MAs, EMA, signals) will be based on these 5-minute price data points.
Moving Average Calculations:
Fast MA (10-period SMA): This will be the Simple Moving Average of the closing prices of the last 10 five-minute candles. It reacts relatively quickly to recent price changes.
Slow MA (30-period SMA): This will be the Simple Moving Average of the closing prices of the last 30 five-minute candles. It represents a slightly longer-term trend compared to the Fast MA.
5 EMA (5-period EMA): This is the Exponential Moving Average of the closing prices of the last 5 five-minute candles. Being an EMA, it gives more weight to the most recent 5-minute prices, making it very responsive to immediate price action.
Signal Generation (Entry Conditions):
Long Entry Signal:
The 10-period SMA crosses above the 30-period SMA (indicating a potential bullish shift in the short-to-medium term trend).
AND the current 5-minute candle's closing price is above the 5-period EMA (confirming that the immediate price momentum is also bullish and supporting the crossover).
If both conditions are met at the close of a 5-minute candle, a "Buy" signal is generated.
Short Entry Signal:
The 10-period SMA crosses below the 30-period SMA (indicating a potential bearish shift).
AND the current 5-minute candle's closing price is below the 5-period EMA (confirming immediate bearish momentum).
If both conditions are met at the close of a 5-minute candle, a "Sell" signal is generated.
Trade Execution:
When a signal is triggered, the strategy enters a trade (long or short) at the closing price of that 5-minute candle.
Immediately upon entry, it places two contingent orders:
Take Profit (Target): Set at 2% (by default) away from your entry price. For a long trade, it's 2% above; for a short trade, 2% below.
Stop Loss: Set at 1% (by default) away from your entry price. For a long trade, it's 1% below; for a short trade, 1% above.
The trade will remain open until either the Take Profit or Stop Loss price is hit by subsequent 5-minute candles.
Implications for Trading on a 5-Minute Chart:
Increased Trade Frequency: You will likely see many more signals and trades compared to higher timeframes (like 1-hour or daily charts). This means more potential opportunities but also more transaction costs (commissions, slippage).
Sensitivity to Noise: Lower timeframes are more prone to "market noise" – small, random price fluctuations that don't indicate a true trend. While the 5 EMA filter helps, some false signals might still occur.
Faster Price Action: Price movements can be very rapid on a 5-minute chart. Your take profit or stop loss levels might be hit very quickly, sometimes within the same or next few candles.
Parameter Optimization is Crucial: The default MA lengths (10, 30) and EMA (5) might not be optimal for every asset or market condition on a 5-minute chart. You'll need to backtest extensively and potentially adjust these lengths, as well as the targetPerc and stopPerc, to find what works best for the specific instrument you're trading.
Risk Management: The fixed percentage stop loss is vital on a 5-minute chart due to its volatility. Without it, a few unfavorable moves could lead to significant losses.

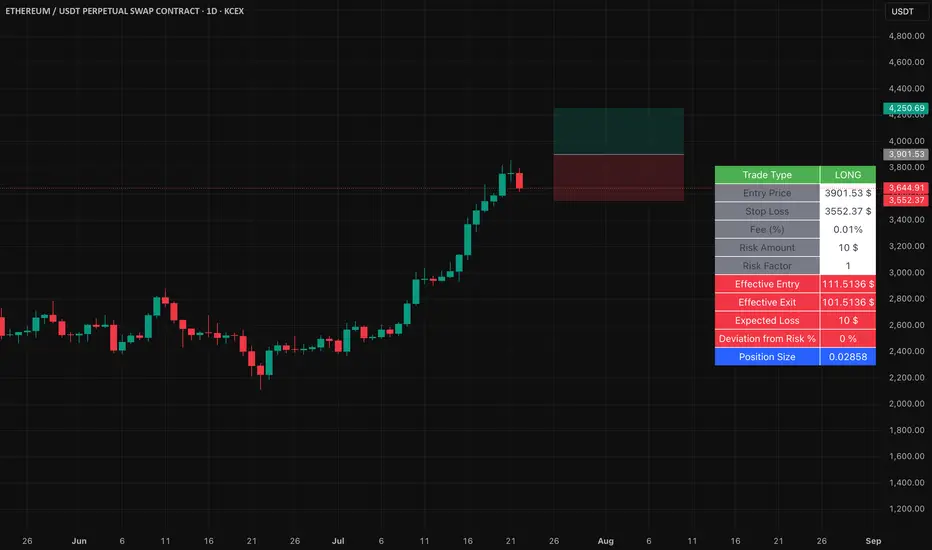
Easy Position Size Calculator with Fees# Easy Position Size Calculator with Fees - Manual
## Overview
The Easy Position Size Calculator is a Pine Script indicator designed to help traders calculate the optimal position size for their trades while accounting for trading fees. This tool automatically determines whether you're planning a long or short position and calculates the exact position size needed to risk a specific dollar amount.
## Key Features
- **Automatic Trade Direction Detection**: Determines if you're going long or short based on entry price vs stop loss
- **Fee Integration**: Accounts for trading fees in position size calculations
- **Risk Management**: Calculates position size based on your specified risk amount
- **Risk Factor Adjustment**: Allows you to scale your position size up or down
- **Visual Display**: Shows all calculations in a clear, organized table
## Input Parameters
### Entry Price ($)
- **Purpose**: The price at which you plan to enter the trade
- **Default**: 0.0
- **Range**: Any positive value
- **Step**: 0.01
### Stop Loss ($)
- **Purpose**: The price at which you will exit the trade if it goes against you
- **Default**: 0.0
- **Range**: Any positive value
- **Step**: 0.01
### Risk ($)
- **Purpose**: The maximum dollar amount you're willing to lose on this trade
- **Default**: 0.0
- **Range**: Any positive value
- **Step**: 0.01
### Risk Factor
- **Purpose**: A multiplier to scale your position size up or down
- **Default**: 1.0 (no scaling)
- **Range**: 0.0 to 10.0
- **Step**: 0.1
- **Examples**:
- 1.0 = Normal position size
- 2.0 = Double the position size
- 0.5 = Half the position size
### Fee (%)
- **Purpose**: The percentage fee charged per transaction (buy/sell)
- **Default**: 0.01% (0.01)
- **Range**: 0.0% to 1.0%
- **Step**: 0.001
## How It Works
### Trade Direction Detection
The script automatically determines your trade direction:
- **Long Trade**: Entry price > Stop loss price
- **Short Trade**: Entry price < Stop loss price
### Position Size Calculation
#### For Long Trades:
```
Position Size = -Risk Factor × Risk Amount / (Stop Loss × (1 - Fee) - Entry Price × (1 + Fee))
```
#### For Short Trades:
```
Position Size = -Risk Factor × Risk Amount / (Entry Price × (1 - Fee) - Stop Loss × (1 + Fee))
```
### Fee Adjustment
The script accounts for fees on both entry and exit:
- **Long trades**: You pay fees when buying (entry) and selling (exit)
- **Short trades**: You pay fees when shorting (entry) and covering (exit)
## Output Display
The indicator displays a table with the following information:
### Trade Information
- **Trade Type**: Shows whether it's a LONG, SHORT, or INVALID trade
- **Entry Price**: Your specified entry price
- **Stop Loss**: Your specified stop loss price
- **Fee (%)**: The fee percentage being used
### Risk Parameters
- **Risk Amount**: The dollar amount you're willing to risk
- **Risk Factor**: The multiplier being applied
### Calculated Values
- **Effective Entry**: The actual cost per share including fees
- **Effective Exit**: The actual exit value per share including fees
- **Expected Loss**: The calculated loss if stop loss is hit
- **Deviation from Risk %**: Shows how close the expected loss is to your target risk
- **Position Size**: The number of shares/units to trade
## Usage Examples
### Example 1: Long Trade
- Entry Price: $100.00
- Stop Loss: $95.00
- Risk Amount: $500.00
- Risk Factor: 1.0
- Fee: 0.01%
**Result**: The script will calculate how many shares to buy so that if the stop loss is hit, you lose approximately $500 (accounting for fees). Position Size: 99.61152
### Example 2: Short Trade
- Entry Price: $50.00
- Stop Loss: $55.00
- Risk Amount: $300.00
- Risk Factor: 1.0
- Fee: 0.01%
**Result**: The script will calculate how many shares to short so that if the stop loss is hit, you lose approximately $300 (accounting for fees). Position Size: 59.87426
## Important Notes
### Validation Requirements
For the script to work properly, all of the following must be true:
- Entry price > 0
- Stop loss > 0
- Risk amount > 0
- Entry price ≠ Stop loss (to determine direction)
### Negative Position Sizes
The script may show negative position sizes, which is normal:
- **Negative values for long trades**: Represents shares to buy
- **Negative values for short trades**: Represents shares to short
### Risk Deviation
The "Deviation from Risk %" shows how closely the calculated position size matches your target risk. Small deviations are normal due to:
- Fee calculations
- Rounding
- Market precision
## Color Coding
The table uses color coding for easy identification:
- **Green**: Long trade information
- **Red**: Short trade information
- **Gray**: Invalid trade (when inputs are incorrect)
- **Blue**: Final position size
- **Red background**: Risk-related calculations
## Troubleshooting
### Common Issues
1. **Position Size shows 0**
- Check that all inputs are greater than 0
- Ensure entry price is different from stop loss
2. **Trade Type shows INVALID**
- Verify that entry price and stop loss are both positive
- Make sure entry price ≠ stop loss
3. **Large Risk Deviation**
- This is normal for very small position sizes
- Consider adjusting your risk amount or price levels
## Best Practices
1. **Always validate your inputs** before placing actual trades
2. **Double-check the trade direction** shown in the table
3. **Review the expected loss** to ensure it aligns with your risk management
4. **Consider the effective entry/exit prices** which include fees
5. **Use appropriate risk factors** - avoid extreme values that could lead to overexposure
## Disclaimer
This tool is for educational and planning purposes only. Always verify calculations manually and consider market conditions, liquidity, and other factors before placing actual trades. The script assumes that fees are charged on both entry and exit transactions.
Option Maxpain & WallsThis simple script plots three lines on your chart based on options data: Call Wall, Put Wall and Max Pain. These three numbers must be obtained elsewhere. While Tradingview has delayed options data, to my knowledge Pinescript does not allow looping through this data to calculate the numbers within the script. So the user must obtain or calculate them elsewhere then type them into the input dialog. Labels and alerts are included as user options.

Fear and Greed Index [DunesIsland]The Fear and Greed Index is a sentiment indicator designed to measure the emotions driving the stock market, specifically investor fear and greed. Fear represents pessimism and caution, while greed reflects optimism and risk-taking. This indicator aggregates multiple market metrics to provide a comprehensive view of market sentiment, helping traders and investors gauge whether the market is overly fearful or excessively greedy.How It WorksThe Fear and Greed Index is calculated using four key market indicators, each capturing a different aspect of market sentiment:
Market Momentum (30% weight)
Measures how the S&P 500 (SPX) is performing relative to its 125-day simple moving average (SMA).
A higher value indicates that the market is trading well above its moving average, signaling greed.
Stock Price Strength (20% weight)
Calculates the net number of stocks hitting 52-week highs minus those hitting 52-week lows on the NYSE.
A greater number of net highs suggests strong market breadth and greed.
Put/Call Options (30% weight)
Uses the 5-day average of the put/call ratio.
A lower ratio (more call options being bought) indicates greed, as investors are betting on rising prices.
Market Volatility (20% weight)
Utilizes the VIX index, which measures market volatility.
Lower volatility is associated with greed, as investors are less fearful of large market swings.
Each component is normalized using a z-score over a 252-day lookback period (approximately one trading year) and scaled to a range of 0 to 100. The final Fear and Greed Index is a weighted average of these four components, with the weights specified above.Key FeaturesIndex Range: The index value ranges from 0 to 100:
0–25: Extreme Fear (red)
25–50: Fear (orange)
50–75: Neutral (yellow)
75–100: Greed (green)
Dynamic Plot Color: The plot line changes color based on the index value, visually indicating the current sentiment zone.
Reference Lines: Horizontal lines are plotted at 0, 25, 50, 75, and 100 to represent the different sentiment levels: Extreme Fear, Fear, Neutral, Greed, and Extreme Greed.
How to Interpret
Low Values (0–25): Indicate extreme fear, which may suggest that the market is oversold and could be due for a rebound.
High Values (75–100): Indicate greed, which may signal that the market is overbought and could be at risk of a correction.
Neutral Range (25–75): Suggests a balanced market sentiment, neither overly fearful nor greedy.
This indicator is a valuable tool for contrarian investors, as extreme readings often precede market reversals. However, it should be used in conjunction with other technical and fundamental analysis tools for a well-rounded view of the market.

Simulated OI Proxy with Trend Table1. In Simple Terms
This script mimics open interest analysis using price and volume changes.
It visually marks possible bullish and bearish setups directly on your price chart.
It’s especially useful for markets where real OI data is not available (like Indian stocks)
=======================================================================
2. Calculating Price and Volume Changes
close - close: Calculates the change in closing price from the previous bar to the current bar.
volume - volume: Calculates the change in trading volume from the previous bar to the current bar.
Purpose:
These calculations help determine if price and volume are increasing or decreasing, which is used as a proxy for open interest (OI) since real OI data may not be available.
===================================================================
3. Proxy Logic for OI Signals
long_buildup: Both price and volume are rising. This suggests new buying interest (bullish signal).
short_buildup: Price is falling but volume is rising. This suggests new short positions are being opened (bearish signal).
short_covering: Price is rising but volume is falling. This suggests shorts are closing their positions, causing a price rise (cautiously bullish).
long_unwinding: Both price and volume are falling. This suggests long positions are being closed (cautiously bearish).
====================================================================
4. Plotting the Signals
plotshape(condition, ...): Draws a shape on the chart when the condition is true.
Long Buildup: Green triangle below the bar (bullish).
Short Buildup: Red triangle above the bar (bearish).
Short Covering: Blue circle below the bar (cautiously bullish).
Long Unwinding: Orange circle above the bar (cautiously bearish).
======================================================================
5. Signal Detection:
The script checks price and volume changes to determine which signal is active.
Trend Assignment:
It assigns a text label and color for the detected trend.
Table Display:
A table appears at the top-right of your chart, showing the current trend based on the latest bar.

F&O Time Zones – Final Fixed📌 This indicator highlights high-probability intraday time zones used in Indian F&O (Futures & Options) strategies. Ideal for scalping, breakout setups, and trap avoidance.
🕒 Covered Time Zones:
• 9:15 – 9:21 AM → Flash Trades (first 1-minute volatility)
• 9:21 – 9:30 AM → Smart Money Trap (VWAP fakeouts)
• 9:30 – 9:50 AM → Fake Breakout Zone
• 9:50 – 10:15 AM → Institutional Entry Timing
• 10:15 – 10:45 AM → VWAP Range Scalps
• 10:45 – 11:15 AM → Second Trap Zone
• 11:15 – 1:00 PM → Trend Continuation Window
• 1:00 – 1:45 PM → Volatility Compression
• 1:45 – 2:15 PM → Institutional Exit Phase 1
• 2:15 – 2:45 PM → Trend Acceleration / Reversals
• 2:45 – 3:15 PM → Expiry Scalping Zone
• 3:15 – 3:30 PM → Dead Zone (square-off time)
🔧 Features:
✓ Clean vertical lines per zone
✓ Optional label positions (top or bottom)
✓ Adjustable line style, width, and color
🧠 Best used on: NIFTY, BANKNIFTY, FINNIFTY (5-min or lower)
---
🔒 **Disclaimer**:
This script is for **educational purposes only**. It is not financial advice. Trading involves risk. Please consult a professional or do your own research before taking any positions.
—
👤 Script by: **JoanJagan**
🛠️ Built in Pine Script v5

Options Strategy V1.3📈 Options Strategy V1.3 — EMA Crossover + RSI + ATR + Opening Range
Overview:
This strategy is designed for short-term directional trades on large-cap stocks or ETFs, especially when trading options. It combines classic trend-following signals with momentum confirmation, volatility-based risk management, and session timing filters to help identify high-probability entries with predefined stop-loss and profit targets.
🔍 Strategy Components:
EMA Crossover (Fast/Slow)
Entry signals are triggered by the crossover of a short EMA above or below a long EMA — a traditional trend-following method to detect shifts in momentum.
RSI Filter
RSI confirms the signal by avoiding entries in overbought/oversold zones unless certain momentum conditions are met.
Long entry requires RSI ≥ Long Threshold
Short entry requires RSI ≤ Short Threshold
ATR-Based SL & TP
Stop-loss is set dynamically as a multiple of ATR below (long) or above (short) the entry price.
Take-profit is placed as a ratio (TP/SL) of the stop distance, ensuring consistent reward/risk structure.
Opening Range Filter (Optional)
If enabled, the strategy only triggers trades after price breaks out of the 09:30–09:45 EST range, ensuring participation in directional moves.
Session Filters
No trades from 04:00 to 09:30 and from 16:00 to 20:00 EST, avoiding low-liquidity periods.
All open trades are closed at 15:55 EST, to avoid overnight risk or expiration issues for options.
⚙️ Built-in Presets:
You can choose one of the built-in ticker-specific presets for optimal conditions:
Ticker EMAs RSI (Long/Short) ATR SL×ATR TP/SL
SPY 8/28 56 / 26 14 1.4× 4.0×
TSLA 23/27 56 / 33 13 1.4× 3.6×
AAPL 6/13 61 / 26 23 1.4× 2.1×
MSFT 25/32 54 / 26 14 1.2× 2.2×
META 25/32 53 / 26 17 1.8× 2.3×
AMZN 28/32 55 / 25 16 1.8× 2.3×
You can also choose "Custom" to fully configure all parameters to your own market and strategy preferences.
📌 Best Use Case:
This strategy is especially suited for intraday options trading, where timing and risk control are critical. It works best on liquid tickers with strong trends or clear breakout behavior.
