Volume and Volatility Crisis Detector Volume + Volatility Crisis Detector Pro
Created by Alphaomega18
🎯 What is the Crisis Detector Pro?
The Volume + Volatility Crisis Detector Pro is an advanced indicator that combines:
8-Level Volume Analysis: Progressive detection of volume anomalies
Hedging Index: Measurement of institutional fear and protection activity
Progressive Crisis Detection: Identification of pre-crisis patterns like 1987 and 2008
📊 Indicator Components
1️⃣ Volume Ratio
Description:
Compares current volume to its 20-period moving average
Normal value: ~1.0 (volume = average)
High value: >2.0 (volume double the average)
Extreme value: >3.0 (volume triple the average)
8-Level Classification:
LevelRatioColorMeaning1< 1.25x⚪ GrayNormal volume21.25-1.5x🟢 GreenEarly alert31.5-1.75x🟡 Light YellowLight increase41.75-2.0x🟡 YellowModerate52.0-2.25x🟠 OrangeSignificant62.25-2.5x🟠 Dark OrangeVery high72.5-3.0x🔴 RedExtreme8> 3.0x🔴 Bright RedCRISIS
2️⃣ Hedging Index
Description:
Estimates institutional hedging activity (protection buying)
Based on: Weighted bearish volume + ATR volatility
Scale: 0.3 to 2.5 (like a Put/Call ratio)
Hedging Levels:
ValueColorMeaning< 0.7🟢 GreenNormal hedging0.7-1.0🟡 YellowElevated hedging1.0-1.3🟠 OrangeHigh hedging> 1.3🔴 RedPANIC - Extreme hedging
Interpretation:
Rising hedging = Institutions protecting → Market fear
Falling hedging = Confidence returning → Possible rebound
⚙️ Main Parameters
Calculations:
Moving Average Period: 20 (reference period for averages)
Volume Classification (8 Levels):
Level 1: 1.25x (early alert)
Level 2: 1.5x (light increase)
Level 3: 1.75x (moderate)
Level 4: 2.0x (significant)
Level 5: 2.25x (high)
Level 6: 2.5x (very high)
Level 7: 3.0x (extreme)
Level 8: > 3.0x (crisis)
Hedging:
Enable Hedging Detection: Enable/disable hedging index
Hedging Period: 14 (smoothing period)
Display:
Show Signals: Display visual signals
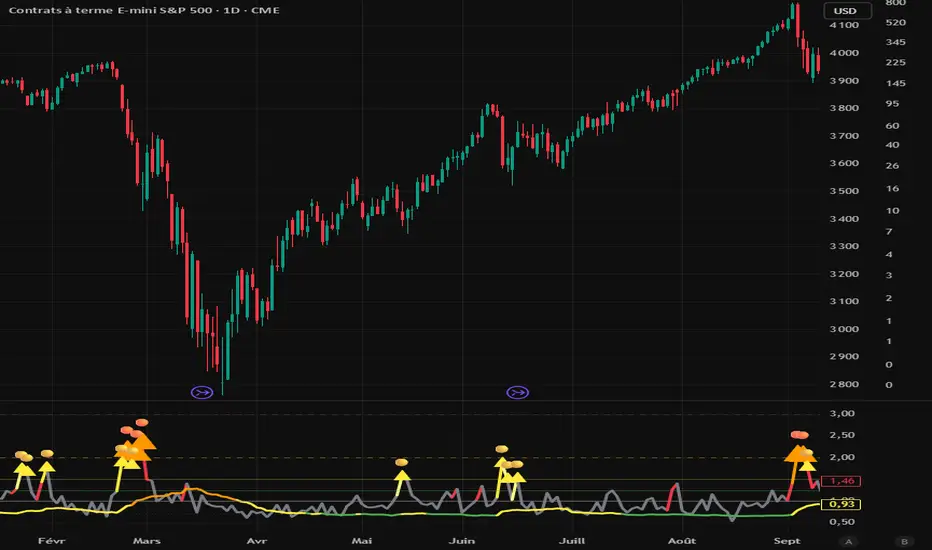
📈 Visual Elements
Main Lines:
Volume Ratio (thick colored line): Current volume ratio vs average
🛡️ Hedging Index (thick colored line): Institutional hedging index
Horizontal Threshold Lines:
For Volume:
1.0 = Normal (thick gray line)
1.25 = Level 1 (green dashed)
1.5 = Level 2 (yellow dashed)
2.0 = Level 4 (orange dashed)
3.0 = Level 7 (red dashed)
For Hedging:
0.7 = Normal (thin green dashed)
1.0 = High (thin orange dashed)
1.3 = PANIC (thin red dashed)
Visual Signals:
🔴 Red triangle: Extreme volume (level 7-8)
🟠 Orange triangle: High volume (level 5-6)
🟡 Yellow triangle: Moderate volume (level 3-4)
Colored Background:
Transparent red: Extreme volume or panic hedging
🎯 How to Use the Indicator
1. Installation
Open TradingView
Click "Indicators" at top of chart
Click "Pine Editor" at bottom
Paste the code
Click "Add to Chart"
2. Reading the Chart
Volume Ratio (main line):
Around 1.0 = Normal volume, no alert
Between 1.25 and 2.0 = Volume increasing, watch closely
Above 2.0 = Abnormal volume, strong activity
Above 3.0 = CRISIS - Extreme volume
Hedging Index (hedging line):
Around 0.7 = Calm market
Rising toward 1.0 = Growing nervousness
Above 1.3 = Institutional PANIC
3. Trading Strategies
🟢 Scalping/Day Trading:
Volume Ratio > 2.0:
Scalping opportunity in direction of movement
Quick entries with tight stops
Exit on activity spikes
Hedging Index > 1.0:
Nervous market = bounce opportunities
Wait for confirmation before entering
🟠 Swing Trading:
Volume Ratio > 2.5:
Avoid opening new swing positions
Protect existing positions (trailing stops)
Wait for return to normal (< 1.5)
Hedging Index > 1.3:
Panic = possible capitulation
Look for reversal opportunities
Wait for hedging to drop
🔴 Risk Management:
Volume RatioHedging IndexRecommended Action< 1.5< 0.7Normal trading1.5-2.00.7-1.0Increased monitoring2.0-3.01.0-1.3Reduce exposure 50%> 3.0> 1.3STOP trading / Protection
4. Crisis Patterns (1987/2008 Style)
Pre-Crisis Pattern:
Volume staying above 1.5x for 5+ days
With 3+ days above 2.0x
= Stress accumulation before explosion
Crisis Building Pattern:
5+ consecutive days above 2.0x
Hedging rising progressively
= Crisis is building
Immediate Crisis Pattern:
Volume > 3.0x
Hedging > 1.3
= Widespread PANIC
🔔 Configurable Alerts
The indicator includes 6 main alerts:
🟢 Level 1: First volume anomaly (1.25x)
🔴 Level 6+: Very high volume (2.25x+)
🔴🔴 CRISIS: Extreme volume (3.0x+)
🛡️ PANIC HEDGING: Panic hedging (1.3+)
Configuration:
Right-click on chart
"Create Alert"
Condition: Select desired alert
Options: Set frequency
Actions: Email, notification, webhook, etc.
💡 Real Use Cases
Example 1: Flash Crash
Volume Ratio: 4.5 (🔴)
Hedging Index: 1.8 (🔴)
Signal: EXTREME CRISIS
Action: Full protection, no new trades
Example 2: Fed Announcement
Volume Ratio: 2.3 (🟠)
Hedging Index: 1.1 (🟠)
Signal: High volume and hedging
Action: Reduce positions, wide stops
Example 3: Technical Squeeze
Volume Ratio: 2.8 (🔴)
Hedging Index: 0.9 (🟡)
Signal: Breakout without panic
Action: Follow movement with confirmation
Example 4: Capitulation
Volume Ratio: 3.5 (🔴)
Hedging Index: 1.5 → 0.8 (rapid drop)
Signal: Panic then relief
Action: Look for bounce opportunities
🔧 Parameter Optimization
Scalping (1-5 min):
Moving Average Period: 10
Level 1: 1.2x
Level 4: 1.8x
Level 7: 2.5x
Hedging Period: 7
Day Trading (15min-1H):
Moving Average Period: 20 (default)
All thresholds: Default
Hedging Period: 14 (default)
Swing Trading (4H-Daily):
Moving Average Period: 30-50
Level 1: 1.3x
Level 4: 2.2x
Level 7: 3.5x
Hedging Period: 20
Crypto (Very volatile):
Moving Average Period: 20
Level 1: 1.5x
Level 4: 2.5x
Level 7: 4.0x
Hedging Period: 14
⚠️ Limitations and Best Practices
❌ Limitations:
Hedging is estimated, not based on real Put/Call data
May give false signals in very volatile markets
Requires significant volume to be reliable
✅ Best Practices:
Always combine with classic technical analysis
Never trade solely on alerts
Adapt thresholds to your asset and timeframe
Backtest before using live
Respect your risk management plan
Golden Rule:
"The indicator detects anomalies, not direction. Always wait for confirmation before entering positions."
📈 Performance and Compatibility
✅ Real-time: Instant detection (0 lag)
✅ All markets: Stocks, Futures, Forex, Crypto
✅ All timeframes: 1min to Monthly
✅ Lightweight: Optimized, no slowdown
✅ Multi-platform: TradingView web, mobile, desktop
🎓 Historical Crises
1987 - Black Monday:
Volume Ratio: x5-x10 for several days
Pattern: Progressive increase then explosion
2008 - Lehman Brothers:
Volume Ratio: x3-x7 for weeks
Hedging: Historical record
Pattern: Prolonged stress then panic
2020 - COVID Crash:
Volume Ratio: x4-x8 in few days
Pattern: Rapid fall with intense panic
2022 - Crypto Winter:
Volume Ratio: x2-x4 over several months
Pattern: Successive capitulations
Pine Script® göstergesi