[DarkTrader] Range Level ProbabilityThis indicator calculates and visualizes significant price levels, such as swing highs, swing lows, and mid-price levels, using advanced mathematical functions and statistical methods. It aims to provide traders with insights into potential support and resistance areas by analyzing past price swings and their statistical properties.
Usage :
Identifying Support and Resistance: The projected swing high and swing low levels can act as potential support and resistance zones. Traders can use these levels to anticipate where the price might reverse or experience a pause in its movement.
Trend Analysis: By analyzing the mid-price level and its relationship to the swing high and low, traders can gain insights into the current market trend and potential price direction.
Customizing for Different Periods: Traders can adjust the input parameters, such as the period for calculating the mean and standard deviation, to tailor the indicator to different timeframes and market conditions.
Enhancing Trading Decisions: The indicator provides additional context for trading decisions by combining statistical analysis with visual projections, helping traders make more informed choices and manage risk effectively.
Key Features :
Statistical Analysis: The indicator utilizes statistical techniques to estimate the probability of future price movements. It calculates the likelihood of price reaching certain levels based on historical data, providing a probabilistic view of potential price targets.
Dynamic Range Calculation: It dynamically calculates important price levels based on a defined period. This period is adjustable, allowing traders to customize the indicator to fit different market conditions and trading strategies.
Customizable Appearance: Traders can customize the colors of the projected lines and labels, making it easier to distinguish between different levels and adjust the visual representation to their preferences.
Real-Time Updates: The indicator updates in real time with each new price bar, ensuring that the projected levels reflect the most current market conditions.
The indicator projects key price levels on the chart, including :
Swing High: The highest price level within a specified period.
Swing Low: The lowest price level within the same period.
Mid-Price: The average price between the swing high and swing low.
These levels are drawn as horizontal lines on the chart, extending into the future, which helps traders anticipate potential support and resistance zones.
Destek ve Direnç

Supply and Demand Zones
Script Introduction:
I have spent a long time searching for the perfect supply and demand zone indicator, but most of the ones I found were based on lines instead of proper zones, which didn’t quite meet my needs. After much trial and error, I decided to build my own indicator that generates clear and reliable supply and demand zones based on price swings and volatility. This indicator dynamically adjusts to market conditions, creating zones that are more responsive to price movements. Whether you're day trading or swing trading, this indicator will help you identify key price levels where buying and selling pressures exist.
Overview:
This indicator identifies supply and demand zones based on swing highs and lows, combined with market volatility. These zones represent areas where price is likely to experience reversals due to buying or selling pressures. The zones are displayed as rectangles (boxes) rather than lines, making it easier to visualize the areas of interest on the chart.
How the Indicator Works:
1. Supply Zones (Red Box):
- A supply zone is identified when the price forms a swing high (a local high point) and there is sufficient volatility (using ATR). The zone represents an area where sellers are likely to step in and push the price down.
2. Demand Zones (Green Box):
- A demand zone is identified when the price forms a swing low (a local low point) and volatility is sufficient. The zone represents an area where buyers are likely to step in and push the price up.
3. Extension Direction:
- You can control whether the zones extend to the left, to the right, or both directions. This lets you choose how far back or forward you want the zones to appear on the chart.
4. Volatility Filter (ATR Multiplier):
- The indicator uses the Average True Range (ATR) to filter out minor price movements. The ATR multiplier is hardcoded to 0.25, meaning that the indicator is more responsive to smaller price swings. This setting helps the zones adjust dynamically to changing market conditions.
How to Use the Indicator:
1. Adding to Chart:
- After publishing, you or invited users can apply the script to any chart. The indicator will automatically generate supply (red) and demand (green) zones.
2. Settings:
- Swing Length (Look-back Period): This controls how many bars back the script looks for significant swing highs and lows. Increasing this value will create zones based on larger swings.
- Extend Zone Horizontally (Bars): This controls how far the zones extend horizontally (left or right). You can adjust this to make the zones extend more or less on the chart.
- Extension Direction: Choose whether the zones extend to the left, right, or both directions. This gives flexibility on how you want the zones to display on the chart.
- Supply Zone Color: You can customize the color and opacity of the supply zone (default is red).
- Demand Zone Color: You can customize the color and opacity of the demand zone (default is green).
Best Practices for Trading:
- Combine with Other Indicators: While supply and demand zones are powerful on their own, combining this indicator with other tools like moving averages, volume analysis, or momentum indicators can provide further confirmation of potential price reversals.
- Watch for Price Action in Zones: When price approaches a supply or demand zone, watch for price action signals such as candlestick patterns (e.g., pin bars, engulfing candles) that can give you an idea of whether the zone will hold or break.
- Adjust for Different Timeframes: The indicator works well across different timeframes. Use a higher look-back period for larger timeframes (e.g., 4-hour, daily) and a lower look-back period for shorter timeframes (e.g., 5-minute, 15-minute charts).
Final Notes:
This script is intended to help traders identify key supply and demand zones and make better trading decisions. Since it dynamically adjusts to market volatility, it is well-suited for both day traders and swing traders who want to capture price reversals at significant levels.

[DarkTrader] Dynamic Level ProjectionThis indicator designed to enhance market analysis by projecting key price levels based on recent highs and lows. This script stands out by offering unique dynamic projections that are tailored to the latest market conditions, making it a valuable tool for both short-term and long-term traders.
Level Projection uses proprietary methods to dynamically project levels above and below recent price extremes. It employs two distinct scaling methods—Short Multiply (SM) and Long Multiply (LM)—to calculate these levels. The SM method is used to project resistance levels above recent highs, while the LM method projects support levels below recent lows. This approach ensures that the projected levels are responsive to current market trends and volatility.
How It Works :
The indicator analyzes recent market data to determine the highest and lowest prices over a customizable lookback period. Using the OHLC Lookback parameter, traders can set the duration for which these extreme prices are calculated. Based on these extremes, the indicator projects additional levels using the defined scaling methods. The result is a series of levels that help identify potential support and resistance zones in real time.
Customization Options :
Level Parameter: Defines the lengths for different projected levels.
OHLC Resolution: Selects the timeframe for OHLC data used in calculations.
Box Padding / Height: Controls the visual spacing of the projected levels on the chart.
Start Color and Extend Color: Customize the colors of the projected levels for better visual differentiation.
Real-Time Updates :
The indicator is designed to update in real-time, recalculating and redrawing levels with each new bar. This ensures that traders always see the most current projections and can make timely decisions based on the latest market data.
How to Use :
Traders should apply the indicator to their charts and customize the parameters according to their trading strategy. The projected levels will help in identifying potential support and resistance zones, which can be used to make informed trading decisions and manage risk effectively.

Support Resistance UltimateThe "Support Resistance ULTIMATE" indicator is a comprehensive tool for traders on the TradingView platform, designed to identify key support and resistance levels using two primary techniques: pivot points and volume data. This indicator provides flexibility and customization, allowing traders to adapt it to their specific trading strategies.
KEY FEATURES
Pivot-Based Levels:
This feature calculates support and resistance levels using pivot points, which are derived from the high, low, and close prices of previous trading periods. Pivot points are crucial for forecasting potential market turning points.
Users can customize the pivot calculation by selecting the source type (either 'Close' or 'High/Low') and adjusting the lookback periods for both the left and right sides of the pivot calculation. This flexibility allows traders to adapt the indicator to different market conditions and timeframes.
Volume-Based Levels:
This option focuses on identifying support and resistance levels based on volume data, specifically the Point of Control (POC). The POC represents the price level with the highest traded volume during a specific time period, reflecting a consensus value among market participants.
The indicator includes a rolling POC calculation, allowing traders to dynamically assess areas of significant trading interest that may serve as support or resistance zones.
ADVANTAGES
Customization and Flexibility:
Traders can choose between pivot-based and volume-based levels or use both simultaneously, depending on their analysis needs. This dual approach provides a comprehensive view of market dynamics, accommodating various trading styles.
The indicator offers customizable color settings for support and resistance lines, enhancing chart readability and allowing traders to personalize their visual analysis.
Enhanced Market Insights:
By utilizing pivot points, traders can identify potential reversal or consolidation points, aiding in the prediction of market trends and the establishment of strategic entry and exit points.
Volume-based levels provide insights into market sentiment and participation, highlighting areas of strong support or resistance based on trading volume. This can improve risk management and trade execution by identifying high-probability trading zones.
Importance Scoring:
The indicator calculates the importance of each level based on the number of touches and the duration it holds. This scoring system helps traders assess the strength of support and resistance levels, with thicker lines indicating more significant levels.
This indicator is intended for educational and informational purposes only and should not be considered financial advice. Trading involves significant risk, and you should consult with a financial advisor before making any trading decisions. The performance of this indicator is not guaranteed, and past results do not predict future performance. Use at your own risk.

First Candle High Low LevelsDescription
The "First Candle High Low Levels" Pine Script indicator is designed to highlight the high and low levels of the first candle of the day on your TradingView chart. It works across different timeframes and specifically handles the Indian stock market trading hours (9:15 AM to 3:30 PM IST). The script draws a box from the start to the end of the trading session, visually marking the price range defined by the first candle of the day. Traders can customize the box's border color, fill color, and line width.
Features
Customizable Timeframe: Users can select the desired timeframe for the first candle (e.g., 5-minute, 15-minute, etc.).
Custom Box Appearance: Options to adjust the border color, fill color, and line width of the drawn box.
Auto Reset for Each New Day: The high and low of the first candle are reset daily to mark the start of the next trading day.
Accurate Market Session Handling: The box is drawn from the start of the first candle to the end of the trading session (3:30 PM IST).
Usage
Adding to Chart: Apply the script by copying it into the Pine Script editor in TradingView. Once added, the script will automatically draw a box representing the high and low of the first candle of the day.
Select Timeframe: You can adjust the First Candle Timeframe input to define which timeframe candle will be used for marking the high and low. For example, if you choose a 5-minute timeframe, the high and low of the first 5-minute candle will be used.
Customization:
Adjust the Border Color and Box Fill Color through the input settings to match your chart's style.
Modify the Box Line Width to make the box lines more or less prominent.

CARNAC Trading - Dynamic Support and Resistance LevelsThe **CARNAC Trading - Dynamic Support and Resistance Levels** indicator is designed to help traders identify key support and resistance levels on any chart timeframe. This indicator dynamically detects major support and resistance levels based on historical price pivots and displays them as lines on the chart. The levels are color-coded for easy identification—**green lines** represent support levels below the current price, while **red lines** represent resistance levels above the current price.
Key Features:
- Dynamic Support/Resistance Detection**: Automatically identifies the strongest support and resistance levels on the chart.
- Timeframe Selection**: Allows users to choose a specific timeframe for detecting support and resistance levels, independent of the chart's timeframe.
- Pivot Strength and Lookback Period**: Customizable inputs to control how far back the indicator looks and how strong the pivots need to be for support/resistance detection.
- Level Limitation**: Limits the number of support and resistance lines to keep charts clean, ensuring only the most relevant levels are displayed.
---
How to Use the Indicator:
Inputs and Settings:
1. **Lookback Period**: Defines how many bars back the indicator will consider for detecting support and resistance levels. You can adjust this depending on how much historical data you want to include. A larger value will capture more significant levels, while a smaller value focuses on more recent price action.
2. **Pivot Strength**: This setting determines how significant a high or low must be to qualify as a pivot. A higher pivot strength will capture stronger, more critical levels, while a lower value will detect more frequent, minor pivots.
3. **Max Levels Above/Below Price**: This controls the maximum number of support and resistance levels displayed on each side of the current price. Keeping this number low helps reduce clutter and focuses on the most important levels.
4. **Timeframe for Support/Resistance Detection**: Select the timeframe used for detecting support and resistance levels, which can differ from the chart's timeframe. This is helpful when you're trading on shorter timeframes but want to see key levels from a higher timeframe (e.g., detecting daily levels while trading intraday).
---
Visualization:
- **Green Lines**: Represent support levels below the current price. These are potential areas where buying interest may increase, and the price could bounce upwards.
- **Red Lines**: Represent resistance levels above the current price. These are potential areas where selling interest may increase, and the price could fall downwards.
---
Example Usage:
1. **Identifying Support and Resistance Zones**: Use this indicator to identify critical support and resistance zones. These are areas where the price has historically reversed or paused, making them ideal for setting entry, exit, stop-loss, or take-profit levels.
2. **Trend Analysis**: By observing which side of the current price the majority of lines are on (more red or more green), traders can gauge whether the market is facing more resistance or support, helping them align with the current trend.
3. **Timeframe Flexibility**: You can choose to detect support and resistance levels from higher timeframes (e.g., Daily or Weekly) while trading on lower timeframes (e.g., 15-minute or 1-hour charts). This gives you a macro-level view of key price levels while executing trades on the micro-level.
---
Recommendations:
- **Swing Traders**: Use this indicator with a larger lookback period and higher pivot strength to capture major long-term support and resistance levels.
- **Scalpers and Intraday Traders**: Use shorter lookback periods and lower pivot strengths to detect key levels within a shorter timeframe.
By customizing the inputs and tailoring them to your trading style, this indicator can provide valuable insights into price levels where significant buying or selling activity is likely to occur, helping you make more informed trading decisions.
Revenue GridDescription:
The Revenue Grid indicator helps traders and investors visualize a stock’s valuation by plotting horizontal lines based on its price-to-sales (P/S) ratio. This tool displays how the stock price compares to multiples of its total revenue per share, giving a clear perspective on valuation benchmarks.
Fundamental Concept:
The price-to-sales ratio compares a company’s stock price to its revenue per share. It’s used to evaluate whether a stock is overvalued or undervalued based on its revenue.
This indicator offers a unique way to view this ratio by applying Fibonacci multiples to the revenue per share. It plots lines at these multiples to show how the stock price measures up against different valuation levels.
How It Works:
Data Inputs:
Total Revenue (TR): The company’s revenue over the past twelve months.
Total Shares Outstanding (TSO): The total number of shares in circulation.
Calculation:
Calculates the revenue per share (TR/TSO).
Plots lines at fixed Fibonacci multiples (e.g., 1x, 2x, 3x, 5x, 8x, 13x) of the revenue per share value.
How to Use:
1. Add the "Revenue Grid" indicator to your chart by searching for it in the indicator library and applying it.
2. Observe the lines plotted on the chart. If these lines are trending upwards, it indicates that the revenue is increasing.
3. Analyze how historical prices trend relative to these lines. Look for periods where the stock price supports around specific multiples, you can easily get a sense of overvaluation or undervaluation in certain periods.
Use this information to guide further analysis and investment decisions.
Benefits:
1. Clear Valuation View: Easily see how the company’s revenue translates into stock price levels.
2. Investment Insight: Identify if the stock price is lagging behind revenue growth, which might signal a buying opportunity.
3. Historical Context: Understand how the market has historically valued the company and assess the current valuation.
Do let me know your feedbacks in comments. Happy Investing :)

Grid Bot Parabolic [xxattaxx]🟩 The Grid Bot Parabolic, a continuation of the Grid Bot Simulator Series , enhances traditional gridbot theory by employing a dynamic parabolic curve to visualize potential support and resistance levels. This adaptability is particularly useful in volatile or trending markets, enabling traders to explore grid-based strategies and gain deeper market insights. The grids are divided into customizable trade zones that trigger signals as prices move into new zones, empowering traders to gain deeper insights into market dynamics and potential turning points.
While traditional grid bots excel in ranging markets, the Grid Bot Parabolic’s introduction of acceleration and curvature adds new dimensions, enabling its use in trending markets as well. It can function as a traditional grid bot with horizontal lines, a tilted grid bot with linear slopes, or a fully parabolic grid with curves. This dynamic nature allows the indicator to adapt to various market conditions, providing traders with a versatile tool for visualizing dynamic support and resistance levels.
🔑 KEY FEATURES 🔑
Adaptable Grid Structures (Horizontal, Linear, Curved)
Buy and Sell Signals with Multiple Trigger/Confirmation Conditions
Secondary Buy and Secondary Sell Signals
Projected Grid Lines
Customizable Grid Spacing and Zones
Acceleration and Curvature Control
Sensitivity Adjustments
📐 GRID STRUCTURES 📐
Beyond its core parabolic functionality, the Parabolic Grid Bot offers a range of grid configurations to suit different market conditions and trading preferences. By adjusting the "Acceleration" and "Curvature" parameters, you can transform the grid's structure:
Parabolic Grids
Setting both acceleration and curvature to non-zero values results in a parabolic grid.This configuration can be particularly useful for visualizing potential turning points and trend reversals. Example: Accel = 10, Curve = -10)
Linear Grids
With a non-zero acceleration and zero curvature, the grid tilts to represent a linear trend, aiding in identifying potential support and resistance levels during trending phases. Example: Accel =1.75, Curve = 0
Horizontal Grids
When both acceleration and curvature are set to zero, the indicator reverts to a traditional grid bot with horizontal lines, suitable for ranging markets. Example: Accel=0, Curve=0
⚙️ INITIAL SETUP ⚙️
1.Adding the Indicator to Your Chart
Locate a Starting Point: To begin, visually identify a price point on your chart where you want the grid to start.This point will anchor your grid.
2. Setting Up the Grid
Add the Grid Bot Parabolic Indicator to your chart. A “Start Time/Price” dialog will appear
CLICK on the chart at your chosen start point. This will anchor the start point and open a "Confirm Inputs" dialog box.
3. Configure Settings. In the dialog box, you can set the following:
Acceleration: Adjust how quickly the grid reacts to price changes.
Curve: Define the shape of the parabola.
Intervals: Determine the distance between grid levels.
If you choose to keep the default settings, with acceleration set to 0 and curve set to 0, the grid will display as traditional horizontal lines. The grid will align with your selected price point, and you can adjust the settings at any time through the indicator’s settings panel.
⚙️ CONFIGURATION AND SETTINGS ⚙️
Grid Settings
Accel (Acceleration): Controls how quickly the price reacts to changes over time.
Curve (Curvature): Defines the overall shape of the parabola.
Intervals (Grid Spacing): Determines the vertical spacing between the grid lines.
Sensitivity: Fine tunes the magnitude of Acceleration and Curve.
Buy Zones & Sell Zones: Define the number of grid levels used for potential buy and sell signals.
* Each zone is represented on the chart with different colors:
* Green: Buy Zones
* Red: Sell Zones
* Yellow: Overlap (Buy and Sell Zones intersect)
* Gray: Neutral areas
Trigger: Chooses which part of the candlestick is used to trigger a signal.
* `Wick`: Uses the high or low of the candlestick
* `Close`: Uses the closing price of the candlestick
* `Midpoint`: Uses the middle point between the high and low of the candlestick
* `SWMA`: Uses the Symmetrical Weighted Moving Average
Confirm: Specifies how a signal is confirmed.
* `Reverse`: The signal is confirmed if the price moves in the opposite direction of the initial trigger
* `Touch`: The signal is confirmed when the price touches the specified level or zone
Sentiment: Determines the market sentiment, which can influence signal generation.
* `Slope`: Sentiment is based on the direction of the curve, reflecting the current trend
* `Long`: Sentiment is bullish, favoring buy signals
* `Short`: Sentiment is bearish, favoring sell signals
* `Neutral`: Sentiment is neutral. No secondary signals will be generated
Show Signals: Toggles the display of buy and sell signals on the chart
Chart Settings
Grid Colors: These colors define the visual appearance of the grid lines
Projected: These colors define the visual appearance of the projected lines
Parabola/SWMA: Adjust colors as needed. These are disabled by default.
Time/Price
Start Time & Start Price: These set the starting point for the parabolic curve.
* These fields are automatically populated when you add the indicator to the chart and click on an initial location
* These can be adjusted manually in the settings panel, but he easiest way to change these is by directly interacting with the start point on the chart
Please note: Time and Price must be adjusted for each chart when switching assets. For example, a Start Price on BTCUSD of $60,000 will not work on an ETHUSD chart.
🤖 ALGORITHM AND CALCULATION 🤖
The Parabolic Function
At the core of the Parabolic Grid Bot lies the parabolic function, which calculates a dynamic curve that adapts to price action over time. This curve serves as the foundation for visualizing potential support and resistance levels.
The shape and behavior of the parabola are influenced by three key user-defined parameters:
Acceleration: This parameter controls the rate of change of the curve's slope, influencing its tilt or steepness. A higher acceleration value results in a more pronounced tilt, while a lower value leads to a gentler slope. This applies to both curved and linear grid configurations.
Curvature: This parameter introduces and controls the curvature or bend of the grid. A higher curvature value results in a more pronounced parabolic shape, while a lower value leads to a flatter curve or even a straight line (when set to zero).
Sensitivity: This setting fine-tunes the overall responsiveness of the grid, influencing how strongly the Acceleration and Curvature parameters affect its shape. Increasing sensitivity amplifies the impact of these parameters, making the grid more adaptable to price changes but potentially leading to more frequent adjustments. Decreasing sensitivity reduces their impact, resulting in a more stable grid structure with fewer adjustments. It may be necessary to adjust Sensitivity when switching between different assets or timeframes to ensure optimal scaling and responsiveness.
The parabolic function combines these parameters to generate a curve that visually represents the potential path of price movement. By understanding how these inputs influence the parabola's shape and behavior, traders can gain valuable insights into potential support and resistance areas, aiding in their decision-making process.
Sentiment
The Parabolic Grid Bot incorporates sentiment to enhance signal generation. The "Sentiment" input allows you to either:
Manually specify the market sentiment: Choose between 'Long' (bullish), 'Short' (bearish), or 'Neutral'.
Let the script determine sentiment based on the slope of the parabolic curve: If 'Slope' is selected, the sentiment will be considered 'Long' when the curve is sloping upwards, 'Short' when it's sloping downwards, and 'Neutral' when it's flat.
Buy and Sell Signals
The Parabolic Grid Bot generates buy and sell signals based on the interaction between the price and the grid levels.
Trigger: The "Trigger" input determines which part of the candlestick is used to trigger a signal (wick, close, midpoint, or SWMA).
Confirmation: The "Confirm" input specifies how a signal is confirmed ('Reverse' or 'Touch').
Zones: The number of "Buy Zones" and "Sell Zones" determines the areas on the grid where buy and sell signals can be generated.
When the trigger condition is met within a buy zone and the confirmation criteria are satisfied, a buy signal is generated. Similarly, a sell signal is generated when the trigger and confirmation occur within a sell zone.
Secondary Signals
Secondary signals are generated when a regular buy or sell signal contradicts the prevailing sentiment. For example:
A buy signal in a bearish market (Sentiment = 'Short') would be considered a "secondary buy" signal.
A sell signal in a bullish market (Sentiment = 'Long') would be considered a "secondary sell" signal.
These secondary signals are visually represented on the chart using hollow triangles, differentiating them from regular signals (filled triangles).
While they can be interpreted as potential contrarian trade opportunities, secondary signals can also serve other purposes within a grid trading strategy:
Exit Signals: A secondary signal can suggest a potential shift in market sentiment or a weakening trend. This could be a cue to consider exiting an existing position, even if it's currently profitable, to lock in gains before a potential reversal
Risk Management: In a strong trend, secondary signals might offer opportunities for cautious counter-trend trades with controlled risk. These trades could utilize smaller position sizes or tighter stop-losses to manage potential downside if the main trend continues
Dollar-Cost Averaging (DCA): During a prolonged trend, the parabolic curve might generate multiple secondary signals in the opposite direction. These signals could be used to implement a DCA strategy, gradually accumulating a position at potentially favorable prices as the market retraces or consolidates within the larger trend
Secondary signals should be interpreted with caution and considered in conjunction with other technical indicators and market context. They provide additional insights into potential market reversals or consolidation phases within a broader trend, aiding in adapting your grid trading strategy to the evolving market dynamics.
Examples
Trigger=Wick, Confirm=Touch. Signals are generated when the wick touches the next gridline.
Trigger=Close, Confirm=Touch. Signals require the close to touch the next gridline.
Trigger=SWMA, Confirm=Reverse. Signals are triggered when the Symmetrically Weighted Moving Average reverse crosses the next gridline.
🧠THEORY AND RATIONALE 🧠
The innovative approach of the Parabolic Grid Bot can be better understood by first examining the limitations of traditional grid trading strategies and exploring how this indicator addresses them by incorporating principles of market cycles and dynamic price behavior
Traditional Grid Bots: One-Dimensional and Static
Traditional grid bots operate on a simple premise: they divide the price chart into a series of equally spaced horizontal lines, creating a grid of trading zones. These bots excel in ranging markets where prices oscillate within a defined range. Buy and sell orders are placed at these grid levels, aiming to profit from mean reversion as prices bounce between the support and resistance zones.
However, traditional grid bots face challenges in trending markets. As the market moves in one direction, the bot continues to place orders in that direction, leading to a stacking of positions. If the market eventually reverses, these stacked trades can be profitable, amplifying gains. But the risk lies in the potential for the market to continue trending, leaving the trader with a series of losing trades on the wrong side of the market
The Parabolic Grid Bot: Adding Dimensions
The Parabolic Grid Bot addresses the limitations of traditional grid bots by introducing two additional dimensions:
Acceleration (Second Dimension): This parameter introduces a second dimension to the grid, allowing it to tilt upwards or downwards to align with the prevailing market trend. A positive acceleration creates an upward-sloping grid, suitable for uptrends, while a negative acceleration results in a downward-sloping grid, ideal for downtrends. The magnitude of acceleration controls the steepness of the tilt, enabling you to fine-tune the grid's responsiveness to the trend's strength
Curvature (Third Dimension): This parameter adds a third dimension to the grid by introducing a parabolic curve. The curve's shape, ranging from gentle bends to sharp turns, is controlled by the curvature value. This flexibility allows the grid to closely mirror the market's evolving structure, potentially identifying turning points and trend reversals.
Mean Reversion in Trending Markets
Even in trending markets, the Parabolic Grid Bot can help identify opportunities for mean reversion strategies. While the grid may be tilted to reflect the trend, the buy and sell zones can capture short-term price oscillations or consolidations within the broader trend. This allows traders to potentially pinpoint entry and exit points based on temporary pullbacks or reversals.
Visualize and Adapt
The Parabolic Grid Bot acts as a visual aid, enhancing your understanding of market dynamics. It allows you to "see the curve" by adapting the grid to the market's patterns. If the market shows a parabolic shape, like an upward curve followed by a peak and a downward turn (similar to a head and shoulders pattern), adjust the Accel and Curve to match. This highlights potential areas of interest for further analysis.
Beyond Straight Lines: Visualizing Market Cycle
Traditional technical analysis often employs straight lines, such as trend lines and support/resistance levels, to interpret market movements. However, many analysts, including Brian Millard, contend that these lines can be misleading. They propose that what might appear as a straight line could represent just a small part of a larger curve or cycle that's not fully visible on the chart.
Markets are inherently cyclical, marked by phases of expansion, contraction, and reversal. The Parabolic Grid Bot acknowledges this cyclical behavior by offering a dynamic, curved grid that adapts to these shifts. This approach helps traders move beyond the limitations of straight lines and visualize potential support and resistance levels in a way that better reflects the market's true nature
By capturing these cyclical patterns, whether subtle or pronounced, the Parabolic Grid Bot offers a nuanced understanding of market dynamics, potentially leading to more accurate interpretations of price action and informed trading decisions.
⚠️ DISCLAIMER⚠️
This indicator utilizes a parabolic curve fitting approach to visualize potential support and resistance levels. The mathematical formulas employed have been designed with adaptability and scalability in mind, aiming to accommodate various assets and price ranges. While the resulting curves may visually resemble parabolas, it's important to note that they might not strictly adhere to the precise mathematical definition of a parabola.
The indicator's calculations have been tested and generally produce reliable results. However, no guarantees are made regarding their absolute mathematical accuracy. Traders are encouraged to use this tool as part of their broader analysis and decision-making process, combining it with other technical indicators and market context.
Please remember that trading involves inherent risks, and past performance is not indicative of future results. It is always advisable to conduct your own research and exercise prudent risk management before making any trading decisions.
🧠 BEYOND THE CODE 🧠
The Parabolic Grid Bot, like the other grid bots in this series, is designed with education and community collaboration in mind. Its open-source nature encourages exploration, experimentation, and the development of new grid trading strategies. We hope this indicator serves as a framework and a starting point for future innovations in the field of grid trading.
Your comments, suggestions, and discussions are invaluable in shaping the future of this project. We welcome your feedback and look forward to seeing how you utilize and enhance the Parabolic Grid Bot.

Swing Failure Pattern SFP [TradingFinder] SFP ICT Strategy🔵 Introduction
The Swing Failure Pattern (SFP), also referred to as a "Fake Breakout" or "False Breakout," is a vital concept in technical analysis. This pattern is derived from classic technical analysis, price action strategies, ICT concepts, and Smart Money Concepts.
It’s frequently utilized by traders to identify potential trend reversals in financial markets, especially in volatile markets like cryptocurrencies and forex. SFP helps traders recognize failed attempts to breach key support or resistance levels, providing strategic opportunities for trades.
The Swing Failure Pattern (SFP) is a popular strategy among traders used to identify false breakouts and potential trend reversals in the market. This strategy involves spotting moments where the price attempts to break above or below a previous high or low (breakout) but fails to sustain the move, leading to a sharp reversal.
Traders use this strategy to identify liquidity zones where stop orders (stop hunt) are typically placed and targeted by larger market participants or whales.
When the price penetrates these areas but fails to hold the levels, a liquidity sweep occurs, signaling exhaustion in the trend and a potential reversal. This strategy allows traders to enter the market at the right time and capitalize on opportunities created by false breakouts.
🟣 Types of SFP
When analyzing SFPs, two main variations are essential :
Real SFP : This occurs when the price breaks a critical level but fails to close above it, then quickly reverses. Due to its clarity and strong signal, this SFP type is highly reliable for traders.
Considerable SFP : In this scenario, the price closes slightly above a key level but quickly declines. Although significant, it is not as definitive or trustworthy as a Real SFP.
🟣 Understanding SFP
The Swing Failure Pattern, or False Breakout, is identified when the price momentarily breaks a crucial support or resistance level but cannot maintain the movement, leading to a rapid reversal.
The pattern can be categorized as follows :
Bullish SFP : This type occurs when the price dips below a support level but rebounds above it, signaling that sellers failed to push the price lower, indicating a potential upward trend.
Bearish SFP : This pattern forms when the price surpasses a resistance level but fails to hold, suggesting that buyers couldn’t maintain the higher price, leading to a potential decline.
🔵 How to Use
To effectively identify an SFP or Fake Breakout on a price chart, traders should follow these steps :
Identify Key Levels: Locate significant support or resistance levels on the chart.
Observe the Fake Breakout: The price should break the identified level but fail to close beyond it.
Monitor Price Reversal: After the breakout, the price should quickly reverse direction.
Execute the Trade: Traders typically enter the market after confirming the SFP.
🟣 Examples
Bullish Example : Bitcoin breaks below a $30,000 support level, drops to $29,000, but closes above $30,000 by the end of the day, signaling a Real Bullish SFP.
Bearish Example : Ethereum surpasses a $2,000 resistance level, rises to $2,100, but then falls back below $2,000, forming a Bearish SFP.
🟣 Pros and Cons of SFP
Pros :
Effective in identifying strong reversal points.
Offers a favorable risk-to-reward ratio.
Applicable across different timeframes.
Cons :
Requires experience and deep market understanding.
Risk of encountering false breakouts.
Should be combined with other technical tools for optimal effectiveness.
🔵 Settings
🟣 Logical settings
Swing period : You can set the swing detection period.
SFP Type : Choose between "All", "Real" and "Considerable" modes to identify the swing failure pattern.
Max Swing Back Method : It is in two modes "All" and "Custom". If it is in "All" mode, it will check all swings, and if it is in "Custom" mode, it will check the swings to the extent you determine.
Max Swing Back : You can set the number of swings that will go back for checking.
🟣 Display settings
Displaying or not displaying swings and setting the color of labels and lines.
🟣 Alert Settings
Alert SFP : Enables alerts for Swing Failure Pattern.
Message Frequency : Determines the frequency of alerts. Options include 'All' (every function call), 'Once Per Bar' (first call within the bar), and 'Once Per Bar Close' (final script execution of the real-time bar). Default is 'Once per Bar'.
Show Alert Time by Time Zone : Configures the time zone for alert messages. Default is 'UTC'.
🔵 Conclusion
The Swing Failure Pattern (SFP), or False Breakout, is an essential analytical tool that assists traders in identifying key market reversal points for successful trading.
By understanding the nuances between Real SFP and Considerable SFP, and integrating this pattern with other technical analysis tools, traders can make more informed decisions and better manage their trading risks.

SMCL - Trend Change StructuresSMCL Indicator - Detailed Functionality
The SMCL (Structure Market Change Levels) indicator is designed to help traders visually detect and analyze changes in market structure. It focuses on identifying key pivot points and possible trend reversals by marking Change of Character (CHoCH) signals and calculating important levels like Premium and Discount zones.
Key Features:
Bullish and Bearish Structure Detection: Marks key trend changes on the chart using price pivots, with options to display only bullish or bearish structures.
Premium and Discount Zones Visualization: Identifies areas where the price may be in an overbought (Premium) or oversold (Discount) zone.
Win Rate Calculation: Calculates and displays the win rate on the chart to help you assess the indicator's effectiveness in real-time.
Full Customization: Adjust the colors of the structures and Premium/Discount zones to match your analysis style.
How to Use:
Bullish Structures: Look for CHoCH labels above recent highs indicating a potential shift to an uptrend.
Bearish Structures: Watch for CHoCH labels below recent lows indicating a potential shift to a downtrend.
Premium/Discount Levels: Use these zones to identify potential overbought or oversold conditions, ideal for planning entries or exits.
Win Rate: Monitor the win rate to gauge the reliability of the indicator over time.
This indicator is ideal for both intraday traders and swing traders looking for a simple yet powerful tool to identify market trend changes. Try it out and improve your trading decisions!
Technical Details:
1. Inputs:
Structure Period (prd): Defines the lookback period for detecting significant highs and lows (pivots). A higher period will consider a broader price range, identifying more prominent structures.
Response Period (resp): Determines how reactive the indicator is to recent price movements, affecting how quickly new structures are identified.
Show Bullish Structure (bull): A toggle to display bullish (uptrend) market structures on the chart.
Show Bearish Structure (bear): A toggle to display bearish (downtrend) market structures on the chart.
Show Premium & Discount (showPD): When enabled, the indicator will draw Premium (overbought) and Discount (oversold) levels on the chart.
2. Colors:
Bullish Color (bullColor): The color used to highlight bullish market structures.
Bearish Color (bearColor): The color used to highlight bearish market structures.
Premium Color (premColor): The color used to display the Premium (overbought) level.
Discount Color (discColor): The color used to display the Discount (oversold) level.
3. Structure Detection:
High and Low Pivot Points (Up, Dn): The indicator continuously tracks the highest and lowest prices over the specified structure period (prd). These pivot points are used to identify potential trend changes.
Change of Character (CHoCH) Detection:
When a new high is detected (Up > previous Up), it signifies a potential bullish trend change. A label with "CHoCH" is placed on the chart, if bullish structures are enabled.
Similarly, when a new low is detected (Dn < previous Dn), it signifies a potential bearish trend change. A "CHoCH" label is placed if bearish structures are enabled.
4. Premium & Discount Levels:
Premium Level (PremiumTop): Calculated as 10% below the detected high pivot. It represents a zone where the price may be considered overbought, suggesting a possible reversal or pullback.
Discount Level (DiscountTop): Calculated as 10% above the detected low pivot. It represents a zone where the price may be considered oversold, suggesting a possible buying opportunity.
These levels are drawn on the chart if the showPD option is enabled, helping traders visually assess the market's condition.
5. Probability Calculation:
Win Rate Calculation (WinRate): The indicator tracks the number of times the market structure changes from bullish to bearish and vice versa. It calculates the win rate as the ratio of bullish to bearish changes, providing insight into the strength of the detected structures.
This win rate is displayed on the chart in the latest bar, giving a real-time assessment of the indicator's performance.
6. Display Options:
The indicator offers full customization of colors and visibility for different components, allowing traders to tailor the visuals to their preferences.
Labels and lines are drawn with a 50% opacity by default, making them less intrusive while still visible on the chart.

Uptrick: Logarithmic Crypto Bands
Description :
Introduction
The `Uptrick: Logarithmic Crypto Bands` indicator introduces an innovative approach to technical analysis tailored specifically for the cryptocurrency markets. By leveraging logarithmic transformations combined with dynamic exponential bands, this indicator offers a sophisticated method for identifying critical support and resistance levels, assessing market trends, and evaluating volatility. Its unique approach stands out from traditional indicators by addressing the specific challenges of high volatility and erratic price movements inherent in cryptocurrency trading.
Originality and Usefulness
** 1. Unique Logarithmic Transformation: **
- Innovation : Unlike traditional indicators that often use raw price data, the Uptrick: Logarithmic Crypto Bands applies a logarithmic transformation to the closing prices: logPrice = math.log(close). This approach is original because it reduces the impact of extreme price fluctuations, providing a smoother and more stable price series. This transformation addresses a common issue in cryptocurrency markets where large price swings can obscure true market trends.
- Advantage : The logarithmic transformation compresses the price range, which allows traders to better identify long-term trends and reduce the noise caused by outlier price movements. This results in a more reliable basis for analysis and enhances the ability to detect meaningful market patterns.
**2. Dynamic Exponential Bands :**
- Innovation : The indicator employs exponential calculations to derive dynamic support and resistance levels based on a central base line : baseLine * math.pow(multiplier, n). Unlike static bands that remain fixed regardless of market conditions, these bands adjust dynamically according to market volatility.
- Advantage : The dynamic nature of the bands provides a more responsive and adaptive tool for traders. As market volatility changes, the bands widen or narrow accordingly, offering a more accurate reflection of potential support and resistance levels. This adaptability improves the tool's effectiveness in varying market conditions compared to static or traditional bands.
Detailed Description and Substantiation
**1. Logarithmic Price Calculation :**
- Code : ` logPrice = math.log(close)
- Description : This calculation converts the closing price into its logarithmic value. By compressing the price range, it minimizes the distortion caused by extreme price movements, which can be particularly pronounced in the volatile cryptocurrency markets.
- Purpose : To provide a stabilized price series that facilitates more accurate trend analysis and reduces the influence of erratic price fluctuations.
**2. Moving Averages of Logarithmic Prices :**
- ** Long-Term Moving Average :**
- Code : maLongLogPrice = ta.sma(logPrice, longLength)
longLength = 2000
- ** Description : A simple moving average of the logarithmic price over a long period. This average helps filter out short-term noise and provides insight into the long-term market trend.
- Purpose : To offer a perspective on the overall market direction, making it easier to identify enduring trends and distinguish them from short-term price movements.
- Short-Term Moving Average :
- Code : maShortLogPrice = ta.sma(logPrice, shortLength) shortLength = 900
- Description : A simple moving average of the logarithmic price over a shorter period. This component captures more immediate price trends and potential reversal points.
- Purpose : To detect short-term trends and changes in market direction, allowing traders to make timely trading decisions based on recent price action.
**3. Base Line Calculation :**
- Code : baseLine = math.exp(maShortLogPrice)
- Description : Converts the short-term moving average of the logarithmic price back to the original price scale. This base line serves as the central reference point for calculating the surrounding bands.
- Purpose : To establish a benchmark level from which the exponential bands are calculated, providing a central reference for assessing potential support and resistance levels.
**4. Band Calculation and Plotting :**
- ** Code :**
- Band 1: plot(baseLine * math.pow(multiplier, 1), color=color.new(color.yellow, 20), linewidth=1, title="Band 1")
- Band 2: plot(baseLine * math.pow(multiplier, 2), color=color.new(color.yellow, 20), linewidth=1, title="Band 2")
- Band 3: plot(baseLine * math.pow(multiplier, 3), color=color.new(color.yellow, 20), linewidth=1, title="Band 3")
- Band 4: plot(baseLine * math.pow(multiplier, 4), color=color.new(color.yellow, 20), linewidth=1, title="Band 4")
- Band 5: plot(baseLine * math.pow(multiplier, 5), color=color.new(color.yellow, 10), linewidth=1, title="Band 5")
- Band 6: plot(baseLine * math.pow(multiplier, 6), color=color.new(color.yellow, 0), linewidth=1, title="Band 6")
- * Multiplier : Set at 1.3, adjusts the spacing between bands to accommodate varying levels of market volatility.
- Description : Bands are plotted at exponential intervals from the base line. Each band represents a potential support or resistance level, with the spacing between them increasing exponentially. The color opacity of each band indicates its level of significance, with closer bands being more relevant for immediate trading decisions.
** How to Use the Indicator :**
**1. Identifying Support and Resistance Levels :**
- Support Levels : The lower bands, closer to the base line, can act as potential support levels. When the price approaches these bands from above, they may indicate areas where the price could stabilize or reverse direction.
- Resistance Levels : The upper bands, further from the base line, serve as resistance levels. When the price nears these bands from below, they can act as barriers to price movement, potentially leading to reversals or stalls.
**2. Confirming Trends :**
- Uptrend Confirmation : When the price consistently remains above the base line and moves towards higher bands, it signals a strong bullish trend. This confirmation helps traders capitalize on upward price movements.
- Downtrend Confirmation : When the price stays below the base line and approaches lower bands, it indicates a bearish trend. This confirmation assists traders in acting on downward price movements.
3. Analyzing Volatility :
- Wide Bands : Wider spacing between bands reflects higher market volatility. This indicates a more turbulent trading environment, where price movements are less predictable. Traders may need to adjust their strategies to handle increased volatility.
- Narrow Bands : Narrower bands suggest lower volatility and a more stable market environment. This can result in more predictable price movements and clearer trading signals.
**4. Entry and Exit Points :**
- Entry Points : Consider buying when the price bounces off the base line or a band, which could signal support in an uptrend.
- Exit Points : Evaluate selling or taking profits when the price nears upper bands or shows signs of reversal at these levels. This approach helps in locking in gains or minimizing losses during a downtrend.
**Chart Example:**
Here you can see how the price reacted getting closer to this level. All green circles show a bounce-off. So just from looking at the chart we can see a potential bounce again pretty soon.
** Disclosure :**
- ** Performance Claims :** The `Uptrick: Logarithmic Crypto Bands` indicator is designed to assist traders in analyzing price levels and trends. It is important to understand that this tool provides historical data analysis and does not guarantee future performance. The features and benefits described are based on historical market behavior and should not be seen as a prediction of future results. Traders should use this indicator as part of a broader trading strategy and consider other factors before making trading decisions.

Institutional Demand Supply IndicatorINTRODUCTION
Institutional demand and supply zones are key areas on a price chart where large institutional traders, such as banks and hedge funds, place significant buy or sell orders. These zones often act as strong support or resistance levels due to the substantial volume of trades executed by institutions.
There are various ways to identify these areas of interest on the charts, but the main goal is to study the price movements, especially significant ones. Large financial entities tend to operate in the same price areas repeatedly. Instead of chasing price movements and risking counter moves, it's better to wait for the price to return to these areas, expecting that these entities will buy or sell there again.
INDICATOR SETTINGS:
1. High Probability Zones (HPZ) - High Probability Zones (HPZ) are demand and supply zones identified using advanced calculations to highlight the most relevant and significant areas. These zones have a higher probability of impacting price movements. Better to keep it turned On.
2. Zone Extension? - Extending zones can be useful for identifying areas that have already been retraced as these zones may continue to influence market dynamics despite the retracement.
3. Zone Type - This option lets you select the zone layout type. 4 options are given which are self explanatory.
4. Directional Candle Count - This option keeps a count of number of consecutive bullish / bearish candle that you would like to set as qualifying parameter for demand / supply zone. For Example - If you keep the number 1, the script will draw a demand or supply zone by just checking if 1 candle has met all the criteria's and calculations.
5. Zone Validity Percentage - You can set the percent change for the number of candles mentioned in point 4 above.
6. HPZ - Keep the number between 6 to 10. As you move the number up, less number of zones will be displayed.
7. Zone Count - You can adjust the number of visible demand and supply zones on the chart. Increase this number if you want to display more zones, or decrease it if the chart becomes too cluttered.
D I S P L A Y
1. Background Color Demand / Supply Zone - This is the background color of demand and supply zone.
2. Channel Color Demand / Supply Zone - This is the color of channel.
3. Channel Line Style - Choose between Solid, dotted or dashed.
4. Background Color Transparency - Choose the transparency of background color
5. Channel Line Width - Choose Channel line width between 1 to 4.
6. Channel Line Transparency - Choose Channel Line Transparency and keep it between 1 to 100.
Sometimes, a level may be breached on one timeframe, but that doesn’t mean the indicator is not working. To understand the price action better, switch to a different timeframe to check why that level was breached and why it found support at a different zone on another timeframe. Look at the 2 screenshots below.
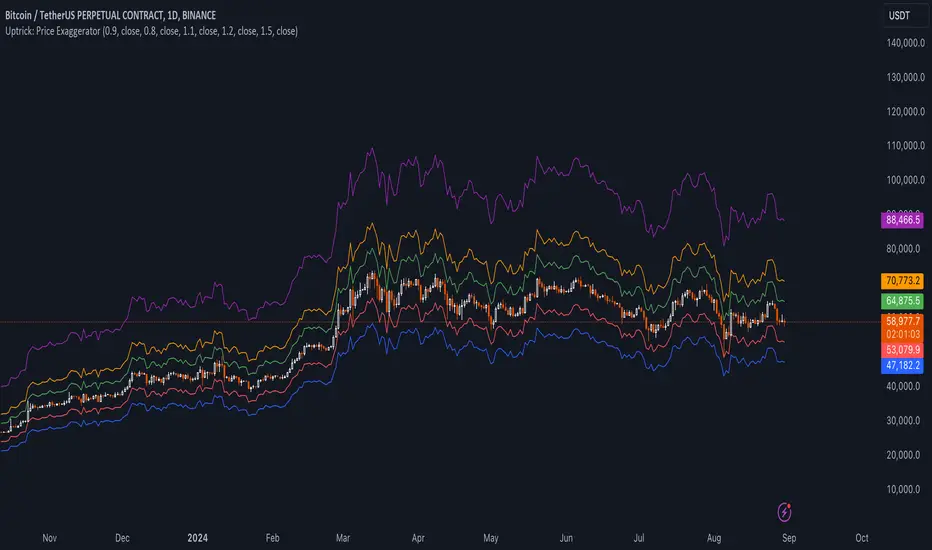
Uptrick: Price Exaggerator
## Uptrick: Price Exaggerator
** Purpose and Overview **:
The "Uptrick: Price Exaggerator" is an innovative Pine Script™ indicator that provides traders with a unique way to visualize potential price extremes. Unlike traditional indicators that focus on historical price data or statistical patterns, this script applies dynamic multipliers to the asset’s closing price to project exaggerated price levels. This approach offers fresh insights into potential market extremes and can be particularly useful for identifying possible overbought or oversold conditions.
** Functionality **:
- ** Dynamic Price Exaggeration **: This script applies a range of multipliers to the closing price to generate several projected price levels. These levels are plotted as lines on the chart, helping traders visualize potential future price extremes beyond typical market ranges.
- ** Highly Customizable **: Users can adjust multipliers, select different source prices (like open, high, low), and choose colors to match their trading strategies and preferences.
- ** Real-Time Updates **: The plotted levels update in real-time, reflecting the latest market conditions and providing an ongoing perspective on potential price extremes.
** Detailed Inputs and Configuration **:
1. ** Multiplier Settings **:
- ** Purpose **: Adjusts the degree of price exaggeration to visualize potential extreme price levels.
- ** Inputs **:
- **Multiplier 1**: Default 0.9 (90% of the source price)
- **Multiplier 2**: Default 0.8 (80% of the source price)
- **Multiplier 3**: Default 1.1 (110% of the source price)
- **Multiplier 4**: Default 1.2 (120% of the source price)
- **Multiplier 5**: Default 1.5 (150% of the source price)
- ** Impact **: Higher multipliers show more distant potential levels, indicating possible resistance or support at extreme levels. Lower multipliers highlight nearer levels, suggesting smaller potential movements.
2. ** Source Price Selection **:
- ** Purpose **: Determines the base data for calculating exaggerated price levels.
- **Inputs**:
- **Source 1**: Default is closing price (can be customized)
- **Source 2**: Default is closing price
- **Source 3**: Default is closing price
- **Source 4**: Default is closing price
- **Source 5**: Default is closing price
- ** Customization **: Users can select various sources (e.g., open, high, low) for each multiplier, tailoring the tool to their analytical needs.
3. ** Color Customization **:
- ** Purpose **: Enhances visual clarity by distinguishing between different exaggerated levels.
- **Inputs**:
- **Color 1**: Default red
- **Color 2**: Default blue
- **Color 3**: Default green
- **Color 4**: Default orange
- **Color 5**: Default purple
- ** Customization **: Colors can be adjusted to fit user preferences and chart color schemes.
4. ** Plotting the Lines **:
- ** Purpose **: Provides a visual representation of potential future price extremes on the chart.
- ** Implementation **: Lines are plotted based on the selected multipliers and source prices, offering a clear view of potential price scenarios.
** Using the Script for Market Analysis **:
1. ** Identifying Overbought Conditions **:
- ** Method **: Observe exaggerated price levels above the current market price. Approaching or exceeding higher multiplier levels may indicate overbought conditions.
- ** Analysis **: These levels can act as potential resistance zones where price reversals or consolidations might occur.
2. ** Spotting Oversold Conditions **:
- ** Method **: Observe exaggerated price levels below the current market price. If the price approaches or falls below lower multiplier levels, it may suggest oversold conditions.
- ** Analysis **: These levels might serve as support zones where price bounces or stabilization could happen.
3. ** Detecting Smaller Movements **:
- **Detailed Examination**: Lower multiplier levels can highlight minor support and resistance levels, useful for traders focusing on smaller price fluctuations.
- ** Fine-Tuning **: Adjust multipliers to zoom in on specific price ranges and better detect small market movements.
** How to Use the Script **:
1. ** Add the Script to Your Chart **:
- Scroll to the bottom of this description and right where there is the source code, click ' Add to Favourites ' - Now you can go to a chart, go to your ' favorites ', and you will find it there.
2. ** Configure Inputs **:
- Click the gear icon next to the script in the indicators panel to open settings.
- Adjust multipliers, source prices, and colors according to your analysis needs.
3. ** Interpret the Levels **:
- Analyze the plotted levels to assess potential overbought or oversold conditions and identify possible price extremes.
- Combine insights with other indicators and patterns for more informed trading decisions.
** Conceptual Framework **:
The "Uptrick: Price Exaggerator" offers a novel approach to market analysis by exaggerating price levels through dynamic multipliers. This unique method extends beyond conventional indicators, providing traders with a different perspective on potential price movements and market extremes. By customizing inputs and visualizing potential price scenarios, this script enhances market analysis and supports diverse trading strategies.
** Originality and Uniqueness **:
This script stands out by applying dynamic multipliers to the source price, offering a fresh way to anticipate potential market extremes. Unlike standard indicators, which often rely on historical data or statistical methods, the "Uptrick: Price Exaggerator" provides a distinctive view of future price levels. Its customizable features and real-time updates offer traders a flexible tool that can adapt to various market conditions and personal trading styles.
Unicorn ICT Signals [TradingFinder] Breaker Block + FVG Zones🔵 Introduction
The "ICT Unicorn Model" trading strategy in the "Inner Circle Trader" (ICT) style is one of the well-known strategies in the world of Forex and financial market trading.
The ICT methodology was developed by Michael Huddleston and is based on technical analysis and Price Action concepts.
This style focuses specifically on interpreting price movements and identifying optimal entry and exit points in the market.
In the Unicorn strategy, traders seek points where the probability of price reversal or trend continuation is high. This strategy is primarily based on recognizing and analyzing Price Action patterns and market structure.
By understanding"ICT Unicorn Model", traders can make more informed decisions about where to enter or exit trades, thereby increasing their chances of success in the market.
🟣 Understanding the Breaker Block
A Breaker Block is a specialized form of an Order Block that changes its role after a key market level is broken. Typically, an Order Block is an area on the chart where large institutional orders are likely to be placed, providing strong support or resistance.
However, when this area is breached, and the price moves in the opposite direction, it transforms into what is known as a Breaker Block. This shift indicates a reversal in market sentiment, turning the previous support into resistance or vice versa, thereby signaling a potential trend change to traders.
🟣 The Significance of the Fair Value Gap (FVG)
The Fair Value Gap (FVG) refers to an area on a price chart where the price rapidly moves through a level, leaving behind a gap. This gap represents an imbalance between supply and demand and is often seen as a potential area for price to return and fill the gap.
These zones are crucial for traders as they can indicate future price movements, providing opportunities to enter or exit trades.
🟣 Defining the ICT Unicorn Model
When an FVG overlaps with a Breaker Block, it forms a highly significant trading area known as a Unicorn. This overlap creates an ideal zone for traders to enter the market, as it combines two powerful technical signals.
The Unicorn Model is therefore considered an optimal strategy for identifying precise entry and exit points in the financial markets.
Demand ICT Unicorn Model :
Supply ICT Unicorn Model :
🔵 How to Use
🟣 Bullish ICT Unicorn
The Bullish ICT Unicorn model is applicable when the market is in an uptrend, and traders are seeking buying opportunities.
Follow these steps to identify Bullish ICT Unicorn :
Identify the Bullish Breaker Block : Locate an area where the price moved upward after breaking an Order Block. This area now acts as a Breaker Block.
Identify the Bullish FVG : Look for a Fair Value Gap near the Breaker Block.
Confirm the Unicorn : When the Bullish Breaker Block and Bullish FVG overlap, a Bullish Unicorn is confirmed. Traders can enter a buy position when the price returns to this zone.
🟣Bearish ICT Unicorn
The Bearish ICT Unicorn model is used when the market is in a downtrend, and traders are looking for selling opportunities.
To identify Bearish ICT Unicorn, follow these steps :
Identify the Bearish Breaker Block : Find an area where the price moved downward after breaking an Order Block. This area now acts as a Breaker Block.
Identify the Bearish FVG : Check if a Fair Value Gap has formed near the Breaker Block.
Confirm the Unicorn : When the Bearish Breaker Block and Bearish FVG overlap, a Bearish Unicorn is confirmed. Traders can enter a sell position when the price returns to this zone.
🔵 Setting
🟣 Global Setting
Pivot Period of Order Blocks Detector : Enter the desired pivot period to identify the Order Block.
Order Block Validity Period (Bar) : You can specify the maximum time the Order Block remains valid based on the number of candles from the origin.
Mitigation Level Breaker Block : Determining the basic level of a Breaker Block. When the price hits the basic level, the Breaker Block due to mitigation.
Mitigation Level FVG : Determining the basic level of a FVG. When the price hits the basic level, the FVG due to mitigation.
Mitigation Level Unicorn : Determining the basic level of a Unicorn Block. When the price hits the basic level, the Unicorn Block due to mitigation.
🟣 Unicorn Block Display
Show All Unicorn Block : If it is turned off, only the last Order Block will be displayed.
Demand Unicorn Block : Show or not show and specify color.
Supply Unicorn Block : Show or not show and specify color.
🟣 Breaker Block Display
Show All Breaker Block : If it is turned off, only the last Breaker Block will be displayed.
Demand Main Breaker Block : Show or not show and specify color.
Demand Sub (Propulsion & BoS Origin) Breaker Block : Show or not show and specify color.
Supply Main Breaker Block : Show or not show and specify color.
Supply Sub (Propulsion & BoS Origin) Breaker Block : Show or not show and specify color.
🟣 Fair Value Gap Display
Show Bullish FVG : Toggles the display of demand-related boxes.
Show Bearish FVG : Toggles the display of supply-related boxes.
🟣 Logic Settings
🟣 Order Block Refinement
Refine Order Blocks : Enable or disable the refinement feature. Mode selection.
🟣 FVG Filter
FVG Filter : This refines the number of identified FVG areas based on a specified algorithm to focus on higher quality signals and reduce noise.
Types of FVG filters :
Very Aggressive Filter: Adds a condition where, for an upward FVG, the last candle's highest price must exceed the middle candle's highest price, and for a downward FVG, the last candle's lowest price must be lower than the middle candle's lowest price. This minimally filters out FVGs.
Aggressive Filter: Builds on the Very Aggressive mode by ensuring the middle candle is not too small, filtering out more FVGs.
Defensive Filter: Adds criteria regarding the size and structure of the middle candle, requiring it to have a substantial body and specific polarity conditions, filtering out a significant number of FVGs.
Very Defensive Filter: Further refines filtering by ensuring the first and third candles are not small-bodied doji candles, retaining only the highest quality signals.
🟣 Alert
Alert Name : The name of the alert you receive.
Alert ICT Unicorn Model Block Mitigation :
On / Off
Message Frequency :
This string parameter defines the announcement frequency. Choices include: "All" (activates the alert every time the function is called), "Once Per Bar" (activates the alert only on the first call within the bar), and "Once Per Bar Close" (the alert is activated only by a call at the last script execution of the real-time bar upon closing). The default setting is "Once per Bar".
Show Alert Time by Time Zone :
The date, hour, and minute you receive in alert messages can be based on any time zone you choose. For example, if you want New York time, you should enter "UTC-4". This input is set to the time zone "UTC" by default.
🔵Conclusion
The Unicorn Model in ICT, utilizing the concepts of Breaker Blocks and Fair Value Gaps, provides an effective tool for identifying entry and exit points in financial markets. By offering more precise signals, this model helps traders make better decisions and minimize trading risks.
Success in applying this model requires practice and a deep understanding of market structure, but it can significantly improve trading performance.

ICT 9:30am First FVGThis indicator is designed based on ICT (Inner Circle Trader)'s algorithmic price action theory, specifically targeting the first fair value gap (FVG) that forms immediately after the New York Stock Exchange opens at 9:30am. The FVG represents an imbalance in the price delivery where a significant price action gap occurs, which can play a crucial role in future price movements.
Features:
Identification of First FVG: Automatically identifies and plots the first fair value gap that forms post the 9:30am NY open.
Customizable Visualization: Choose between block or line styles for visual representation, with customizable colors and border styles.
Date Labeling: Optionally displays date labels for each identified gap to track patterns over time.
Imbalance Extension: Options to extend the imbalances to the current bar, helping to visualize their influence on ongoing price action.
Purpose:
The first fair value gap formed after the market opens is an important algorithmic price range in ICT's price action theory. This indicator simplifies the identification of these critical gaps and helps in understanding their impact on future price action.

Radius Trend [ChartPrime]RADIUS TREND
⯁ OVERVIEW
The Radius Trend [ ChartPrime ] indicator is an innovative technical analysis tool designed to visualize market trends using a dynamic, radius-based approach. By incorporating adaptive bands that adjust based on price action and volatility, this indicator provides traders with a unique perspective on trend direction, strength, and potential reversal points.
The Radius Trend concept involves creating a dynamic trend line that adjusts its angle and position based on market movements, similar to a radius sweeping across a chart. This approach allows for a more fluid and adaptive trend analysis compared to traditional linear trend lines.
◆ KEY FEATURES
Dynamic Trend Band: Calculates and plots a main trend band that adapts to market conditions.
Radius-Based Adjustment: Uses a step-based radius approach to adjust the trend band angle.
// Apply step angle to trend lines
if bar_index % n == 0 and trend
multi1 := 0
multi2 += step
band += distance1 * multi2
if bar_index % n == 0 and not trend
multi1 += step
multi2 := 0
band -= distance1 * multi1
Volatility-Adjusted Calculations: Incorporates price range volatility for more accurate band placement.
Trend Direction Visualization: Provides clear color-coding to distinguish between uptrends and downtrends.
Flexible Parameters: Allows users to adjust the radius step and initial distance for customized analysis.
◆ USAGE
Trend Identification: Use the color and direction of the main band to determine the current market trend.
Trend Strength Analysis: Observe the angle and consistency of the band for insights into trend strength.
Reversal Detection: Watch for price crossing the main band or crossing a dashed band as a potential trend reversal signal.
Volatility Assessment: The distance between price and bands can provide insights into market volatility.
⯁ USER INPUTS
Radius Step: Controls the rate of angle adjustment for the trend band (default: 0.15, step: 0.001).
Start Points Distance: Sets the initial distance multiplier for band calculations (default: 2, step: 0.1).
The Radius Trend indicator offers traders a unique and dynamic approach to trend analysis. By combining radius-based trend adjustments with volatility-sensitive calculations, it provides a fluid representation of market trends. This indicator is particularly useful for traders looking to identify trend persistence, potential reversal points, and adaptive support/resistance levels across various market conditions and timeframes.

ka66: Bar Range BandsThis tool takes a bar's range, and reflects it above the high and below the low of that bar, drawing upper and lower bands around the bar. Repeated for each bar. There's an option to then multiply that range by some multiple. Use a value greater than 1 to get wider bands, and less than one to get narrower bands.
This tool stems out of my frustration from the use of dynamic bands (like Keltner Channels, or Bollinger Bands), in particular for estimating take profit points.
Dynamic bands work great for entries and stop loss, but their dynamism is less useful for a future event like taking profit, in my experience. We can use a smaller multiple, but then we can often lose out on a bigger chunk of gains unnecessarily.
The inspiration for this came from a friend explaining an ICT/SMC concept around estimating the magnitude of a trend, by calculating the Asian Session Range, and reflecting it above or below on to the New York and London sessions. He described this as standard deviation of the Asian Range, where the range can thus be multiplied by some multiple for a wider or narrower deviation.
This, in turn, also reminded me of the Measured Move concept in Technical Analysis. We then consider that the market is fractal in nature, and this is why patterns persist in most timeframes. Traders exist across the spectrum of timeframes. Thus, a single bar on a timeframe, is made up of multiple bars on a lower timeframe . In other words, when we reflect a bar's range above or below itself, in the event that in a lower timeframe, that bar fit a pattern whose take profit target could be estimated via a Measured Move , then the band's value becomes a more valid estimate of a take profit point .
Yet another way to think about it, by way of the fractal nature above, is that it is essentially a simplified dynamic support and resistance mechanism , even simpler than say the various Pivot calculations (e.g. Classical, Camarilla, etc.).
This tool in general, can also be used by those who manually backtest setups (and certainly can be used in an automated setting too!). It is a research tool in that regard, applicable to various setups.
One of the pitfalls of manual backtesting is that it requires more discipline to really determine an exit point, because it's easy to say "oh, I'll know more or less where to exit when I go live, I just want to see that the entry tends to work". From experience, this is a bad idea, because our mind subconsciously knows that we haven't got a trained reflex on where to exit. The setup may be decent, but without an exit point, we will never have truly embraced and internalised trading it. Again, I speak from experience!
Thus, to use this to research take profit/exit points:
Have a setup in mind, with all the entry rules.
Plot your setup's indicators, mark your signals.
Use this indicator to get an idea of where to exit after taking an entry based on your signal.
Credits:
@ICT_ID for providing the idea of using ranges to estimate how far a trend move might go, in particular he used the Asian Range projected on to the London and New York market sessions.
All the technicians who came up with the idea of the Measured Move.

Volumatic S/R Levels [BigBeluga]THE VOLUMATIC S/R LEVELS
The Volumatic S/R Levels [ BigBeluga ] is an advanced technical analysis tool designed to identify and visualize significant support and resistance levels based on volume and price action.
The core concept of this indicator is to highlight areas where large volume and significant price movements coincide. It does this by plotting horizontal lines at price levels where unusually large candles (in terms of price range) occur alongside high trading volume. These lines represent potential support and resistance levels that are likely to be more significant due to the increased market activity they represent.
⬤ Key Features
Dynamic S/R Level Identification: Automatically detects and displays support and resistance levels from high volume candles.
Volume-Weighted Visualization: Uses line color to see positive or negative volume and box size to represent the strength of each level
Positive and Negative Volume:
Box Size Based on Volume:
Adaptive Levels Color: Adjusts level color based on price above or below level
Real-time Level Extension: Extends identified levels to the right side of the chart for better visibility
Volume and Percentage Labels: Displays volume information and relative strength percentage for each level
Dashed Levels: Displays levels with which price have interact multiple times
Dashboard: Shows max and min level information for quick reference
⬤ How to Use
Identify Key Levels: Look for horizontal lines representing potential support and resistance areas
Assess Level Strength:
- Thicker boxes indicate stronger levels, on which price reacts more
Monitor Price Interactions: Watch how price reacts when approaching these levels for potential trade setups
Volume Confirmation: Use the volume boxes to confirm the significance of each level
Relative Strength Analysis: Check the percentage labels to understand each level's importance relative to others
Trend Analysis: Use the color of the levels (lime for bullish, orange for bearish) to understand the overall market sentiment at different price points
Quick Reference: Utilize the dashboard to see the strongest and weakest levels at a glance
⬤ Customization
Levels Strength: Adjust the minimum threshold for level strength identification (default: 2.4)
Levels Amount: Set the maximum number of levels to display on the chart (max: 20)
The Volumatic S/R Levels indicator provides traders with a sophisticated tool for identifying key price levels backed by significant volume. By visualizing these levels directly on the chart and providing detailed volume and relative strength information, it offers valuable insights into potential areas of support, resistance, and price reversal. The addition of a ranking system and dashboard further enhances the trader's ability to quickly assess the most significant levels. This indicator is particularly useful for traders focusing on volume analysis and those looking to enhance their understanding of market structure. As with all technical tools, it's recommended to use this indicator in conjunction with other forms of analysis for comprehensive trading decisions.

Ultra Key LevelsThe "Ultra Key Levels" indicator is a powerful tool designed for traders who seek to identify critical price levels in the market. This Pine Script™ indicator is optimized to plot significant pivot highs and lows directly on your chart, providing a clear visual representation of potential support and resistance zones.
Pivot Detection: Automatically identifies and marks pivot highs and lows using customizable parameters. Traders can fine-tune the length of the pivots, allowing for precise detection of significant price points.
Dynamic Boxes: The indicator draws dynamic boxes around each identified pivot high and low, highlighting key levels. These boxes are adjusted based on the Average True Range (ATR), ensuring they reflect the current market volatility.
Pivot Highs/Lows: Control the appearance and behavior of pivot points with options to adjust source data, length, transparency, and the maximum number of pivots displayed on the chart.
ATR Multiplier: Set the ATR multiplier to determine the size of the boxes around pivot points, helping you assess the strength of each level.
Debug Mode: Activate debug mode to visualize pivot points and fine-tune your settings for optimal performance.
Scalability: Supports up to 500 boxes, making it suitable for both short-term and long-term traders who need to track multiple levels across different timeframes.
The "Ultra Key Levels" indicator is ideal for traders who rely on technical analysis to make informed decisions. By automatically identifying and highlighting key price levels, this tool helps you anticipate potential market movements and optimize your trading strategy.

Uptrick: Adaptive Cloud Oscillator (ACO)### **Uptrick: Adaptive Cloud Oscillator (ACO)**
---
### Introduction
The **Uptrick: Adaptive Cloud Oscillator (ACO)** is an advanced technical analysis tool designed to empower traders with precise trend detection and visual clarity in dynamic market conditions. By seamlessly integrating adaptive trend analysis, volatility filtering, and cloud-based support and resistance levels, the ACO provides traders with the actionable insights needed to navigate complex markets with confidence.
This indicator is highly customizable, allowing traders to tailor its functionality to their specific trading style and preferences. Whether you're a trend follower, swing trader, or looking to identify key support and resistance zones, the **Uptrick: ACO** is an indispensable tool that can adapt to a variety of market conditions.
### Indicator Purpose and Functionality
#### 1. **Adaptive Trend Detection**
At the heart of the **Uptrick: ACO** lies its adaptive trend detection algorithm. Unlike traditional moving averages that may lag in volatile markets or react too slowly to rapid changes, this adaptive method uses a smoothing technique that dynamically adjusts based on market conditions. By doing so, it provides a more responsive trend line that captures meaningful price movements while filtering out minor fluctuations.
- **How It Works:** The trend line is calculated using an adaptive smoothing factor, making it responsive to recent price actions while maintaining a level of stability that prevents whipsaw signals. This ensures that traders are always in tune with the prevailing market trend, whether bullish, bearish, or neutral.
#### 2. **Dynamic Cloud Support and Resistance**
The **Uptrick: ACO** features a dynamic "cloud" that serves as a key element in its analysis. This cloud is constructed using a moving average combined with the Average True Range (ATR), which adjusts based on the market’s volatility. The cloud provides dynamic support and resistance levels, essential for identifying potential reversal zones or confirming trend continuations.
- **Cloud Displacement:** The cloud is displaced forward by a user-defined number of bars, offering a predictive view of where future support and resistance levels may lie. This forward-looking feature helps traders anticipate potential price movements, making the ACO a powerful tool for planning trades ahead of time.
#### 3. **Versatile Visualization Options**
The **Uptrick: ACO** is designed with flexibility in mind, allowing users to choose between two distinct display modes:
- **Buy/Sell Signals:** In this mode, the indicator generates clear buy and sell signals based on crossovers of the trend line and the cloud boundaries. These signals are visualized directly on the chart with up and down labels, making it easy for traders to identify potential entry and exit points.
- **Cloud Fill Only:** For traders who prefer a cleaner chart, this mode removes the buy/sell signals and instead focuses on coloring the area between the upper and lower cloud boundaries. The color of the cloud fill changes based on the trend direction, providing a visual representation of the market's momentum.
- **Optional EMA Line:** An Exponential Moving Average (EMA) line can be optionally displayed on the chart. The EMA serves as an additional trend filter, helping traders further refine their entries and exits. The length, color, and thickness of the EMA are fully customizable to fit individual trading strategies.
### Practical Applications
#### 1. **Trend Following and Reversals**
The **Uptrick: ACO** excels in identifying and following trends. By analyzing the relationship between the trend line and the cloud, traders can determine the strength and direction of the current market trend. The cloud’s dynamic nature means it can adapt to both trending and ranging markets, providing consistent insights regardless of market conditions.
- **Example:** If the trend line crosses above the upper cloud boundary, it signals a potential buy opportunity. Conversely, a cross below the lower cloud boundary suggests a sell opportunity. Traders can use these signals to enter trades aligned with the prevailing trend.
#### 2. **Support and Resistance Identification**
The forward-displaced cloud acts as a predictive support and resistance zone. Traders can use these zones to set stop-loss levels, determine take-profit targets, or identify potential reversal points.
- **Example:** When the price approaches the upper cloud boundary from below, the boundary may act as resistance, indicating a potential reversal or pullback. If the price breaks through this level, it may signal a continuation of the bullish trend.
#### 3. **Volatility-Based Analysis**
By incorporating ATR into its calculations, the **Uptrick: ACO** provides a built-in mechanism to adapt to varying levels of market volatility. This makes it particularly useful in markets prone to sudden spikes in volatility, such as during major economic announcements or geopolitical events.
- **Example:** In a high-volatility environment, the cloud widens, allowing for greater price fluctuations within the trend. Traders can use this information to adjust their risk management strategies, such as widening stop-loss levels during volatile periods to avoid being stopped out prematurely.
### Customization and Flexibility
The **Uptrick: ACO** is designed to be highly customizable, ensuring it can meet the needs of traders with different strategies and preferences. Key customization options include:
- **Cloud and Trend Settings:** Traders can adjust the length of the cloud, the smoothing factor for the trend line, and the displacement of the cloud to optimize the indicator for their specific market and timeframe.
- **Display Modes:** With a simple dropdown selection, traders can choose whether to display buy/sell signals or focus solely on the cloud fill, providing flexibility in how the indicator is visualized.
- **Color and Style Customization:** The colors for bullish and bearish trends, cloud fill, buy/sell signals, and the EMA line can all be customized, allowing traders to integrate the **Uptrick: ACO** seamlessly into their existing chart setups.
### Conclusion
The **Uptrick: Adaptive Cloud Oscillator (ACO)** is more than just a trend indicator—it's a comprehensive market analysis tool that provides traders with a deep understanding of market dynamics. Its combination of adaptive trend analysis, dynamic support and resistance levels, and versatile visualization options makes it an essential tool for traders looking to gain an edge in any market environment.
Whether you're a seasoned trader or just starting, the **Uptrick: ACO** offers the insights and flexibility needed to make informed trading decisions. By helping you identify trends, anticipate reversals, and adapt to changing market conditions, the **Uptrick: ACO** can significantly enhance your trading strategy and improve your overall trading performance.

Uptrick: FVG Market Zones**Uptrick: FVG Market Zones**
---
### Introduction
**Uptrick: FVG Market Zones** is a cutting-edge technical analysis tool designed to identify and visualize Fair Value Gaps (FVGs) within financial markets. This indicator focuses on pinpointing critical price levels where significant gaps occur, which can act as potential support and resistance zones. By integrating advanced volatility analysis and user-configurable parameters, the **Uptrick: FVG Market Zones** provides traders with a robust framework for understanding market dynamics and making informed trading decisions.
### Purpose and Functionality
The primary purpose of the **Uptrick: FVG Market Zones** indicator is to detect and highlight Fair Value Gaps, which are areas on a price chart where there is a significant price movement without any trading activity in between. These gaps can provide critical insights into market behavior, as they often indicate areas where the market has not fully accounted for the supply and demand dynamics. Traders use these zones to anticipate potential reversals, breakouts, or consolidations, making this tool highly valuable for both short-term and long-term trading strategies.
### Unique Features and Originality
The **Uptrick: FVG Market Zones** indicator is distinguished by its focus on FVGs and its ability to integrate this concept into a broader market analysis framework. Unlike other indicators that may offer generalized support and resistance levels, this tool specifically identifies and visualizes gaps based on volatility-adjusted criteria. This precision allows traders to focus on the most relevant market zones, improving their ability to anticipate market movements.
One of the standout features of this indicator is its user-configurable settings, which provide a high degree of customization. This flexibility ensures that traders can tailor the indicator to suit their specific trading style and the particular market they are analyzing. Additionally, the indicator's visualization capabilities are enhanced with customizable colors and gap-filling options, making it easier for traders to interpret and act on the information presented.
### Inputs and Configurations
**Uptrick: FVG Market Zones** comes with several user inputs that allow traders to customize the indicator's behavior and appearance. Each input plays a crucial role in determining how the indicator identifies and visualizes FVGs on the chart. Here’s a detailed breakdown of each input:
1. **FVG Analysis Period (fvgPeriod):**
- **Description:** This input determines the period over which the indicator analyzes the chart for identifying FVGs. By adjusting this value, traders can control how far back in time the indicator looks to detect significant gaps.
- **Default Value:** 25
- **Purpose:** A shorter period may focus on more recent market activity, making the indicator more sensitive to recent price movements. In contrast, a longer period allows the indicator to identify gaps that have remained unfilled for an extended time, potentially acting as stronger support or resistance levels.
2. **Analysis Mode (mode):**
- **Description:** The Analysis Mode input allows traders to choose between different methods of analyzing the chart for FVGs.
- **Options:** "Recent Gaps" and "Extended View"
- **Default Option:** "Recent Gaps"
- **Purpose:**
- **Recent Gaps:** Focuses on the latest significant gaps, providing traders with up-to-date information on the most relevant market zones.
- **Extended View:** Considers a broader range of gap patterns, which can be useful in markets where historical gaps may still influence current price action.
3. **Volatility Sensitivity (volatilityFactor):**
- **Description:** This input adjusts the sensitivity of the indicator to market volatility. It is used in calculating the threshold for identifying FVGs.
- **Default Value:** 0.3
- **Step Size:** 0.1
- **Purpose:** A higher sensitivity will cause the indicator to detect smaller gaps, which might be more frequent but less significant. Lower sensitivity focuses on larger, more impactful gaps, which are less frequent but potentially more powerful in predicting market behavior.
4. **Highlight Market Gaps (showGaps):**
- **Description:** A boolean input that determines whether the identified FVGs should be highlighted on the chart.
- **Default Value:** True
- **Purpose:** This input allows traders to toggle the visualization of FVGs. When enabled, the indicator highlights gaps using colored boxes, making them visually prominent on the chart.
5. **Bullish Highlight Color (bullColor):**
- **Description:** Sets the color used to highlight bullish FVGs (gaps that may indicate support).
- **Default Value:** #00FF7F (a shade of green)
- **Purpose:** The color choice is crucial for quickly distinguishing bullish zones from bearish ones. Green is typically associated with upward price movement, making it intuitive for traders to identify potential support areas.
6. **Bearish Highlight Color (bearColor):**
- **Description:** Sets the color used to highlight bearish FVGs (gaps that may indicate resistance).
- **Default Value:** #FF4500 (a shade of red)
- **Purpose:** Red is commonly associated with downward price movement, making it easy for traders to identify potential resistance areas. This color coding helps in quickly assessing the chart.
7. **Fill Gap Areas (fillGaps):**
- **Description:** A boolean input that determines whether the FVGs should be filled with a color on the chart.
- **Default Value:** True
- **Purpose:** Filling the gap areas provides a more solid visual cue for traders. It enhances the visibility of the gaps, making it easier to spot these zones during fast-paced trading sessions.
8. **Hidden Color (hidden):**
- **Description:** A color input that is used when certain elements should be hidden from the chart.
- **Default Value:** color.rgb(0,0,0,100) (a semi-transparent black)
- **Purpose:** This input is useful for controlling the visibility of certain plots or elements on the chart, ensuring that the indicator remains clean and uncluttered.
### Market Gap Detection
The core functionality of the **Uptrick: FVG Market Zones** indicator lies in its ability to detect Fair Value Gaps. These gaps occur when the price makes a significant jump from one level to another without any trading activity in between. The indicator uses a combination of price action analysis and volatility thresholds to identify these gaps.
- **Volatility Measurement:** The indicator begins by measuring market volatility using the Average True Range (ATR). This volatility measurement is then adjusted by the user-defined sensitivity factor, which determines the threshold for identifying significant gaps.
- **Gap Identification:** The indicator checks for instances where the current low is higher than the high two bars ago (bullish gap) or where the current high is lower than the low two bars ago (bearish gap). These conditions signify a potential FVG.
- **Gap Storage and Management:** Once a gap is identified, it is stored in an array. The indicator also manages the size of these arrays based on the selected analysis mode, ensuring that only the most relevant gaps are considered in the analysis.
### Visualization
Visualization is a key component of the **Uptrick: FVG Market Zones** indicator. By providing clear and customizable visual cues, the indicator ensures that traders can quickly and easily interpret the information it provides.
- **Gap Highlighting:** When enabled, the indicator highlights the identified FVGs on the chart using colored boxes. Bullish gaps are highlighted in green, while bearish gaps are highlighted in red. This color coding helps traders instantly recognize potential support and resistance zones.
- **Gap Filling:** The indicator can also fill the identified gaps with a semi-transparent color. This option enhances the visibility of the gaps, making them more prominent on the chart. Filled gaps are particularly useful for traders who want to keep track of these zones over multiple trading sessions.
- **Gap Averages:** The indicator calculates the average level of the identified gaps and plots these averages as lines on the chart. These lines represent the general area of support or resistance based on the detected gaps, providing traders with a reference point for setting their stop losses or profit targets.
- **Text Labels:** The indicator also labels each FVG with the text "FVG" inside the highlighted area. This feature ensures that traders can easily identify these zones even in charts with dense price action.
### Practical Applications
The **Uptrick: FVG Market Zones** indicator is versatile and can be applied to a wide range of trading strategies across different markets and timeframes. Here are a few examples of how this indicator can be used in practice:
1. **Support and Resistance Trading:**
- Traders can use the identified FVGs as dynamic support and resistance levels. By placing their trades based on these levels, they can take advantage of potential reversals or continuations at key market zones.
2. **Gap Filling Strategy:**
- Some traders focus on the concept of gap filling, where the market eventually returns to "fill" the gap created by rapid price movements. The **Uptrick: FVG Market Zones** indicator can
help identify such gaps and anticipate when the market might return to these levels.
3. **Breakout Trading:**
- The indicator can be used to identify breakouts from significant gaps. When the price moves beyond the identified FVGs, it may signal a strong trend continuation, providing an opportunity for breakout traders.
4. **Reversal Trading:**
- By monitoring the signals generated by the indicator, traders can identify potential market reversals. A sell signal after a prolonged uptrend or a buy signal after a downtrend may indicate a reversal, allowing traders to position themselves accordingly.
5. **Risk Management:**
- The average levels of the FVGs can be used to set stop-loss and take-profit levels. By aligning these levels with the FVG zones, traders can improve their risk management practices and enhance their trading discipline.
### Customization and Flexibility
One of the standout features of the **Uptrick: FVG Market Zones** indicator is its high level of customization. Traders can adjust various parameters to tailor the indicator to their specific needs and preferences.
- **Customizable Colors:** The indicator allows traders to choose their preferred colors for highlighting bullish and bearish gaps. This flexibility ensures that the indicator can be integrated seamlessly into any trading setup, regardless of the trader's color scheme preferences.
- **Adjustable Periods and Sensitivity:** By allowing traders to adjust the analysis period and volatility sensitivity, the indicator can be fine-tuned to suit different market conditions. For example, a trader might use a shorter analysis period and higher sensitivity in a volatile market, while opting for a longer period and lower sensitivity in a more stable market.
- **Toggling Visual Elements:** Traders can choose to enable or disable various visual elements of the indicator, such as gap highlighting, gap filling, and text labels. This level of control allows traders to declutter their charts and focus on the information that is most relevant to their trading strategy.
### Advantages and Benefits
The **Uptrick: FVG Market Zones** indicator offers several key advantages that make it a valuable tool for traders:
1. **Precision:** By focusing on Fair Value Gaps, the indicator provides highly precise levels of support and resistance, which are often more reliable than traditional horizontal levels.
2. **Clarity:** The clear visual representation of FVGs, along with the text labels and color coding, ensures that traders can quickly interpret the indicator's signals and incorporate them into their trading decisions.
3. **Adaptability:** The indicator's customizable settings allow it to be adapted to different markets, timeframes, and trading styles. Whether you are a day trader, swing trader, or long-term investor, this indicator can be tailored to meet your needs.
4. **Enhanced Decision-Making:** The trading signals generated by the indicator provide actionable insights that can help traders make more informed decisions. By aligning their trades with the identified FVG zones, traders can improve their chances of success.
5. **Risk Management:** The use of FVG zones as reference points for stop-loss and take-profit levels enhances risk management practices, helping traders protect their capital while maximizing their profit potential.
### Conclusion
The **Uptrick: FVG Market Zones** indicator is a powerful and versatile tool for traders seeking to enhance their market analysis and improve their trading outcomes. By focusing on Fair Value Gaps and providing a high level of customization, this indicator offers a unique blend of precision, clarity, and adaptability. Whether you are looking to identify key market zones, generate trading signals, or improve your risk management practices, the **Uptrick: FVG Market Zones** indicator is a valuable addition to any trader's toolkit.
With its innovative approach to market analysis and user-friendly design, **Uptrick: FVG Market Zones** stands out as an essential tool for traders who want to stay ahead of the market and make more informed trading decisions. Whether you are trading stocks, forex, commodities, or cryptocurrencies, this indicator provides the insights you need to navigate the markets with confidence and success.

Rising & Falling Window Signals [LuxAlgo]The Rising & Falling Window Signals indicator identifies Rising & Falling Window formations on the chart and manages them for use as support and resistance zones. The Rising and Falling Window methods used in this indicator are based on Steve Nison's techniques, emphasizing the importance of these areas to better identify continuation momentum and likely reversal points.
Various filtering settings are included to identify zones of a specific width, as well as hide shorter zones from displaying on their chart, helping the users focus on the most significant zones.
🔶 USAGE
A Window (Rising or Falling) forms when the candle wicks from 2 consecutive candlesticks do not overlap, causing a gap. This gap is considered as a strong market sentiment of upward or downward movement, allowing traders to anticipate the likely direction of future prices.
The formation of a Rising Window is a typical indication that a bullish trend is likely to follow.
The formation of a Falling Window is a typical indication that a bearish trend is likely to follow.
After forming a window, we can interpret the zone as a likely area of support and resistance for the price to return to and react from.
Generally, the extremities of the window are used as support and resistance levels, with opposite extremities being regarded as the strongest point of support/resistance. However, when the window is exceptionally wide, the mid-point is looked upon as the strongest point of support/resistance. Once the price closes beyond the window, the window is no longer seen as supportive.
🔶 DETAILS
The script uses a fairly simple concept and implements it with familiar size and mitigation checks. From the settings of this script, the zones can be controlled based on user preferences.
🔹 Horizontal Zone Control
Horizontal Control Settings manipulate the extension and zone display for each zone; however, these settings do not affect the identification of each zone.
Maximum Live Zone Length: This determines the maximum duration of a zone. Zones will stop extending once the zone is mitigated, or if it has reached the maximum zone length determined by this setting.
Minimum Inactive Zone Length: This will hide mitigated (inactive) zones that are shorter than this setting value, this is used to free up the chart from irrelevant zones.
Extend Historical Zones on Touch: If a zone is unmitigated, but has stopped extending, it is considered a "historical" zone. If the price returns to a historical zone, this setting will cause it to extend to the current bar.
🔹 Vertical Zone Control
Vertical Control Settings filter out windows that are wider or thinner than the desired width range. Each of these settings is specified as "ATR Multipliers".
Minimum Width: Filters out any zones whose width is lower than ATR * Minimum Width.
Maximum Width: Filters out any zones whose width is higher than ATR * Maximum Width.
🔹 Signal Types
Signals are used to identify interactions with the Rising & Falling Window zones. The script has 3 different identification types to choose from:
Note: These are all bullish (rising window) examples of each signal.
Regular: The "regular" signal will fire when the price crosses above the upper extremity of an unmitigated zone.
Engulfing: The "engulfing" signal will fire when a bullish engulfing candlestick pattern occurs while one or more of the candle's wicks are touching the zone.
Wick: The "wick" signal will fire when the low of the candle is below the top of a zone, but the candle then closes above the top of the zone.
🔶 SETTINGS
🔹 Horizontal Zone Control
Maximum Live Zone Length: Maximum duration of newly formed zones.
Minimum Inactive Zone Length: Hides Zones whose length is lower than this setting.
Extend Historical Zones on Touch: Extend historical unmitigated zones when the price reaches the zone to the current bar.
🔹 Vertical Zone Control
Minimum Width: ATR multiplier used to filter out any zones whose width is lower than ATR * Minimum Width.
Maximum Width: ATR multiplier used to filter out any zones whose width is higher than ATR * Maximum Width.
Show Midlines: Determine if the zone midlines are displayed.
🔹 Signals
Show Zone Tests: Determine if signals appearing on zone tests are displayed.
Test Type: Sets the signal method for zone tests.
Signal Size: Sets label size for displayed signals.

[1] Dynamic Support and Resistance with breakout [Dr Future]This script appears to be designed to identify and visualize dynamic support and resistance levels on a price chart, along with potential breakout signals.
Key Components & Functionality (Inferred):
Dynamic Support and Resistance: The script likely employs algorithms to calculate and plot support and resistance levels that adjust in real-time as price action evolves.
Breakout Detection: The script probably incorporates logic to recognize when the price breaks out of these dynamic support or resistance zones. This could trigger alerts or visual cues on the chart.
Dr Future's Approach: It's worth noting the " " tag, suggesting the script might be based on specific methodologies or insights associated with a trader or analyst known as "Dr Future." Without more context on their strategies, it's difficult to pinpoint the exact techniques used.
Potential Benefits:
Adaptive Levels: Dynamic support and resistance can offer a more responsive approach compared to static levels, as they account for changing market conditions.
Breakout Opportunities: Identifying breakouts can help traders spot potential entry or exit points.
Visual Clarity: Plotting these levels directly on the chart can provide a clearer picture of the current market structure and potential turning points.
Caveats:
False Signals: Like any technical tool, dynamic support and resistance can generate false signals. Breakouts might not always lead to sustained trends.
Parameter Sensitivity: The script's effectiveness likely depends on how its parameters are configured. Fine-tuning might be required to suit different markets or timeframes.
"Dr Future" Factor: The script's performance could be tied to the specific strategies of "Dr Future," which might not be universally applicable.
Important Note:
Without access to the actual code and a deeper understanding of "Dr Future's" methods, this description is based on inference and general knowledge of technical analysis.
Recommendation:
If you're considering using this script, it would be prudent to:
Backtest Thoroughly: Test the script on historical data to assess its performance and identify potential pitfalls.
Understand the Parameters: Familiarize yourself with the script's settings and how they impact the plotted levels and breakout signals.
Combine with Other Tools: Use this script in conjunction with other technical indicators and risk management strategies for a more holistic trading approach.
