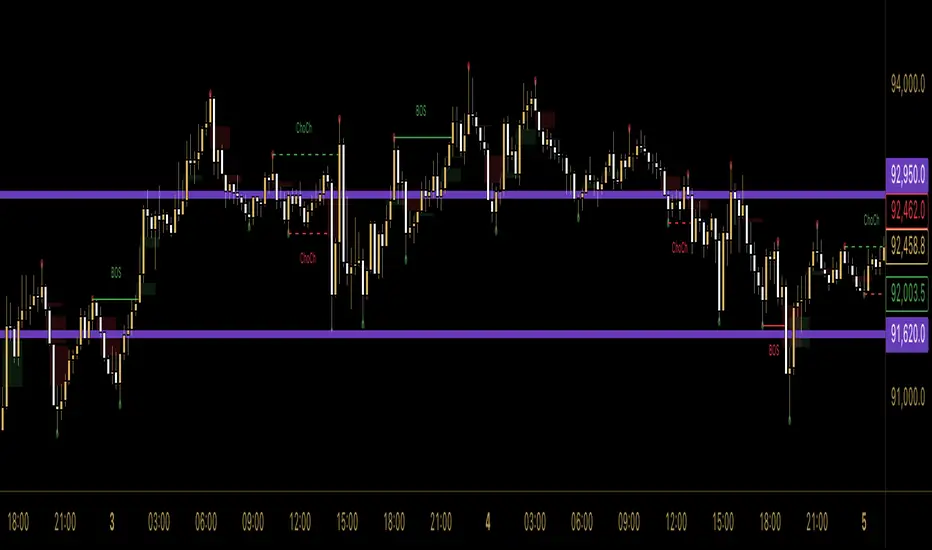
GridMap PRO by TradeAkademiGridMap PRO is a professional level-mapping framework built on the premise that price action tends to develop within repeatable percentage-based bands. Using mathematically derived projections, the indicator identifies potential support and resistance zones where the market is statistically more likely to react.
All calculations are anchored to the asset’s historical low; therefore, levels remain structurally stable unless a new low is formed.
To support different trading environments, GridMap PRO offers two calculation modes:
Long Term: Designed for high-volatility markets, macro structure assessments and broader trend inflection points.
Short Term: Optimized for shorter-term setups, providing precise reaction zones and tactical entry/exit levels.
Users are encouraged to validate the levels against historical price behavior. In some environments, price may respect a level multiple times with minimal deviation, while in others it may break through several levels without hesitation. GridMap PRO is not a standalone signal generator but an institutional-grade framework that enhances the decision-making process.
Primary use cases:
Identifying accurate buy/sell/SL/TP zones
Constructing optimal grid or DCA entry layers
Mapping pinpoint reaction levels for leveraged trades with tight stops
Note: Even though these structures have historically performed extremely well, no level guarantees a future reaction. Always consider broader market conditions, volatility, news flow, and complementary technical data. When using the levels in leveraged setups, apply reasonable stop distances or opt for a DCA-based entry approach rather than a single-point execution.
Destek ve Direnç

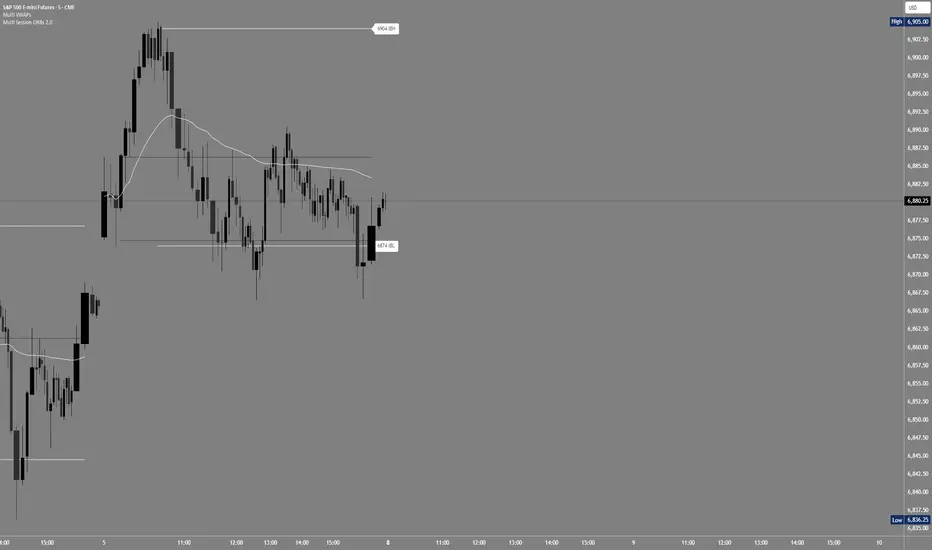
Multi Session ORBs 2.0Multi Session ORBs 2.0 is an intraday tool for session-based traders who rely on Opening Range Breakout and Initial Balance structures to frame trades around the Tokyo, London, and New York sessions. It automatically detects the main sessions in New York time and plots each session’s opening-range high, low, and optional mid, with shaded boxes that highlight the active range and clean horizontal levels that extend across the session for precise breakout, rejection, and rotation analysis.
The script also builds a dedicated New York Initial Balance from 09:30 to 10:30 ET and then projects those IB levels forward from 10:30 through the rest of the NY session, helping intraday traders track first-hour value, monitor when price accepts or rejects that area, and structure trades around range breaks or mean reversion. Optional labels and vertical markers print 15 minutes before the London and New York opens, making it easier to anticipate volatility windows and align entries with key session transitions.
This indicator is designed to be used preferably in confluence with the separate Multi VWAPs tool, which plots multiple VWAPs across different time horizons so that traders can combine session ORB/IB levels with VWAP-based dynamic support and resistance for stronger intraday bias and higher-quality trade locations.
DAILY AND WEEKLY MID LINESDAILY AND WEEKLY MID LINES INDICATOR
Description:
This indicator calculates and visualizes the dynamic midpoint (mid) of the current day and week in real-time. It provides traders with key reference levels based on developing price action.
Features:
Daily Mid Line:
Color: Orange
Thickness: 3 pixels
Style: Solid line
Updates: Automatically recalculates with each new candle
Calculation: Average of the day's highest high and lowest low from market open
Weekly Mid Line:
Color: Blue
Thickness: 3 pixels
Style: Dashed line
Updates: Continuously recalculates throughout the week
Calculation: Average of the week's highest high and lowest low from week start
How It Works:
At the start of each new trading day (00:00), the daily mid line resets and begins calculating from the first candle
At the start of each new trading week (typically Monday), the weekly mid line resets and begins fresh calculations
Both lines extend automatically to the right as new candles form
The lines are dynamic - they adjust as new highs/lows are made during the day/week
Trading Applications:
Support/Resistance Levels:
The mid lines act as natural equilibrium points where price may find temporary support or resistance
Daily mid can serve as intraday pivot, weekly mid as broader market balance point
Trend Analysis:
Price consistently above mid lines suggests bullish momentum
Price consistently below mid lines suggests bearish momentum
Relationship between daily and weekly mid lines shows multi-timeframe alignment
Entry/Exit Signals:
Price crossing above daily mid may indicate short-term bullish momentum
Price crossing below daily mid may indicate short-term bearish momentum
Weekly mid breaks can signal more significant trend changes
Market Context:
Distance between price and mid lines indicates market extremity
Steeper mid line slopes suggest stronger directional momentum
Flat mid lines suggest range-bound or consolidating markets
Confluence Trading:
Combine with other indicators (RSI, MACD, moving averages) for confirmation
Use as dynamic levels for stop-loss placement or take-profit targets
Best Practices:
More effective on higher timeframes (1H, 4H, Daily) for clearer signals
Works well in trending markets where mid lines act as moving support/resistance
Monitor for price rejection or acceptance at mid levels for trading decisions
Use in conjunction with volume analysis for confirmation
Psychological Significance:
Mid points often represent fair value areas where buyers and sellers find temporary equilibrium, making them natural decision points for market participants.
This indicator is particularly useful for day traders, swing traders, and position traders looking for dynamic, real-time reference points that adapt to current market conditions rather than relying on static historical levels.

Pivot-Based Trend Labels [BETA]Automatically labels Higher Highs, Lower Highs, Higher Lows and Lower Lows using pivots, with optional zigzag lines and resistance proximity alerts. BETA version for testing and feedback.
## Overview
**Pivot-Based Trend Labels v2.0 ** is a structure-focused tool that automatically detects pivot highs and lows, then labels them as:
- **HH** – Higher High
- **LH** – Lower High
- **LL** – Lower Low
- **HL** – Higher Low
It’s designed to make trend structure (higher highs / higher lows vs lower highs / lower lows) easy to read at a glance. You can optionally draw connecting “zigzag” lines between pivots and enable a resistance proximity alert.
---
## Key Features
- **Pivot-based structure labels**
- Detects pivot highs/lows using a configurable lookback period
- Labels each new pivot as HH / LH / LL / HL
- Optional filter for minimum price change to ignore noise
- **Clean visual controls**
- Show/hide all labels with a single toggle
- Choose between HH/LH/LL/HL text or actual **price values**
- Individual toggles & customizable colors for each structure label
- Label size & background transparency controls
- **Optional ZigZag lines**
- Connects successive pivots to visualize swing structure
- Customizable color, transparency, width, and style
- **Resistance proximity alert** (optional)
- Dynamic resistance using highest high of last `length * 2` bars
- Or choose a **Manual Resistance** price
- Visual ⚠ label on the chart when price gets within threshold
- Cooldown to avoid duplicate alerts
- **Date range filter** (optional)
- Show labels/lines only within selected time window
- Optional end date or live continuation
---
## Inputs (Quick Guide)
**Pivot Settings**
- Pivot Lookback Period — Pivot confirmation threshold
- Min Bars Between Labels — Prevents label overcrowding
- Min Price Change (Absolute) — Filters noise
**Visuals: Labels**
- Global “Show Labels”
- Toggle/Color HH / LH / LL / HL
- Price or Structure text display
- Adjustable size & transparency
**Visuals: Lines**
- Toggle pivot-connecting lines
- Width, color, transparency, style options
**Resistance Alerts**
- Enable/disable resistance proximity detection
- Manual or dynamic resistance logic
- Percent threshold + visual label options
- Cooldown in bars
**Date Range Filter**
- Restrict script drawings to a specific window
---
## How to Use
1. Start with default settings to view baseline structure.
2. Increase **Pivot Lookback Period** for smoother swings on higher TFs.
3. Adjust **Min Price Change** to filter small movements in volatile markets.
4. Enable **zigzag lines** for clearer visual swing structure.
5. Turn on **resistance alerts** if you want proactive warnings.
6. Use the **date filter** for clearer backtesting or focused study.
---
## Alerts
Alerts trigger automatically when:
- A **new HH, LH, LL, or HL** is confirmed
- Price **approaches your resistance level**
Configure alerts using TradingView’s “Create Alert” on this script.
---
## Notes & Limitations
- **BETA version**: features & settings may change in future updates.
- Labels appear **after confirmation** — pivots require lookback bars.
- Performance & appropriateness depend on market/timeframe — experiment!
---
## Disclaimer
This script is for **educational and informational purposes only** and does not constitute financial advice. Past performance does not guarantee future results. You are responsible for all investment decisions made while using this tool.
---
## License / Terms of Use
© 2025 YourName. All rights reserved.
Personal-use only. Redistribution, resale, or inclusion in paid products/services is prohibited without explicit written permission from the author.

FVG Supply and DemandThis indicator combines powerful tools into one:
• Supply & Demand Zones built from swing highs/lows with ATR-based zone width, POI markers, and Break-of-Structure (BOS) detection.
• Volumized Fair Value Gaps (FVGs) showing bullish/bearish gaps, total volume inside the gap, volume distribution, optional zone-combining, and auto-cleanup.
• Swing TSL Line and manage bar color.
It helps visualize key imbalance areas, institutional zones, and price reaction points.
Credits to the Author.
⚠️ Disclaimer
This indicator is provided for educational and analytical purposes only.
It does not provide trading advice.
Past results do not guarantee future outcomes.
Use responsibly and in conjunction with your market analysis.

Liquidation Heatmap [Alpha Extract]A sophisticated liquidity zone visualization system that identifies and maps potential liquidation levels based on swing point analysis with volume-weighted intensity measurement and gradient heatmap coloring. Utilizing pivot-based pocket detection and ATR-scaled zone heights, this indicator delivers institutional-grade liquidity mapping with dynamic color intensity reflecting relative liquidity concentration. The system's dual-swing detection architecture combined with configurable weight metrics creates comprehensive liquidation level identification suitable for strategic position planning and market structure analysis.
🔶 Advanced Pivot-Based Pocket Detection
Implements dual swing width analysis to identify potential liquidation zones at pivot highs and lows with configurable lookback periods for comprehensive level coverage. The system detects primary swing points using main pivot width and optional secondary swing detection for increased pocket density, creating layered liquidity maps that capture both major and minor liquidation levels across extended price history.
🔶 Multi-Metric Weight Calculation Engine
Features flexible weight source selection including Volume, Range (high-low spread), and Volume × Range composite metrics for liquidity intensity measurement. The system calculates pocket weights based on market activity at pivot formation, enabling traders to identify which liquidation levels represent higher concentration of potential stops and liquidations with configurable minimum weight thresholds for noise filtering.
🔶 ATR-Based Zone Height Framework
Utilizes Average True Range calculations with percentage-based multipliers to determine pocket vertical dimensions that adapt to market volatility conditions. The system creates ATR-scaled bands above swing highs for short liquidation zones and below swing lows for long liquidation zones, ensuring zone heights remain proportional to current market volatility for accurate level representation.
🔶 Dynamic Gradient Heatmap Visualization
Implements sophisticated color gradient system that maps pocket weights to intensity scales, creating intuitive visual representation of relative liquidity concentration. The system applies power-law transformation with configurable contrast adjustment to enhance differentiation between weak and strong liquidity pockets, using cyan-to-blue gradients for long liquidations and yellow-to-orange for short liquidations.
🔶 Intelligent Pocket State Management
Features advanced pocket tracking system that monitors price interaction with liquidation zones and updates pocket states dynamically. The system detects when price trades through pocket midpoints, marking them as "hit" with optional preservation or removal, and manages pocket extension for untouched levels with configurable forward projection to maintain visibility of approaching liquidity zones.
🔶 Real-Time Liquidity Scale Display
Provides gradient legend showing min-max range of pocket weights with 24-segment color bar for instant liquidity intensity reference. The system positions the scale at chart edge with volume-formatted labels, enabling traders to quickly assess relative strength of visible liquidation pockets without numerical clutter on the main chart area.
🔶 Touched Pocket Border System
Implements visual confirmation of executed liquidations through border highlighting when price trades through pocket zones. The system applies configurable transparency to touched pocket borders with inverted slider logic (lower values fade borders, higher values emphasize them), providing clear historical record of liquidated levels while maintaining focus on active untouched pockets.
🔶 Dual-Swing Density Enhancement
Features optional secondary swing width parameter that creates additional pocket layer with tighter pivot detection for increased liquidation level density. The system runs parallel pivot detection at both primary and secondary swing widths, populating chart with comprehensive liquidity mapping that captures both major swing liquidations and intermediate level clusters.
🔶 Adaptive Pocket Extension Framework
Utilizes intelligent time-based extension that projects untouched pockets forward by configurable bar count, maintaining visibility as price approaches potential liquidation zones. The system freezes touched pocket right edges at hit timestamps while extending active pockets dynamically, creating clear distinction between historical liquidations and forward-projected active levels.
🔶 Weight-Based Label Integration
Provides floating labels on untouched pockets displaying volume-formatted weight values with dynamic positioning that follows pocket extension. The system automatically manages label lifecycle, creating labels for new pockets, updating positions as pockets extend, and removing labels when pockets are touched, ensuring clean chart presentation with relevant liquidity information.
🔶 Performance Optimization Framework
Implements efficient array management with automatic clean-up of old pockets beyond lookback period and optimized box/label deletion to maintain smooth performance. The system includes configurable maximum object counts (500 boxes, 50 labels, 100 lines) with intelligent removal of oldest elements when limits are approached, ensuring consistent operation across extended timeframes.
This indicator delivers sophisticated liquidity zone analysis through pivot-based detection and volume-weighted intensity measurement with intuitive heatmap visualization. Unlike simple support/resistance indicators, the Liquidation Heatmap combines swing point identification with market activity metrics to identify where concentrated liquidations are likely to occur, while the gradient color system instantly communicates relative liquidity strength. The system's dual-swing architecture, configurable weight metrics, ATR-adaptive zone heights, and intelligent state management make it essential for traders seeking strategic position planning around institutional liquidity levels across cryptocurrency, forex, and futures markets. The visual heatmap approach enables instant identification of high-probability reversal zones where cascading liquidations may trigger significant price reactions.

Tesseract X-RayTesseract X-Ray — Smart Money Concept indicator that reveals hidden market structure.
Features:
• Fair Value Gaps (FVG) — imbalance zones where price tends to return
• Order Blocks (OB) — institutional supply/demand zones
• Volume Profile — POC, VAH, VAL levels
• High Volume Nodes (HVN) — liquidity clusters
Clean visualization with automatic zone detection and mitigation tracking.
Built-in alerts for key level touches.
by @TesseractCrypto

Unchased Wick Detector and ReversalsThis indicator can be used to track unchased wick from previous pivot points.
The idea is to visualise liquidity cluster and grab before a potential reversal.
Unchased wick Visual:
- White lines are protected highs or lows.
- Gray lines are previous wicks where prices have passed through and where the prices did not reverse.
Reversal window:
Reversal window parameters define a period range (a min and a max bars) where the reversal is valid.
The idea is that the reversal must be done in the couple bars right after the wick is chased (this event should stay short in time but you can adjust the period as you wish).
By default the default, the window 1-5 bars (e.g., daily, during 1-5 days).
Green color indicates a grab from a low and a reversal to the upside.
Red color indicates a grab from a high and a reversal to the downside.
Disclamer:
Of course this indicator can lead to false reversal signals and must be combined with other data and must be careful to use it alone for opening any position.
This indicator is a Alpha version let me know if any problem.

ZynIQ Pullback Zones Lite - (Lite Pack)Overview
ZynIQ Pullback Zones Lite identifies dynamic EMA-based retracement areas inside trending markets. These zones highlight where price is most likely to pull back before continuing in the dominant direction. The tool is intentionally simple, visual, and designed to complement the rest of the ZynIQ Lite package without adding noise or complexity.
This is a contextual tool — ideal for timing continuation entries, filtering counter-trend trades, and improving overall trend structure awareness.
Key Features
• Dynamic pullback zones using profile-based EMA + ATR
• Smart trend detection with optional HTF confirmation
• Fresh-touch recognition for potential continuation setups
• Clean ZynIQ-themed visuals (teal/fuchsia zones)
• Lightweight chart footprint for intraday and swing traders
• ZynIQ Lite HUD with profile, trend and HTF status
• Moveable watermark for clear branding on streams and screenshots
• Alerts for long and short pullback opportunities
Use Cases
• Identifying pullback areas within established trends
• Avoiding early entries during retracements
• Timing continuation setups more cleanly
• Filtering false breakouts and counter-trend traps
• Combining with breakout or momentum tools for confluence
• Works on crypto, forex, indices and commodities
Notes
This tool provides structure and context for pullback-based trend trading.
It is not a standalone strategy and should be combined with your preferred confirmations and risk management rules.

Bubbles + Clusters + SweepsIndicator For Bubbles + Clusters + Sweeps
✔ Volume bubbles
✔ Delta coloring (green/red intensity)
✔ Auto supply/demand zones
✔ Volume-profile style blocks inside zones
✔ Liquidity sweep markers
✔ Box drawings extending until filled
✔ Optional bubble filters (min-volume threshold)

SR & POI Indicator//@version=5
indicator(title='SR & POI Indicator', overlay=true, max_boxes_count=500, max_lines_count=500, max_labels_count=500)
//============================================================================
// SUPPLY/DEMAND & POI SETTINGS
//============================================================================
swing_length = input.int(10, title = 'Swing High/Low Length', group = 'Supply/Demand Settings', minval = 1, maxval = 50)
history_of_demand_to_keep = input.int(20, title = 'History To Keep', group = 'Supply/Demand Settings', minval = 5, maxval = 50)
box_width = input.float(2.5, title = 'Supply/Demand Box Width', group = 'Supply/Demand Settings', minval = 1, maxval = 10, step = 0.5)
show_price_action_labels = input.bool(false, title = 'Show Price Action Labels', group = 'Supply/Demand Visual Settings')
supply_color = input.color(color.new(#EDEDED,70), title = 'Supply', group = 'Supply/Demand Visual Settings', inline = '3')
supply_outline_color = input.color(color.new(color.white,75), title = 'Outline', group = 'Supply/Demand Visual Settings', inline = '3')
demand_color = input.color(color.new(#00FFFF,70), title = 'Demand', group = 'Supply/Demand Visual Settings', inline = '4')
demand_outline_color = input.color(color.new(color.white,75), title = 'Outline', group = 'Supply/Demand Visual Settings', inline = '4')
bos_label_color = input.color(color.white, title = 'BOS Label', group = 'Supply/Demand Visual Settings')
poi_label_color = input.color(color.white, title = 'POI Label', group = 'Supply/Demand Visual Settings')
swing_type_color = input.color(color.black, title = 'Price Action Label', group = 'Supply/Demand Visual Settings')
//============================================================================
// SR SETTINGS
//============================================================================
enableSR = input(true, "SR On/Off", group="SR Settings")
colorSup = input(#00DBFF, "Support Color", group="SR Settings")
colorRes = input(#E91E63, "Resistance Color", group="SR Settings")
strengthSR = input.int(2, "S/R Strength", 1, group="SR Settings")
lineStyle = input.string("Dotted", "Line Style", , group="SR Settings")
lineWidth = input.int(2, "S/R Line Width", 1, group="SR Settings")
useZones = input(true, "Zones On/Off", group="SR Settings")
useHLZones = input(true, "High Low Zones On/Off", group="SR Settings")
zoneWidth = input.int(2, "Zone Width %", 0, tooltip="it's calculated using % of the distance between highest/lowest in last 300 bars", group="SR Settings")
expandSR = input(true, "Expand SR", group="SR Settings")
//============================================================================
// SUPPLY/DEMAND FUNCTIONS
//============================================================================
// Function to add new and remove last in array
f_array_add_pop(array, new_value_to_add) =>
array.unshift(array, new_value_to_add)
array.pop(array)
// Function for swing H & L labels
f_sh_sl_labels(array, swing_type) =>
var string label_text = na
if swing_type == 1
if array.get(array, 0) >= array.get(array, 1)
label_text := 'HH'
else
label_text := 'LH'
label.new(bar_index - swing_length, array.get(array,0), text = label_text, style=label.style_label_down, textcolor = swing_type_color, color = color.new(swing_type_color, 100), size = size.tiny)
else if swing_type == -1
if array.get(array, 0) >= array.get(array, 1)
label_text := 'HL'
else
label_text := 'LL'
label.new(bar_index - swing_length, array.get(array,0), text = label_text, style=label.style_label_up, textcolor = swing_type_color, color = color.new(swing_type_color, 100), size = size.tiny)
// Function to check overlapping
f_check_overlapping(new_poi, box_array, atr) =>
atr_threshold = atr * 2
okay_to_draw = true
for i = 0 to array.size(box_array) - 1
top = box.get_top(array.get(box_array, i))
bottom = box.get_bottom(array.get(box_array, i))
poi = (top + bottom) / 2
upper_boundary = poi + atr_threshold
lower_boundary = poi - atr_threshold
if new_poi >= lower_boundary and new_poi <= upper_boundary
okay_to_draw := false
break
else
okay_to_draw := true
okay_to_draw
// Function to draw supply or demand zone
f_supply_demand(value_array, bn_array, box_array, label_array, box_type, atr) =>
atr_buffer = atr * (box_width / 10)
box_left = array.get(bn_array, 0)
box_right = bar_index
var float box_top = 0.00
var float box_bottom = 0.00
var float poi = 0.00
if box_type == 1
box_top := array.get(value_array, 0)
box_bottom := box_top - atr_buffer
poi := (box_top + box_bottom) / 2
else if box_type == -1
box_bottom := array.get(value_array, 0)
box_top := box_bottom + atr_buffer
poi := (box_top + box_bottom) / 2
okay_to_draw = f_check_overlapping(poi, box_array, atr)
if box_type == 1 and okay_to_draw
box.delete( array.get(box_array, array.size(box_array) - 1) )
f_array_add_pop(box_array, box.new( left = box_left, top = box_top, right = box_right, bottom = box_bottom, border_color = supply_outline_color,
bgcolor = supply_color, extend = extend.right, text = 'SUPPLY', text_halign = text.align_center, text_valign = text.align_center, text_color = poi_label_color, text_size = size.small, xloc = xloc.bar_index))
box.delete( array.get(label_array, array.size(label_array) - 1) )
f_array_add_pop(label_array, box.new( left = box_left, top = poi, right = box_right, bottom = poi, border_color = color.new(poi_label_color,90),
bgcolor = color.new(poi_label_color,90), extend = extend.right, text = 'POI', text_halign = text.align_left, text_valign = text.align_center, text_color = poi_label_color, text_size = size.small, xloc = xloc.bar_index))
else if box_type == -1 and okay_to_draw
box.delete( array.get(box_array, array.size(box_array) - 1) )
f_array_add_pop(box_array, box.new( left = box_left, top = box_top, right = box_right, bottom = box_bottom, border_color = demand_outline_color,
bgcolor = demand_color, extend = extend.right, text = 'DEMAND', text_halign = text.align_center, text_valign = text.align_center, text_color = poi_label_color, text_size = size.small, xloc = xloc.bar_index))
box.delete( array.get(label_array, array.size(label_array) - 1) )
f_array_add_pop(label_array, box.new( left = box_left, top = poi, right = box_right, bottom = poi, border_color = color.new(poi_label_color,90),
bgcolor = color.new(poi_label_color,90), extend = extend.right, text = 'POI', text_halign = text.align_left, text_valign = text.align_center, text_color = poi_label_color, text_size = size.small, xloc = xloc.bar_index))
// Function to change supply/demand to BOS if broken
f_sd_to_bos(box_array, bos_array, label_array, zone_type) =>
if zone_type == 1
for i = 0 to array.size(box_array) - 1
level_to_break = box.get_top(array.get(box_array,i))
if close >= level_to_break
copied_box = box.copy(array.get(box_array,i))
f_array_add_pop(bos_array, copied_box)
mid = (box.get_top(array.get(box_array,i)) + box.get_bottom(array.get(box_array,i))) / 2
box.set_top(array.get(bos_array,0), mid)
box.set_bottom(array.get(bos_array,0), mid)
box.set_extend( array.get(bos_array,0), extend.none)
box.set_right( array.get(bos_array,0), bar_index)
box.set_text( array.get(bos_array,0), 'BOS' )
box.set_text_color( array.get(bos_array,0), bos_label_color)
box.set_text_size( array.get(bos_array,0), size.small)
box.set_text_halign( array.get(bos_array,0), text.align_center)
box.set_text_valign( array.get(bos_array,0), text.align_center)
box.delete(array.get(box_array, i))
box.delete(array.get(label_array, i))
if zone_type == -1
for i = 0 to array.size(box_array) - 1
level_to_break = box.get_bottom(array.get(box_array,i))
if close <= level_to_break
copied_box = box.copy(array.get(box_array,i))
f_array_add_pop(bos_array, copied_box)
mid = (box.get_top(array.get(box_array,i)) + box.get_bottom(array.get(box_array,i))) / 2
box.set_top(array.get(bos_array,0), mid)
box.set_bottom(array.get(bos_array,0), mid)
box.set_extend( array.get(bos_array,0), extend.none)
box.set_right( array.get(bos_array,0), bar_index)
box.set_text( array.get(bos_array,0), 'BOS' )
box.set_text_color( array.get(bos_array,0), bos_label_color)
box.set_text_size( array.get(bos_array,0), size.small)
box.set_text_halign( array.get(bos_array,0), text.align_center)
box.set_text_valign( array.get(bos_array,0), text.align_center)
box.delete(array.get(box_array, i))
box.delete(array.get(label_array, i))
// Function to extend box endpoint
f_extend_box_endpoint(box_array) =>
for i = 0 to array.size(box_array) - 1
box.set_right(array.get(box_array, i), bar_index + 100)
//============================================================================
// SR FUNCTIONS
//============================================================================
percWidth(len, perc) => (ta.highest(len) - ta.lowest(len)) * perc / 100
//============================================================================
// SUPPLY/DEMAND CALCULATIONS
//============================================================================
atr = ta.atr(50)
swing_high = ta.pivothigh(high, swing_length, swing_length)
swing_low = ta.pivotlow(low, swing_length, swing_length)
var swing_high_values = array.new_float(5,0.00)
var swing_low_values = array.new_float(5,0.00)
var swing_high_bns = array.new_int(5,0)
var swing_low_bns = array.new_int(5,0)
var current_supply_box = array.new_box(history_of_demand_to_keep, na)
var current_demand_box = array.new_box(history_of_demand_to_keep, na)
var current_supply_poi = array.new_box(history_of_demand_to_keep, na)
var current_demand_poi = array.new_box(history_of_demand_to_keep, na)
var supply_bos = array.new_box(5, na)
var demand_bos = array.new_box(5, na)
// New swing high
if not na(swing_high)
f_array_add_pop(swing_high_values, swing_high)
f_array_add_pop(swing_high_bns, bar_index )
if show_price_action_labels
f_sh_sl_labels(swing_high_values, 1)
f_supply_demand(swing_high_values, swing_high_bns, current_supply_box, current_supply_poi, 1, atr)
// New swing low
else if not na(swing_low)
f_array_add_pop(swing_low_values, swing_low)
f_array_add_pop(swing_low_bns, bar_index )
if show_price_action_labels
f_sh_sl_labels(swing_low_values, -1)
f_supply_demand(swing_low_values, swing_low_bns, current_demand_box, current_demand_poi, -1, atr)
f_sd_to_bos(current_supply_box, supply_bos, current_supply_poi, 1)
f_sd_to_bos(current_demand_box, demand_bos, current_demand_poi, -1)
f_extend_box_endpoint(current_supply_box)
f_extend_box_endpoint(current_demand_box)
//============================================================================
// SR CALCULATIONS & PLOTTING
//============================================================================
rb = 10
prd = 284
ChannelW = 10
label_loc = 55
style = lineStyle == "Solid" ? line.style_solid : lineStyle == "Dotted" ? line.style_dotted : line.style_dashed
ph = ta.pivothigh(rb, rb)
pl = ta.pivotlow (rb, rb)
sr_levels = array.new_float(21, na)
prdhighest = ta.highest(prd)
prdlowest = ta.lowest(prd)
cwidth = percWidth(prd, ChannelW)
zonePerc = percWidth(300, zoneWidth)
aas = array.new_bool(41, true)
u1 = 0.0, u1 := nz(u1 )
d1 = 0.0, d1 := nz(d1 )
highestph = 0.0, highestph := highestph
lowestpl = 0.0, lowestpl := lowestpl
var sr_levs = array.new_float(21, na)
label hlabel = na, label.delete(hlabel )
label llabel = na, label.delete(llabel )
var sr_lines = array.new_line(21, na)
var sr_linesH = array.new_line(21, na)
var sr_linesL = array.new_line(21, na)
var sr_linesF = array.new_linefill(21, na)
var sr_labels = array.new_label(21, na)
if ph or pl
for x = 0 to array.size(sr_levels) - 1
array.set(sr_levels, x, na)
highestph := prdlowest
lowestpl := prdhighest
countpp = 0
for x = 0 to prd
if na(close )
break
if not na(ph ) or not na(pl )
highestph := math.max(highestph, nz(ph , prdlowest), nz(pl , prdlowest))
lowestpl := math.min(lowestpl, nz(ph , prdhighest), nz(pl , prdhighest))
countpp += 1
if countpp > 40
break
if array.get(aas, countpp)
upl = (ph ? high : low ) + cwidth
dnl = (ph ? high : low ) - cwidth
u1 := countpp == 1 ? upl : u1
d1 := countpp == 1 ? dnl : d1
tmp = array.new_bool(41, true)
cnt = 0
tpoint = 0
for xx = 0 to prd
if na(close )
break
if not na(ph ) or not na(pl )
chg = false
cnt += 1
if cnt > 40
break
if array.get(aas, cnt)
if not na(ph )
if high <= upl and high >= dnl
tpoint += 1
chg := true
if not na(pl )
if low <= upl and low >= dnl
tpoint += 1
chg := true
if chg and cnt < 41
array.set(tmp, cnt, false)
if tpoint >= strengthSR
for g = 0 to 40 by 1
if not array.get(tmp, g)
array.set(aas, g, false)
if ph and countpp < 21
array.set(sr_levels, countpp, high )
if pl and countpp < 21
array.set(sr_levels, countpp, low )
// Plot SR
var line highest_ = na, line.delete(highest_)
var line lowest_ = na, line.delete(lowest_)
var line highest_fill1 = na, line.delete(highest_fill1)
var line highest_fill2 = na, line.delete(highest_fill2)
var line lowest_fill1 = na, line.delete(lowest_fill1)
var line lowest_fill2 = na, line.delete(lowest_fill2)
hi_col = close >= highestph ? colorSup : colorRes
lo_col = close >= lowestpl ? colorSup : colorRes
if enableSR
highest_ := line.new(bar_index - 311, highestph, bar_index, highestph, xloc.bar_index, expandSR ? extend.both : extend.right, hi_col, style, lineWidth)
lowest_ := line.new(bar_index - 311, lowestpl , bar_index, lowestpl , xloc.bar_index, expandSR ? extend.both : extend.right, lo_col, style, lineWidth)
if useHLZones
highest_fill1 := line.new(bar_index - 311, highestph + zonePerc, bar_index, highestph + zonePerc, xloc.bar_index, expandSR ? extend.both : extend.right, na)
highest_fill2 := line.new(bar_index - 311, highestph - zonePerc, bar_index, highestph - zonePerc, xloc.bar_index, expandSR ? extend.both : extend.right, na)
lowest_fill1 := line.new(bar_index - 311, lowestpl + zonePerc , bar_index, lowestpl + zonePerc , xloc.bar_index, expandSR ? extend.both : extend.right, na)
lowest_fill2 := line.new(bar_index - 311, lowestpl - zonePerc , bar_index, lowestpl - zonePerc , xloc.bar_index, expandSR ? extend.both : extend.right, na)
linefill.new(highest_fill1, highest_fill2, color.new(hi_col, 80))
linefill.new(lowest_fill1 , lowest_fill2 , color.new(lo_col, 80))
if ph or pl
for x = 0 to array.size(sr_lines) - 1
array.set(sr_levs, x, array.get(sr_levels, x))
for x = 0 to array.size(sr_lines) - 1
line.delete(array.get(sr_lines, x))
line.delete(array.get(sr_linesH, x))
line.delete(array.get(sr_linesL, x))
linefill.delete(array.get(sr_linesF, x))
if array.get(sr_levs, x) and enableSR
line_col = close >= array.get(sr_levs, x) ? colorSup : colorRes
array.set(sr_lines, x, line.new(bar_index - 355, array.get(sr_levs, x), bar_index, array.get(sr_levs, x), xloc.bar_index, expandSR ? extend.both : extend.right, line_col, style, lineWidth))
if useZones
array.set(sr_linesH, x, line.new(bar_index - 355, array.get(sr_levs, x) + zonePerc, bar_index, array.get(sr_levs, x) + zonePerc, xloc.bar_index, expandSR ? extend.both : extend.right, na))
array.set(sr_linesL, x, line.new(bar_index - 355, array.get(sr_levs, x) - zonePerc, bar_index, array.get(sr_levs, x) - zonePerc, xloc.bar_index, expandSR ? extend.both : extend.right, na))
array.set(sr_linesF, x, linefill.new(array.get(sr_linesH, x), array.get(sr_linesL, x), color.new(line_col, 80)))
for x = 0 to array.size(sr_labels) - 1
label.delete(array.get(sr_labels, x))
if array.get(sr_levs, x) and enableSR
lab_loc = close >= array.get(sr_levs, x) ? label.style_label_up : label.style_label_down
lab_col = close >= array.get(sr_levs, x) ? colorSup : colorRes
array.set(sr_labels, x, label.new(bar_index + label_loc, array.get(sr_levs, x), str.tostring(math.round_to_mintick(array.get(sr_levs, x))), color=lab_col , textcolor=#000000, style=lab_loc))
hlabel := enableSR ? label.new(bar_index + label_loc + math.round(math.sign(label_loc)) * 20, highestph, "High Level : " + str.tostring(highestph), color=hi_col, textcolor=#000000, style=label.style_label_down) : na
llabel := enableSR ? label.new(bar_index + label_loc + math.round(math.sign(label_loc)) * 20, lowestpl , "Low Level : " + str.tostring(lowestpl) , color=lo_col, textcolor=#000000, style=label.style_label_up ) : na

Structure Breakout - Buy Sell IndicatorStructure Breakout - Buy Sell Indicator
📈 OVERVIEW:
A minimalist indicator that identifies market structure breakouts using swing point analysis.
Displays clear blue buy arrows and red sell arrows when price breaks key swing levels.
🔧 HOW IT WORKS:
1. Identifies swing highs and lows using configurable lookback period
2. Triggers BUY signal (blue arrow) when price closes above previous swing high
3. Triggers SELL signal (red arrow) when price closes below previous swing low
4. Uses clean visual arrows without cluttering the chart
⚙️ KEY FEATURES:
• Clean, uncluttered visual signals
• Customizable sensitivity period
• Blue arrows for buy signals (below bars)
• Red arrows for sell signals (above bars)
• No lagging repainting
• Works on all timeframes
🎯 TRADING APPLICATIONS:
• Swing trading entries
• Breakout confirmation
• Trend continuation signals
• Support/resistance breaks
⚡ SETTINGS:
• Structure Detection Period (default: 20) - Adjust sensitivity of swing detection
⚠️ RISK DISCLAIMER:
This is an educational tool. Always use proper risk management.
Past performance does not guarantee future results.

Auto Reaction Zones (XAUUSD)
✅ Auto Reaction Zones (XAUUSD) OANDA:XAUUSD
Auto Reaction Zones (XAUUSD) is an advanced supply & demand mapping tool designed to detect high-probability reaction zones using price impulses, volatility filters, market structure, and adaptive confirmation logic.
This indicator automatically identifies strong bullish and bearish reaction bases formed before impulsive movements, then plots dynamic demand and supply zones that help traders anticipate future reactions, reversals, or continuation points.
🔍 Core Features
▪ Automatic Supply & Demand Zone Detection
Identifies zones based on structural breakout impulses using ATR-based thresholds, volume confirmation, and validated base levels.
▪ Adaptive Confirmation Distance (ADR-Based)
The zone becomes active/confirmed only after price moves a configurable number of points.
A unique 3-case ADR logic adjusts the required confirmation distance based on current market volatility:
Case 1: Low ADR → smaller confirmation required
Case 2: Moderate ADR → medium confirmation
Case 3: High ADR → higher confirmation (more filtering)
This ensures stronger zones in high-volatility conditions (e.g., XAUUSD).
▪ Smart Zone Management
Automatic extension until tested or consumed
Optional lifetime limits (bars or days)
Auto-delete unconfirmed zones if price violates them too early
Hide tested or consumed zones for a cleaner chart
▪ Adjustable Zone Size Filtering
Option to enforce a minimum or maximum zone size, useful for cleaning noise and ultra-small reaction levels.
▪ ADR-Based Zone Spacing Filter
Prevents the creation of zones that are too close to each other.
Different spacing rules for same-direction and opposite-direction zones.
▪ Multi-Timeframe Mode
Overlay zones detected from higher timeframes directly onto your current chart.
▪ Directional Bias (EMA Filter)
Optionally restrict long/short zones based on EMA trend alignment.
▪ Real-Time Alerts
Receive alerts when price touches any active zone or only fresh zones.
🎯 Why This Indicator Is Different
Unlike typical supply/demand indicators that print every swing,
Auto Reaction Zones focuses on:
Only strong reaction bases
Only valid impulse-generated levels
Only zones confirmed by price movement
Only zones that respect volatility and minimum spacing rules
This results in cleaner charting, fewer false zones, and far more reliable reaction levels, especially on volatile instruments like XAUUSD.
⚠️ Disclaimer
This tool is not financial advice. Always combine zone analysis with broader market context and risk management.

6EMA & SMA with alertOverview
This indicator is designed to combine multiple moving averages, higher-timeframe levels, and flexible alerts into a single tool. It helps you monitor trend direction, dynamic support/resistance, and key daily/weekly/monthly levels without loading several separate indicators.
Main Features
1 12 Moving Averages in One Indicator
・Plots a total of 12 lines: 6 EMAs and 6 SMAs.
・All lengths and sources are fully configurable from the settings, so you can adapt them to your own style and timeframe.
2 Slope-Based Color Change
・One EMA and one SMA are colored based on their slope (rising vs. falling).
・This makes it easy to visually confirm when the medium/long-term bias is turning up or down.
3 Price-vs-MA Alerts
・You can enable alerts when price touches or crosses any selected EMA or SMA.
・Direction can be set to “Up”, “Down”, or “Both”, and you can choose to trigger only on bar close.
・The script can also send detailed alert() messages containing the symbol, timeframe, price, and line value at the moment of the cross.
4 Daily / Weekly / Monthly High–Low Levels
・Optionally display the current Daily, Weekly, and Monthly high/low levels as rays extended to the right.
・Each set of levels can be shown or hidden individually, and has its own color, style, and width options.
・Labels (DH/DL, WH/WL, MH/ML) are attached at the right side of each line for quick identification.
Notes & Disclaimer
This indicator is for charting and alerting purposes only. It does not open, close, or manage any positions.
It does not guarantee any specific results or performance. All examples are for educational and informational purposes only.
Always test and adjust the settings on your own symbols and timeframes, and use proper risk management when applying it to live trading.

Multiple Moving Averages by BadshahIntroduction Streamline your technical analysis with the Quintuple MA Strategy Suite, a robust all-in-one utility designed to maximize chart efficiency. Instead of cluttering your workspace with multiple individual indicators, this script empowers you to deploy up to five fully customizable Moving Averages simultaneously. Whether you are tracking micro-trends for scalping or major baselines for swing trading, this tool adapts to every timeframe and style.
Core Features
5-in-1 Architecture: Run five independent moving averages at once, saving your precious indicator slots for other tools.
Hybrid Calculation Modes: Instantly toggle any line between Simple Moving Average (SMA) for smooth baselines and Exponential Moving Average (EMA) for weight-sensitive reactions to recent price action.
Smart labeling System: Features an intelligent labeling mechanism that places text tags slightly offset from the current price. This ensures you can instantly identify which line is which (e.g., "EMA 50" vs "SMA 200") without the text obscuring the latest candles.
Granular Control: Every aspect is customizable. You can independently adjust the Length, Source (Close, Open, High, Low, etc.), Color, and Visibility for each of the five MAs.
Practical Use Cases
The "Golden Cross" Setup: Enable MA 3 (50 Length) and MA 5 (200 Length) to automatically visually track major trend reversals.
Ribbon Trading: Enable all five lines with sequential lengths (e.g., 20, 50, 100, 150, 200) to create a "Moving Average Ribbon," visualizing the strength and direction of the trend expansion.
Scalping Cross: Use MA 1 and MA 2 set to fast lengths (like 9 and 21) to catch rapid momentum shifts.
Settings Guide
Show MA: Toggles the visibility of the specific line.
Show Label: Toggles the text tag next to the line (auto-offset by 5 bars).
Type: Select between SMA or EMA calculation.
Length: Define the lookback period for the average.
Disclaimer This script is provided for educational and analytical purposes only. Past performance of indicators does not guarantee future results. Trade responsibly.

SMC Indicator by BadshahIntroduction
Unlock the hidden narrative of price action with this focused Smart Money Concepts (SMC) toolkit. Designed for precision and clarity, this indicator strips away chart noise to reveal the "skeleton" of the market. Whether you are tracking trend continuations or hunting for valid reversals, this tool automates the technical heavy lifting, allowing you to focus purely on execution.
How It Works
This script analyzes price action in real-time to map out two critical components of institutional trading:
1. Market Structure Architecture The indicator uses a rolling pivot algorithm to identify significant Highs and Lows based on your preferred sensitivity.
BOS (Break of Structure): Marks the confirmation of trend momentum. A solid line is drawn when price successfully closes beyond a structural pivot in the direction of the trend (e.g., breaking a high in an uptrend).
ChoCh (Change of Character): signals a potential shift in market sentiment. A dashed line appears when price violates a key swing point opposite to the prevailing trend, often the first sign of a reversal.
2. Liquidity Inefficiencies (FVG) The script scans every candle formation to detect Fair Value Gaps (Imbalances)—zones where aggressive buying or selling occurred without reciprocal trading.
Bullish Gaps: Highlighted when a candle's low fails to overlap with the high of the candle two periods prior.
Bearish Gaps: Highlighted when a candle's high fails to overlap with the low of the candle two periods prior.
These boxes extend forward, serving as high-probability "magnets" for price to revisit and rebalance.
Settings & Customization
Swing Length: Adjust the lookback period to tune the indicator for Scalping (lower values) or Swing Trading (higher values).
Visual Control: Toggle specific features (BOS, ChoCh, FVG) on or off and fully customize colors to blend with your chart theme.
Disclaimer
This indicator is strictly for analytical and educational purposes. It visualizes historical and real-time data but does not guarantee future market movements. Always manage your risk responsibly.
A.I. 👑 Optimus Prime [RubiXalgo]A.I. OPTIMUS PRIME — RUBIK’S ALGO EDITION (2025)
▬▬▬▬▬▬▬▬▬▬▬▬▬▬▬▬▬▬▬▬▬▬▬▬▬▬▬▬▬▬▬▬▬▬▬▬▬▬▬▬▬▬▬
Imagine a Rubik’s Cube spinning inside another Rubik’s Cube.
The outer cube = Supply / Demand structure
The inner cube = Trend / xTrend (price + volume momentum)
While speed-cubers solve cubes blindfolded and while juggling,
the tiny hand movements they make are eerily similar to real market microstructure.
This indicator tries to visualize that analogy using heavy Kalman filtering,
k-Nearest-Neighbors regression, LOWESS smoothing, dynamic volume delta,
and machine-learning-driven color gradients — all wrapped in a clean visual language.
Features
• Dual Kalman “Rubik” trend lines (fast + slow) with adaptive noise models
• AI candle coloring (optional) using trend-angle + momentum gradients
• Dynamic Linear Regression Volume Profile (slanted VPOC channel)
• Volume Profit-Trend polyline (walk-forward volume delta prediction)
• Liquidation / Target window with automatic stop-loss & 3 take-profit levels
• Up to 5 multi-timeframe moving averages (SMA/DEMA/TEMA/VWMA) + trend table
• All calculations use dynamic scaling (VSQC lookback) so the same settings stay relevant
across timeframes and assets
How to trade it (simple version)
• Green fast + slow line → bullish bias
• Red fast + slow line → bearish bias
• Green liquidation window + green volume polyline → high-probability long setup
• Red liquidation window + red volume polyline → high-probability short setup
• Targets are drawn automatically — aim for Target 2 or 3 (3:1+ RR typical)
Educational note
This script is shared for learning and experimentation purposes only.
It is not financial advice. Trading involves risk. Test thoroughly on demo before live use.
Credits & inspiration
Heavily inspired by Zeiierman, ChartPrime, LuxAlgo, BigBeluga, DeltaSeek,
and many open-source Pine coders. Special thanks to the entire TradingView community.
© 2025 StupidBitcoin — Open source under Mozilla Public License 2.0 + CC BY-NC-SA 4.0
Feel free to fork, improve, and share — just keep the credits.
↦ (Paste the full working code here — the one you already have, starting with string X7K9P = ... and ending with the last plot)
- Legal & fair-use footer (keeps it clean and TV-compliant)
Disclaimer
This script is published for educational purposes only.
It is not investment advice. Use at your own risk.
License
Mozilla Public License 2.0 — mozilla.org
Creative Commons Attribution-NonCommercial-ShareAlike 4.0 — creativecommons.org
// Enjoy the cube.
// StupidBitcoin — 2025

Custom Session Static Breakout Levels
This indicator defines a trading session based on user-specified time and a custom GMT timezone. Its primary function is to provide traders with fixed historical data rather than dynamic information.
Core Logic:
Dynamic Box Update: While the price remains within the session, the "Box" (dynamic high/low) tracks the current session's extreme prices.
Static Level Anchoring: The moment price breaks above the session's high or below its low, the Box updates, and a static horizontal price line is immediately drawn at the previous, unbroken extreme (the historical support/resistance of the Box).
Breakout Identification: The candle responsible for the breakout is clearly marked, providing traders with an anchor point for fixed, structural analysis.

Price Action Strategy v2.0 [Ista]💎 Overview
Price Action Strategy v2.0 is a comprehensive, all-in-one institutional trading toolkit designed for visual traders who demand precision. Unlike standard indicators, this tool focuses on the narrative of price by combining advanced Market Structure, Institutional Order Flow, and Predictive Analytics into a single, non-cluttered interface.
The core philosophy of this script is "Clean Precision". It filters out noise and presents only the most critical decision-making data via smart chart overlays and a state-of-the-art Analytic Dashboard.
🚀 Key Features
1. 🏛️ Institutional Order Blocks (Origin Scan Engine)
This is not a standard pivot-based OB indicator. We utilize a proprietary "Origin Scan" algorithm that:
Detects the exact origin candle responsible for a structural break (BOS).
Filters out weak blocks, keeping only the most significant institutional footprints.
Smart Management: Limits active blocks to the 3 most recent per side (Support/Resistance) to keep charts clean.
Ghost Mode: When an Order Block is broken, it doesn't just disappear; it turns into a faint "Ghost" level, allowing you to see historical reactions without visual clutter.
2. 🔮 Echo Forecast (Predictive Path)
A powerful forecasting engine based on Pattern Similarity:
Scans historical price action (Evaluation Window) to find patterns mathematically similar to the current market state.
Projects the most likely future path (Forecast Window) directly onto the chart.
Uses a cumulative calculation method to smooth out noise and provide a realistic trajectory.
Visual Coding: The forecast line thickens and changes color based on the Confidence Score (Correlation %). High confidence patterns (>80%) are highlighted in deep green.
3. 📊 ISTA Command Center (Analytic Dashboard)
A professional, compact, and right-aligned dashboard that acts as your trading HUD. It monitors 8 vital market vitals in real-time:
Market Structure: Real-time Swing trend direction.
HTF Trend: Higher Timeframe bias (Price Action based).
Momentum: Current & HTF RSI status (Overbought/Oversold).
MACD: Signal crossover status.
Smart Money Flow (MFI): Detects institutional accumulation/distribution.
Volatility (ATR%): Current market volatility percentage.
Forecast Confidence: The statistical reliability of the current Echo Forecast.
4. 📉 Dynamic EMAs
Includes three key moving averages (20, 200, 1440) with dynamic transparency logic. They fade into the background when not interacting with price, ensuring they are there when you need them but invisible when you don't.
🛠️ How to Use
Identify Trend: Look at the Dashboard. If Structure and HTF Trend align (e.g., both Bullish), look for longs.
Wait for Pullback: Wait for price to return to a Bullish Order Block.
Confirm: Check the Forecast line. Does it suggest a bounce? Check MFI and RSI on the dashboard for oversold conditions.
Execute: Use the Order Block edges for precise entry and invalidation points.
⚙️ Settings
Swing Length: Adjust sensitivity of the structure (Default: 10).
Evaluation Window: How far back the Echo Forecast looks for patterns (Default: 300).
Dashboard: Fully customizable position and size.
Developed by Soheil_kheiri | Ista Web Analytics

Session, Weekly, Daily LevelsScroll down for hungarian description!
Magyar leíráshoz görgess lejjebb!
Overview
This script provides a unified market structure mapping tool that automatically identifies and visualizes key intraday, daily, and weekly reference levels. It helps traders contextualize price action throughout the trading week by marking true session opens, previous day highs/lows, weekly highs/lows, and weekday opens, all with accurate historical anchoring and correct timezone handling.
What This Script Does
1. Intraday Session Opens (Tokyo, London, New York)
- Detects the exact candle where each session opens.
- Draws horizontal rays with labels.
- Automatically clears lines at the start of each new day.
- Uses a custom local-to-exchange timezone conversion system.
2. Weekly Levels
- Last week high and low (precise bar anchoring, not HTF aggregation)
- Current week open (also Monday open)
- Auto-reset on new week
- Levels are always drawn from the true candle where they formed.
3. Previous Day High & Low
- Continuously tracks intraday highs and lows.
- On a new day, stores yesterday’s values and anchors rays to the exact bars.
- Levels remain visible for the full current day and reset the next day.
4. Weekday Opens (Tue–Fri)
- Captures the exact opening price of Tuesday–Friday.
- Monday open = Week open, so it is not shown separately.
- Auto-reset on new week.
Timezone Logic (Original Feature)
The script converts:
local session times → exchange timezone → chart timestamps
It works correctly regardless of chart timezone or instrument exchange location.
Line Drawing Logic
- Finds the exact bar_index where each level forms.
- Draws rays extending to the right.
- Labels are placed ahead of price.
- Safe updating prevents “bar index too far” errors.
How to Use
- Identify daily/weekly structure.
- Track bias relative to session opens.
- Observe reactions around weekday opens.
- Compare price action to last week's range.
Originality
- Custom timezone conversion engine.
- True historical bar anchoring.
- Fully automated weekly/daily structural resets.
- Independent styling for each level type.
- Not a mashup; all components follow one unified logic.
Limitations
- Does not predict trend or direction.
- Structural tool only.
Summary
A precise and reliable market structure tool that unifies weekly, daily, and intraday reference levels with full timezone automation and true-candle anchoring.
MAGYAR LEÍRÁS
--------------
Áttekintés
Ez az indikátor egy összetett piaci szerkezet-feltérképező eszköz, amely automatikusan megjeleníti a legfontosabb intraday, napi és heti referenciaértékeket. A célja, hogy a kereskedő tisztán lássa a piac aktuális környezetét: hol nyíltak a főbb devizapiaci szekciók, hogyan alakult a tegnapi tartomány, hol volt a múlt heti csúcs/mélypont, és hogyan nyitottak az egyes hétköznapok.
Mit tud a script?
1. Szekciónyitások (Tokyo, London, New York)
- Megkeresi a pontos gyertyát, amely a szekciónyitáskori árat tartalmazza.
- Vízszintes vonalat és címkét rajzol.
- Minden nap elején automatikusan törli a korábbi nap szintjeit.
- Egyedi időzóna-konverziós rendszerrel működik (helyi idő → tőzsdei idő → chart idő).
2. Heti szintek
- Múlt heti maximum és minimum (pontos gyertyapontra horgonyozva)
- Aktuális heti nyitóár (egyben a hétfői nyitó is)
- Új hét kezdetekor automatikusan frissül.
- A múlt heti high/low nem fix időpontra, hanem a valódi gyertyára kerül.
3. Előző napi High és Low
- Folyamatosan követi a napi maximumot és minimumot.
- Napváltáskor elmenti és pontos gyertyáról indítja a ray-t.
- A szintek a teljes nap folyamán megmaradnak, majd a következő nap törlődnek.
4. Hétköznapok nyitóárai (Kedd–Péntek)
- A kedd, szerda, csütörtök és péntek nyitóárát rögzíti és megjeleníti.
- A hétfői nyitó a Week Open, ezért külön nem jelenik meg.
- Heti váltáskor automatikusan törlődnek.
Időzóna-kezelés (egyedi megoldás)
A script a felhasználó helyi idejét átszámítja az instrumentum tőzsdei időzónájára, majd a chartra vetíti.
Ez biztosítja, hogy minden szekciónyitás helyesen jelenik meg, bármely chart vagy instrumentum esetén.
Vonalrajzolási logika
- A szintek a valódi bar_index alapján kerülnek rögzítésre.
- Jobbra nyúló ray-eket rajzol.
- A címkék mindig a jobb oldalon, előre helyezve jelennek meg.
- Biztonságos frissítési rendszer akadályozza meg a hibákat (pl. “bar index too far”).
Használat
- Napi/heti szerkezet meghatározása.
- Bias követése a session openekhez viszonyítva.
- Reakciók figyelése a hétköznapok nyitóárai körül.
- Összevetés a múlt heti tartománnyal.
Eredetiség
- Egyedi időzóna-kezelő motor.
- Igazi gyertyapont-alapú horgonyzás.
- Automatikus napi/heti reset.
- Minden szint külön stílusban konfigurálható.
- Nem mashup; egységes rendszer.
Összegzés
Professzionális, pontos eszköz a piaci szerkezet feltérképezésére, amely egyesíti a heti, napi és intraday szinteket, teljes időzóna-automatizálással és gyertyapontra horgonyzott kijelölésekkel.

True Trend (StevenCharts)Overview
True Trend (StevenCharts) is a next-generation technical analysis tool designed to automate the most subjective part of trading: Drawing Trendlines.
Whether you are scalping, day trading, or swing trading, identifying valid support and resistance channels is critical. This indicator uses a proprietary multi-timeframe momentum engine to objectively identify market pivots and automatically draw precise, high-probability trendlines (rays) on your chart.
The "True Trend" Engine
At the heart of this indicator is a custom algorithmic model that evaluates market structure across multiple timeframes simultaneously.
No Guesswork: Instead of manually connecting wicks, the script waits for specific algorithmic momentum peaks and troughs to determine exactly where a trend begins and ends.
Dynamic Generation: When the internal trend logic detects maximum strength, the indicator tracks the highest or lowest points of the move. When momentum shifts, it locks in a trendline that projects forward, creating dynamic support and resistance levels.
Key Features
Automated Ray Creation: Automatically draws Red (Bearish) and Green (Bullish) rays based on confirmed momentum shifts.
Clean Chart Logic: The script includes intelligent "cleanup" logic. If price breaks a trendline and confirms the break with sustained momentum, the line is automatically removed to keep your chart clean and focused on relevant data only.
High Volume Confirmation: The logic accounts for volume spikes to validate line breaks.
"SHIFT" Logic (Adaptive vs. Static)
This script features a powerful setting called "Turn SHIFT On":
ON (Adaptive Mode): Uses advanced logic to "leapfrog" trendlines. As price makes new structural highs or lows, the trendline adjusts and locks onto the most recent valid pivot points. This is ideal for active traders following a developing trend.
OFF (Static Mode): Draws independent, static trendlines from every valid pivot. This is useful for seeing the history of market structure and identifying older levels that may still act as support/resistance.
How to Use
Support & Resistance: Use the automatically generated rays as dynamic S/R levels.
Bullish Trend: Price should respect the Green rays as support.
Bearish Trend: Price should respect the Red rays as resistance.
Breakout/Reversal: When a localized trendline is deleted or broken, it signals a potential shift in market structure.
Settings
Turn 'SHIFT' On: Toggles between adaptive (moving) lines and static lines.
Show Highest/Lowest Only: Keeps the chart clean by focusing on the most dominant outer trends.
Ray Colors: Customizable colors for Up and Down trends.

Rob's Session Highs and LowsThis indicator plots key intraday structure levels for index and futures traders who track the Asia, London, and New York sessions, plus overnight H1 and H4 levels, without breaking the chart autoscale.
It automatically tracks and draws:
Asia session high and low
London session high and low
Previous New York session high and low (PDH and PDL)
Overnight session H1 and H4 highs and lows
All sessions are interpreted in New York time, and the Asia, London, New York, and Overnight windows are fully configurable so you can match your own session definitions.
Features:
Separate color, style, and width controls for Asia, London, Previous Day, H1, and H4 levels
Optional labels on the chart, with the choice to pin them to the right edge or offset them into the past
Clean vertical session dividers that stay within the current daily range so they do not crush the autoscale
Price scale markers (AH, AL, LH, LL, PDH, PDL, H1H, H1L, H4H, H4L) for quick reference even when levels are off screen
Optional alert conditions for when price crosses any session high or low, as well as Overnight H1 and H4 levels
Use it on your intraday charts to quickly see which session ranges have been taken out, where the prior New York range sits, and which overnight H1 or H4 levels are in play.

Trendline365 Delta V2025 (Fixa)The Trendline365 Delta is an advanced structural-reading indicator that combines multiple layers of fixed moving averages, organized by color, to reveal the real dynamics of the trend across different time horizons. It does not attempt to predict the market — instead, it accurately describes how the trend is behaving right now, allowing traders to identify acceleration, weakness, transitions, and decision points that usually go unnoticed.
The indicator is divided into color-coded bands:
Red Series → Represents ultra-short-term momentum. It serves as an immediate thermometer of strength or weakness, ideal for validating early moves and shallow pullbacks.
Yellow Series → Captures the intermediate trend. This zone acts as a powerful filter to avoid rushed entries and highlights deeper corrections within a larger trend.
Green Series → Shows the macro structure of the trend. When price consistently stays above or below this band, a clear primary direction is established.
Blue Series → The classic institutional axis, the most widely used global reference to evaluate bull markets and bear markets.
Long Blue Series → Represents the extreme long-term trend. A “gravitational floor” that only shifts when entire market cycles reverse.
In addition to the moving averages, the indicator includes a 20-period Volume Moving Average, allowing the trader to evaluate the strength behind price movements. The combination of structure (moving averages) and energy (volume) provides a clear reading of continuation, exhaustion, true breakouts, and fake breakouts.
How to use it in practice
Strong trend: price above the red/yellow bands, upward alignment, and sustained volume.
Transition: when price begins crossing from one colored band to another, especially if volume divergence is present.
Healthy corrections: low-volume pullbacks into the red/yellow zones.
Cycle change: breakouts of the green band or the 200-period level with increasing volume.
The Trendline365 Delta simplifies trend analysis and transforms the chart into an intuitive visual map, ideal for swing traders, position traders, and content creators who want to explain the market with clarity and authority.
