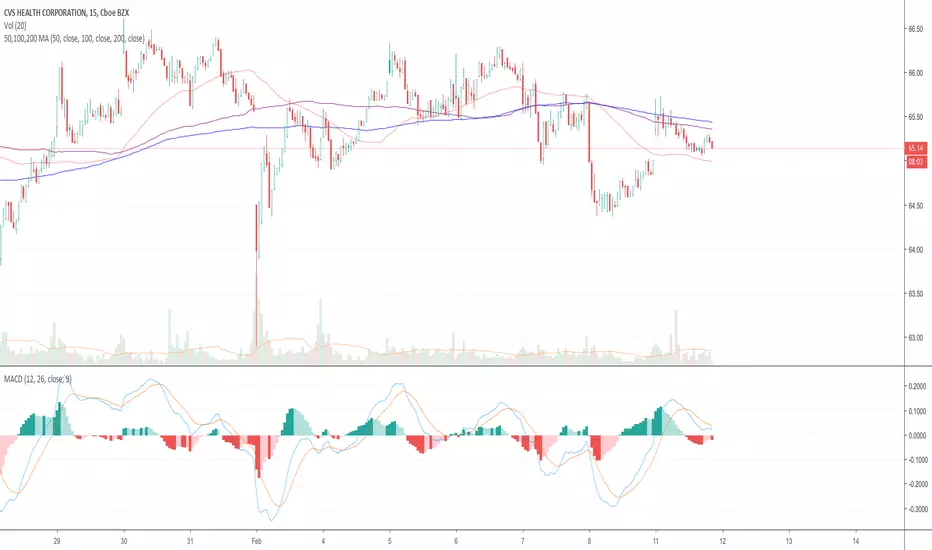
Basit Hareketli Ortalama (SMA)

Triple Moving Averages & BBTriple SMAs (default 50 100 200) that turn green when trending up and red when trending down.
Includes standard bollinger bands which can be turned off.
Combines these 4 indicators into just 1.

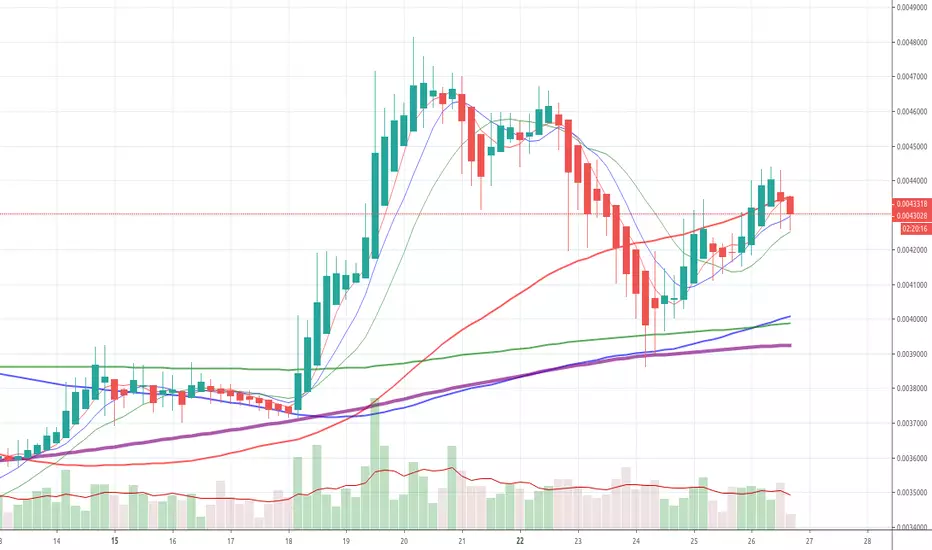
Multi SMA EMA WMA HMA BB (4x5 MAs Bollinger Bands) Adv MTF - RRBMulti SMA EMA WMA HMA 4x5 Moving Averages with Bollinger Bands Advanced MTF by RagingRocketBull 2019
Version 1.0
This indicator shows multiple MAs of any type SMA EMA WMA HMA etc with BB and MTF support, can show MAs as dynamically moving levels.
There are 4 MA groups + 1 BB group, a total of 4 TFs * 5 MAs = 20 MAs. You can assign any type/timeframe combo to a group, for example:
- EMAs 12,26,50,100,200 x H1, H4, D1, W1 (4 TFs x 5 MAs x 1 type)
- EMAs 8,10,13,21,30,50,55,100,200,400 x M15, H1 (2 TFs x 10 MAs x 1 type)
- D1 EMAs and SMAs 8,10,12,26,30,50,55,100,200,400 (1 TF x 10 MAs x 2 types)
- H1 WMAs 7,77,89,167,231; H4 HMAs 12,26,50,100,200; D1 EMAs 89,144,169,233,377; W1 SMAs 12,26,50,100,200 (4 TFs x 5 MAs x 4 types)
- +1 extra MA type/timeframe for BB
There are several versions: Simple, MTF, Pro MTF, Advanced MTF and Ultimate MTF. This is the Advanced MTF version. The Differences are listed below. All versions have BB
- Simple: you have 2 groups of MAs that can be assigned any type (5+5)
- MTF: +2 custom Timeframes for each group (2x5 MTF) +1 TF for BB, TF XY smoothing
- Pro MTF: 4 custom Timeframes for each group (4x3 MTF), 1 TF for BB, MA levels and show max bars back options
- Advanced MTF: +2 extra MAs/group (4x5 MTF), custom Ticker/Symbols, Timeframe <>= filter, Remove Duplicates Option
- Ultimate MTF: +individual settings for each MA, custom Ticker/Symbols
Features:
- 4x5 = 20 MAs of any type
- 4x MTF groups with XY step line smoothing
- +1 extra TF/type for BB MAs
- 4x5 = 20 MA levels with adjustable group offsets, indents and shift
- supports any existing type of MA: SMA, EMA, WMA, Hull Moving Average (HMA)
- custom tickers/symbols for each group - you can compare MAs of the same symbol across exchanges
- show max bars back option
- show/hide both groups of MAs/levels/BB and individual MAs
- timeframe filter: show only MAs/Levels with TFs <>= Current TF
- hide MAs/Levels with duplicate TFs
- support for custom TFs that are not available in free accounts: 2D, 3D etc
- support for timeframes in H: H, 2H, 4H etc
Notes:
- Uses timeframe textbox instead of input resolution dropdown to allow for 240 120 and other custom TFs
- Uses symbol textbox instead of input symbol to avoid establishing multiple dummy security connections to the current ticker - otherwise empty symbols will prevent script from running
- Possible reasons for missing MAs on a chart:
- there may not be enough bars in history to start plotting it. For example, W1 EMA200 needs at least 200 bars on a weekly chart.
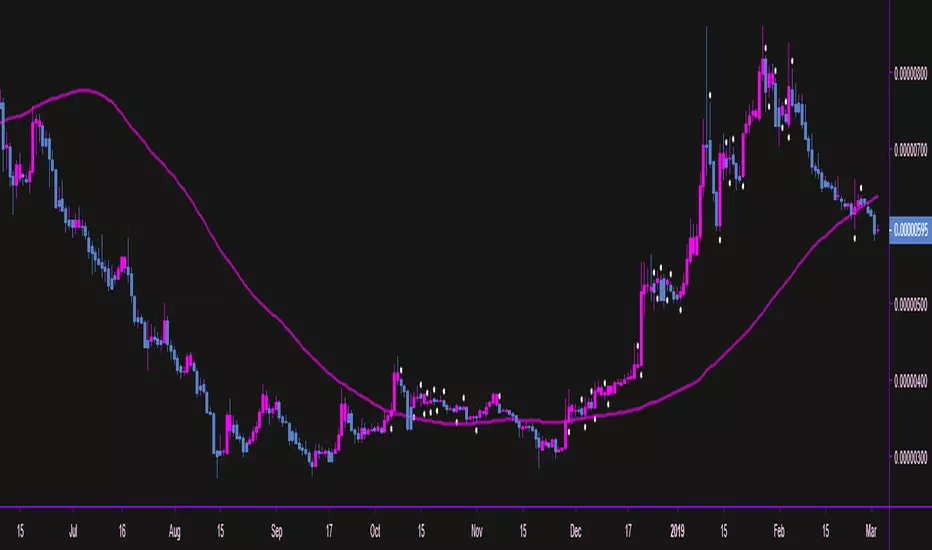
- price << default Y smoothing step 5. For charts with low/fractional prices (i.e. 0.00002 << 5) adjust X Y smoothing as needed (set Y = 0.0000001) or disable it completely (set X,Y to 0,0)
- TradingView Replay Mode UI and Pinescript security calls are limited to TFs >= D (D,2D,W,MN...) for free accounts
- attempting to plot any TF < D1 in Replay Mode will only result in straight lines, but all TFs will work properly in history and real-time modes. This is not a bug.
- Max Bars Back (num_bars) is limited to 5000 for free accounts (10000 for paid), will show error when exceeded. To plot on all available history set to 0 (default)
- Slow load/redraw times. This indicator becomes slower, its UI less responsive when:
- Pinescript Node.js graphics library is too slow and inefficient at plotting bars/objects in a browser window. Code optimization doesn't help much - the graphics engine is the main reason for general slowness.
- the chart has a long history (10000+ bars) in a browser's cache (you have scrolled back a couple of screens in a max zoom mode).
- Reload the page/Load a fresh chart and then apply the indicator or
- Switch to another Timeframe (old TF history will still remain in cache and that TF will be slow)
- in max possible zoom mode around 4500 bars can fit on 1 screen - this also slows down responsiveness. Reset Zoom level
- initial load and redraw times after a param change in UI also depend on TF. For example:
D1/W1 - 2 sec, H1/H4 - 5-6 sec, M30 - 10 sec, M15/M5 - 4 sec, M1 - 5 sec.
M30 usually has the longest history (up to 16000 bars) and W1 - the shortest (1000 bars).
- when indicator uses more MAs (plots) and timeframes it will redraw slower. Seems that up to 5 Timeframes is acceptable, but 6+ Timeframes can become very slow.
- show_last=last_bars plot limit doesn't affect load/redraw times, so it was removed from MA plot
- Max Bars Back (num_bars) default/custom set UI value doesn't seem to affect load/redraw times
- In max zoom mode all dynamic levels disappear (they behave like text)
1. based on 3EmaBB, uses plot*, barssince and security functions
2. you can't set certain constants from input due to Pinescript limitations - change the code as needed, recompile and use as a private version
3. Levels = trackprice implementation
4. Show Max Bars Back = show_last implementation
5. swma has a fixed length = 4, alma and linreg have additional offset and smoothing params
6. Smoothing is applied by default for visual aesthetics on MTF. To use exact ma mtf values (lines with stair stepping) - disable it
Good Luck! You can explore, modify/reuse the code to build your own indicators.

Up Down Alerts with MA Control - v2.0this update is meant for use with regular candles, but it will mimic the color pattern of heikin ashi candles and allow alerts based on the heikin ashi patterns. Also there are alerts for when the price is above a set moving average.
was going to just update the original script but there are a lot of changes to make it smoother etc, original script:
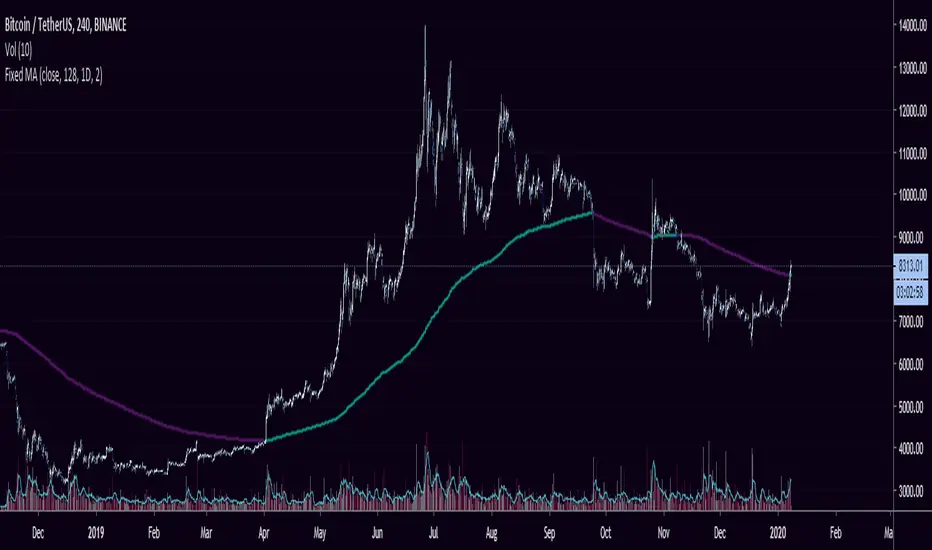
Fixed Moving AverageThis Indicator is a fixed moving average indicator.
By "fixed" I mean that you can choose for the MA to be based on the current resolution or fixed on a specific time-frame.
Default will be 128 D MA. It is fully customize able Moving Average.
It is a simple script. I created it because I wanted to be able to see the 128 D MA on any time-frame.
It can be used to determine your bias while trading:
- If the price is above the 128 day moving average, look for longs
- If the price is below the 128 day moving average, look for shorts
Bestest MA. Compare 2 x 7 MA's at different resolutionAdjust time, length, visibility, colour.
SMA and EMA can use different time resolution.
This is version 1 aka work in progress.


SMA 20, 50, 200This Script provides the 50 and 200 day moving average to provide a way to keep track of the classic Death Cross and Golden Cross. The 20 day moving average is just used as an early prediction of what the 50 day may do so you can keep and eye on it. If you are the kind of person that freaks out at sudden changes in the graphs it is probably best to just turn the 20 day off.
A Golden Cross is when the 50 day MA raises above the 200 day MA. This indicates the start of a Bull Market. This is the best time to buy as the market commonly will increase over the next few months or even years.
A Death Cross is when the 50 day MA drops below the 200 day MA. This indicates the start of a Bear Market. This is the best time to sell as the market will commonly decrease at least 20 percent or more over the next couple months or more.
I am not a financial advisor and this is just a tool to help you make your own decisions with your investments. My information is just based on common knowledge.


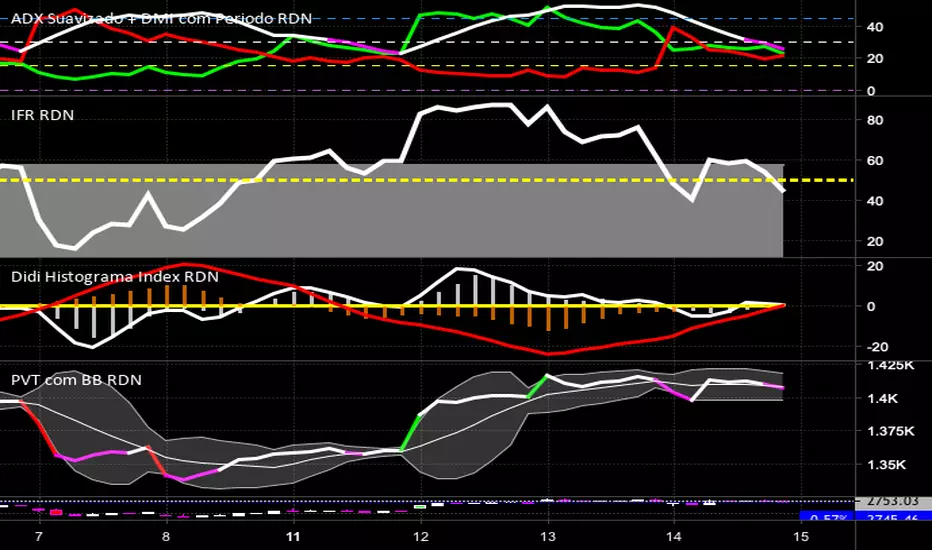
Didi Histograma Index RDN
Adicione rafdourado para maiores informações de uso ou dicas para aprimoramento
Add rafdourado for more usage information or tips for improvement

Multiple Simple Moving AveragesOne no-fuss indicator for SMA for 6 different time period (10, 20, 50, 100, 200, 250), styled with sharp and thin line for shorter time period to light-coloured and wide line for longer time period.

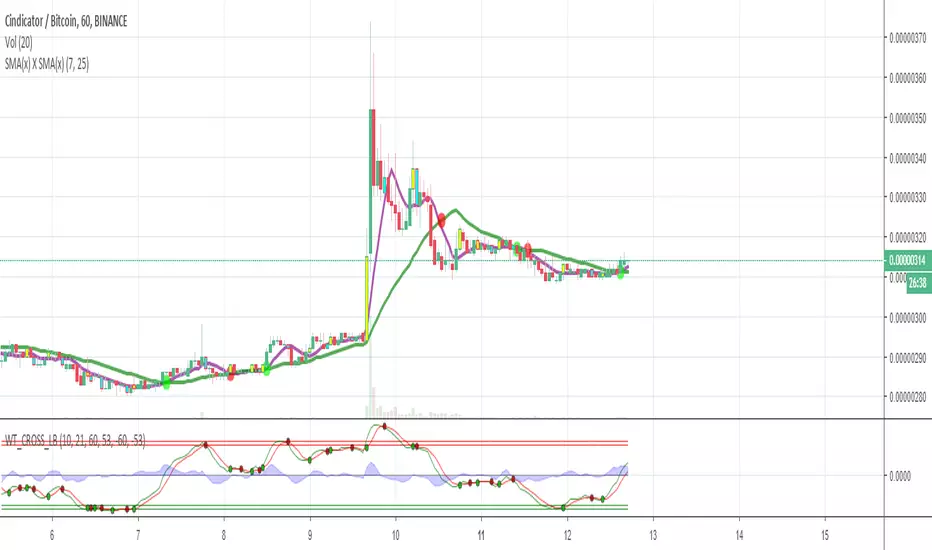
SMA Cross (Short X Long)Its a graph for detecting the SMA cross points.
When short SMA crosses the long SMA downside up it may be a buy signal and the opposite is may be a sell signal.
50,100,200 MA50, 100, and 200 simple moving averages in a single indicator. Fixed versions published by other members where 100 and 200 were plotted incorrectly and overlaying each other. Also removed close plot.
VWMA - SMAVWMA - SMA is very strong indication of trend direction and strength
See here for a description of this trading strategy: www.tradingsetupsreview.com
Multi SMAPlot all of the most important SMA values.
SMA 5, 8, 13 are based on Fibonaci values and frequently used in day trading frequently.
SMA 50, 100, 200 are important support/resistance lines.
Especially, SMA 50, 100, 200 are the most important support/resistance on BTC 1W. Dont forget to look at the weekly prices when trading :)

EMA SMA MultiCombo 2.0This script gives you up to 5 EMAs and 5 SMAs with custom length, close and color parameters.
Also, you can set up to 3 SMA with fixed, static timeframe input nondependent of the chart timeframe.
So, for example, you can set your chart to 5 min timeframe and see where 1D, 30D, 200W MA is.
Enjoy!

EMA SMA MultiCombo 2.0This script gives you up to 5 EMAs and 5 SMAs with custom length, close and color parameters.
Also, you can set up to 3 SMA with fixed, static timeframe input nondependent of the chart timeframe.
So, for example, you can set your chart to 5 min timeframe and see where 1D, 30D, 200W MA is.
EMA SMA MultiComboJust a simple combo of 5 EMAs and 5 SMAs.
Custom lenght, custom color and custom source.

ProfitTrailer Example TradingView Signals [v2019-01-31]ProfitTrailer Example TradingView Signal
This script provides an example of a TradingView Signal for use with ProfitTrailer's
new SIGNALS functionality and it's new TradingView integration capability.
This signals script implements a simple Moving Average Cross strategy
that works on any chart timeframe.
It allows you to pick the Price source i.e. Open, Close (default), etc.
You are able to choose between EMA (default) or SMA moving average
calculations.
You can define the fast and slow period lengths for use within the
moving average calculations.
If you get some value out of this indicator please consider making
a small donation to my favourite charity the Save the Childrens Fund.
Every donation will make a difference to the lives of children.
All donations over $2 are tax deductable. You can donate here:
savethechildrenfundraising.org.au
Copyright (c) 2019, Grant Cause aka CryptoCoyns

Multiple EMA/SMACreate and customize up to 6 EMAs and 6 SMAs. Useful for both long-term and short-term trading. Comes configured with the moving averages I use for trading.
