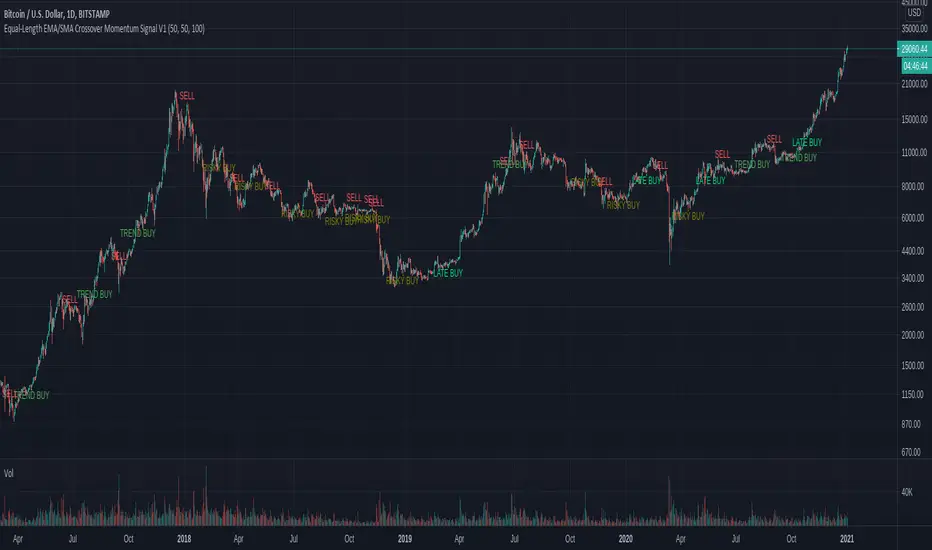
Equal-Length EMA/SMA Crossover Momentum Signal V1Overview:
This momentum and trend-following strategy captures the majority of any trending move, and works well on high timeframes.
It uses an equal-period EMA and SMA crossover to detect trend acceleration/deceleration, since an EMA places a greater weight and significance on the most recent data.
This version is optimized for longs, and designed to cut your losses quickly and let your winners run.
To reduce noise and optimize entries, we combined this with an overall trend bias for further confluence.
How it works:
Signals are determined by the crossover of an EMA and SMA of the same length, e.g. EMA-50 and SMA-50.
The overall trend bias is determined using a slower SMA golden/death cross, e.g. SMA-50 and SMA-100.
The signal is stronger when it occurs in confluence with the overall trend bias, e.g. when EMA-50 crosses over SMA-50, while above the SMA-100. This is analogous to only opening long positions in a bull market.
Signal description:
Trend Buy: EMA crosses above SMA, and overall trend bias is bullish. Buying is in confluence with the overall trend bias.
Risky Buy: EMA crosses above SMA, and overall trend bias is bearish. Buying is early, more risky, and not in confluence with the overall trend bias.
Late Buy: SMA crosses above BIAS_SLOW. This gives further confirmation of bullish trend, but signal comes later.
Sell: EMA crosses under SMA.
Basit Hareketli Ortalama (SMA)
200 Week Moving Average HeatmapСolors part of the SMA depending on the change in % (delta %) to the previous value. From blue(none to low increase) through green(moderate increase) to red(high increase).

Custom Moving Average (EMA & SMA)This script is a custom visualization tool to plot 4 Moving Averages (MA).
Each MA is customizable; you can:
enable (disable) the plot of MA;
select whether the MA is an EMA or an SMA;
the length;
the source (open, close, ...);
the offset value (default is 0).
Note:
The 1st MA is an EMA with length 50.
The others MAs are SMA with length 9, 30 and 100 respectively.

On Chart Anticipated Moving Average Crossover IndicatorIntroducing the on chart moving average crossover indicator.
This is my On Chart Pinescript implementation of the Anticipated Simple Moving Average Crossover idea.
This indicator plots 6 user defined moving averages.
It also plots the 5 price levels required on the next close to cross a user selected moving average with the 5 other user defined moving averages
It also gives signals of anticipated moving average crosses as arrows on chart and also as tradingview alerts with a very high degree of accuracy
Much respect to the creator of the original idea Mr. Dimitris Tsokakis
Moving Averages
A moving average simplifies price data by smoothing it out by averaging closing prices and creating one flowing line which makes seeing the trend easier.
Moving averages can work well in strong trending conditions, but poorly in choppy or ranging conditions.
Adjusting the time frame can remedy this problem temporarily, although at some point, these issues are likely to occur regardless of the time frame chosen for the moving average(s).
While Exponential moving averages react quicker to price changes than simple moving averages. In some cases, this may be good, and in others, it may cause false signals.
Moving averages with a shorter look back period (20 days, for example) will also respond quicker to price changes than an average with a longer look back period (200 days).
Trading Strategies — Moving Average Crossovers
Moving average crossovers are a popular strategy for both entries and exits. MAs can also highlight areas of potential support or resistance.
The first type is a price crossover, which is when the price crosses above or below a moving average to signal a potential change in trend.
Another strategy is to apply two moving averages to a chart: one longer and one shorter.
When the shorter-term MA crosses above the longer-term MA, it's a buy signal, as it indicates that the trend is shifting up. This is known as a "golden cross."
Meanwhile, when the shorter-term MA crosses below the longer-term MA, it's a sell signal, as it indicates that the trend is shifting down. This is known as a "dead/death cross."
MA and MA Cross Strategy Disadvantages
Moving averages are calculated based on historical data, and while this may appear predictive nothing about the calculation is predictive in nature.
Moving averages are always based on historical data and simply show the average price over a certain time period.
Therefore, results using moving averages can be quite random.
At times, the market seems to respect MA support/resistance and trade signals, and at other times, it shows these indicators no respect.
One major problem is that, if the price action becomes choppy, the price may swing back and forth, generating multiple trend reversal or trade signals.
When this occurs, it's best to step aside or utilize another indicator to help clarify the trend.
The same thing can occur with MA crossovers when the MAs get "tangled up" for a period of time during periods of consolidation, triggering multiple losing trades.
Ensure you use a robust risk management system to avoid getting "Chopped Up" or "Whip Sawed" during these periods.

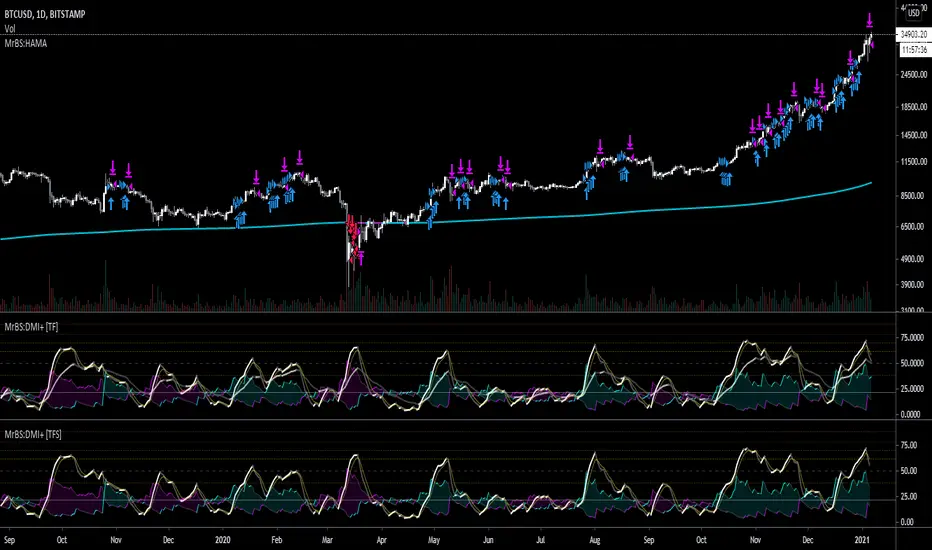
MrBS:EMA/SMA/HMA (Heikin Ashi Calc)This indicator allows you to base the MA calculation from Heikin Ashi values on normal charts and/or the real OHLC values while looking at Heikin Ashi.
There are 3 MA types you can select - EMA / SMA / HMA
The colour is based on the slope.
I made this to help me visualize my DMI+ strategy, when I was looking at taking signals from Heikin Ashi but looking at candlesticks. Turns out, I was going down the wrong road. Now I'm looking into using the real OHLC values for generating signals but watching the Heikin Ashi chart as I find it easier to see trends on it.
Hopefully its useful to some people, and if you have any suggestions for improvements I'd love to know.
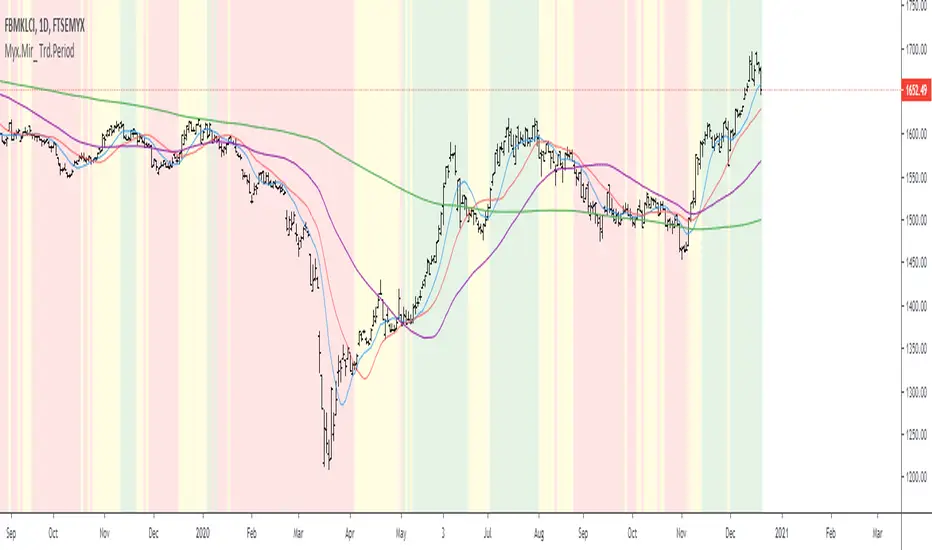
Myx.Mir_ Trd.Period c/w Background ColorMyx.Mir_ Trd.Period c/w Background Color
FBMKLCI is a main Indices/ references
Basis = Based on Simple Moving Average
Note:-
BG= Background Color
Based on personal study:-
BG is Green = Current index > MA 20 > MA 50 = Sign of Bullish // majority portfolio should be in green & make profit... Hehehe
BG is Yellow = MA50 < Current Index < MA 20 = No solid direction and/or sideways // ----------------------------------------------------... should plan to hold or exit
BG is Red = Current Index < MA 50 = Sign of Bearish // majority of portfolio should be in red... Hehehe. Should be run Fast Fast.....
can do your own Trade Record Based on 3 phases
a) When the strategy/ Technique are perform better @ more gain and Don't chase the price ... "nanti asal Kejar Pucuks Je price terus Droppp..." Hehe.
b) When the strategy / Technique not perform well...
Examples of Rolling Average Using Automated AnchoringIn this study, I present a method to expose NaN values to development environment.
This exposure allows NaN values to be used by methods in scripts.
I also show how to use values, even NaN values, as anchors from which statistics can be computed from.
I demonstrate how to do this with constants and variables in methods for computing the cumulative/rolling average of a series.
I also show how to calculate the cumulative/rolling average from the start of a ticker series using the aforementioned methods.
Each method has a description on how some of their parts work as well as their constraints.
Method #1 - Can only be used for computing the rolling average on the ticker series.
Method #2 - The simple moving average from the Pine Script reference.
- Can be used to calculate the rolling average of the ticker series and number values of a series.
- This method seems to cause an error when there are many bars in the series.
Method #3 - The most versatile method due to the use of computing the rolling average using an array.
- Timeout will occur when computing the rolling average of an entire ticker series which is long.
- Timeout has not occurred when computing a rolling average of a series from NaN or non-NaN anchor points even when the series is long.
This is an attempt to get around the constraints of the built-in sma(source, length) function in which length cannot be dynamically adjusted.
Other Pine Script functions have that constraint which we can get around by defining our own functions.

[MACLEN] HODL ZONE RENKO
PLEASE READ!
Trade at your own risk. Please read about renko charts before using this indicator. This indicator is for educational purposes only.
This Indicator is only valid in renko charts with 1 second timeframe. For BTCUSDT . With the traditional method and the size box of 80.
With this indicator we can detect zones of buy and sell. Even that is not recommended to use leverage, I use it to find an entry and use only small leverages. It could be also used to accumulate and HODL bitcoin .
Please, comment anything.
POR FAVOR LEER!
Tradea bajo tu propio riesgo. Por favor lee sobre las graficas renko antes de usar este indicador. Este indicador es solamente con fines educativos.
Este indicador es válido solamente en graficas renko con un timeframe de 1 segundo. Para BTCUSDT . Con cajas del método tradicional de un tamaño de 80.
Con este indicador podemos detectar zonas de compra y venta. A pesar de que no es recomendable usar apalancamiento, yo lo uso para encontrar entradas y solo uso apalancamientos pequeños. También podría usarse para acumular y holdear bitcoin .
Por favor, escríbeme cualquier duda o comentario.

Multi Time Frame Moving Averages [Anan]Hello friends,
All your popular moving average now in one indicator, also no need to open a lot of tabs to see where is that moving average at that time frame,
with multi time frame feature, now u can see up to six multi time frame MA in the same chart with option to show/hide it
list of moving averages:
SMA
Smooth SMA
SuperSmooth MA
EMA
DEMA
TEMA
Triangular MA
QEMA
RMA
Hull MA
KAMA
WMA
VWMA
VWAP
CTI
LSMA
VIDYA
Blackman Filter
Adaptive RSI
also there is an option to see the Average of four lengths, i backtest this and found it super great !

MAST TrendHello Traders !!
This is a simple super trend based MAST trend.
By default the supertrend is 10 period with 3 ATR multiplier.
A moving average is used to benefit from the pullback entries.
Bullish Pullback : Price above Supertrend & below MA
Bullish: Price above Supertrend and above MA
Bearish pullback : Price below Supertrend & above MA
Bearish : Price below Supertrend & below MA
Refer to investopedia or any relevant articles for in detail about Supertrend.

Colored MA with crossovers The indicator is used to identify trends in different MA and mark crossovers/crossunders with triangles on chart. Each MA line has different linewidth to easier identify it's value. Lines are transparent not draw to much attention, crossovers marked to draw attention to pivotal moments.
Choose SMA or EMA type.
Enable/disable crossover/crossunder.
Each MA line is adjustable in the input tab.
Each MA line has different linewidth to easier identify it's value (higher value bigger linewidth).
Each MA line changes color depending on it's gradient, green if positive, red if negative, gray if flat.
Edit which crossovers/crossunders to be visible in the style tab . In the same tab colors is adjustable.

Candle Height in Percentage - ColumnsThis indicator calculates the difference in percentage between lows and highs of a candle. The orange bars show the height of the candle body (open/close) and the red/green on top show the percentage of the wicks (high/low). This assists in understanding the volatility of an asset. Showing this in percentages is more helpful in crypto. It also shows the Simple Moving Average of this data with the blue line.
SMA + Trend Strength + Trailing Stop LossThe 'SMA + Trend Strength + Trailing Stop Loss' indicator was designed for swing trading long positions over the course of days/weeks. The benefit of the indicator is to identify areas where the market of a given asset is showing signs of a strong uptrend, divergences, and fear. A 13-bar simple moving average is color coded to four colors based on 5 given conditions at a time, which are represented as a trend meter on the bottom right of the screen. A trailing stop loss indicator is included to secure your profits or limit your loss in case the market reverses on you unexpected. Please use this indicator responsibly with proper risk management, and never rely on the indicator by itself for buy and sell signals.
When the simple moving average color is green, it means that at least 4 of 5 conditions are confirming a move upwards, this is when you can take an entry into a trade based on your entry strategy. As the trend continues, the color will eventually change to yellow signaling a divergence. This is when you can use your exit strategy to find a good point to sell. It is wise not to take new positions when the color is trending yellow.
If the color changes from yellow to orange, that is a warning sign that the trend is about to change or has begun to change. Prices may have already fallen. However, sometimes the color will change from yellow back to green signaling a continuation of the trend. You can either keep holding or take a new position in this instance.
When the color is red, this signals fear in the market, you should stay out of the market at first. However, as the market consolidates and the color starts changing back to orange, this is an opportunity to take a long position at a reasonably low price.
Simple Moving Average (13-Bar) Color Explanation:
The colors change based on 5 market conditions represented in the trend meter.
Green: Strong Uptrend
Yellow: Divergence Present
Orange: Warning
Red: Fear
Trend Meter Explanation:
The trend meter draws 5 arrows indicating bullish or bearish presence.
LL = Lower Lows - Detects when the market is trending with lower lows.
HH = Higher Highs - Detects when the market is trending with higher highs.
MA = SMA Direction - A formula is used to determine the direction of the SMA.
DI = Directional Index - Identifies when upwards momentum is trending.
RSI = Relative Strength Index - Identifies when the RSI is in an uptrend state.
Note: For advanced users, this indicator has a hidden DMI(4, 4, 4) and RSI(14) indicator used to determine the last two conditions. The Directional Index is based on a DI Plus momentum moving average to determine a momentum trend and the RSI trending over 50 will constitute an uptrend signal as below 50 it will point down.
Trailing stop loss:
The trailing stop loss is determined based on the lowest price of the last 8 bars.
A gray step-line is drawn at the suggested stop activation price.
A red step-line is drawn at the suggested stop limit price.
When the price breaches the trailing stop, a red X will appear below the bar.
You can turn each of these features on or off based on your preference. Happy trading!

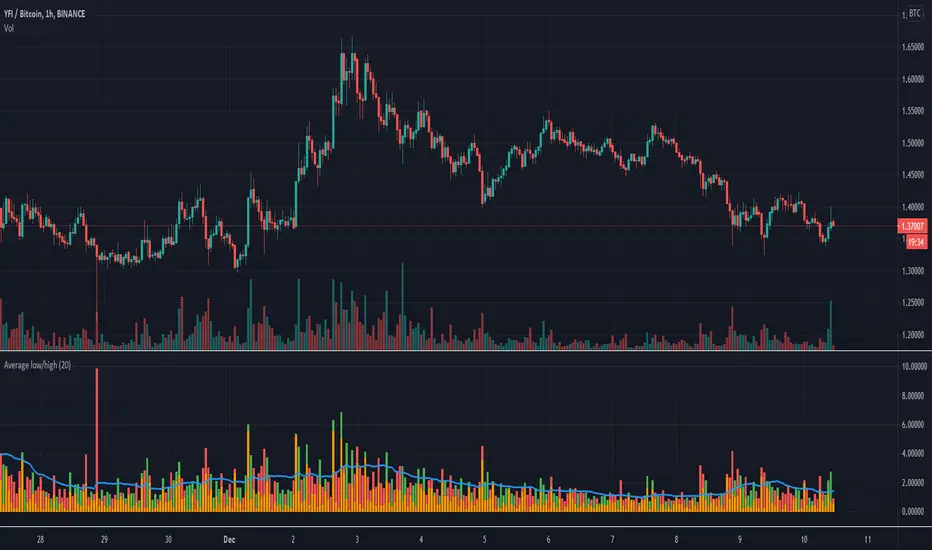
Average Low/High Percentage DifferenceThis indicator calculates the Simple Moving Average of the difference in percentage between lows and highs of a candle. This assists in understanding the volatility of an asset. Showing this in percentages is more helpful in crypto.

ADR% - Average Daily Range % by MikeC (AKA TheScrutiniser)This applies a 'corrected' formula to the version created by alpine_trader (which is slightly off). It calculates the Average Daily Range (in percent) over the previous 20 periods and plots it in a chart.
I am grateful to GlinckEastwoot for the 'corrected' formula.

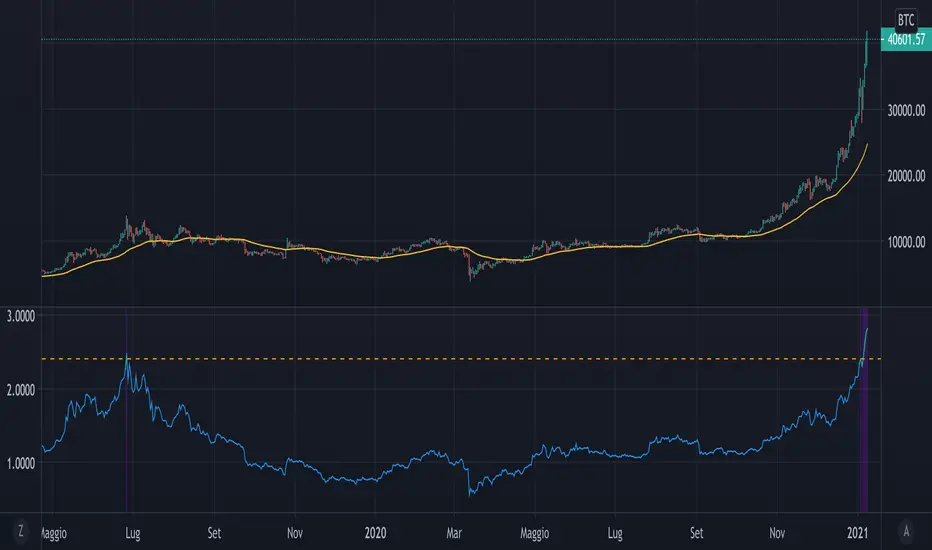
Mayer MultipleThe script implements a custom version of the Mayer multiple and it may be useful for analyzing the price of Bitcoin in a historical context.
Note n.1: Mayer multiple does not tell whether to buy, sell or hold, but highlights the best long-term area when the bitcoin price is below a threshold value (2.4).
Note n.2: the threshold value (2.4) has been determined in the past by simulations performed.
The script user may decide whether to use the shown graph or another graph for the calculation of the Mayer multiple.
The script is very easy to use and it is possible to change the following parameters:
the period of SMA (default value is 200)
the threshold (default value 2.4)
Show or not the sell area
Use or not the shown graph to calculate the Mayer multiple (default value is true)
name of exchange to use for calculation of the Mayer multiple (default value is BNC)
name of chart to use for calculation of the Mayer multiple (default value is BLX)
Anticipated Simple Moving Average Crossover IndicatorIntroducing the Anticipated Simple Moving Average Crossover Indicator
This is my Pinescript implementation of the Anticipated Simple Moving Average Crossover Indicator
Much respect to the original creator of this idea Dimitris Tsokakis
This indicator removes one bar of lag from simple moving average crossover signals with a high degree of accuracy to give a slight but very real edge.
Moving Averages
A moving average simplifies price data by smoothing it out by averaging closing prices and creating one flowing line which makes seeing the trend easier.
Moving averages can work well in strong trending conditions, but poorly in choppy or ranging conditions.
Adjusting the time frame can remedy this problem temporarily, although at some point, these issues are likely to occur regardless of the time frame chosen for the moving average(s).
While Exponential moving averages react quicker to price changes than simple moving averages. In some cases, this may be good, and in others, it may cause false signals.
Moving averages with a shorter look back period (20 days, for example) will also respond quicker to price changes than an average with a longer look back period (200 days).
Trading Strategies — Moving Average Crossovers
Moving average crossovers are a popular strategy for both entries and exits. MAs can also highlight areas of potential support or resistance.
The first type is a price crossover, which is when the price crosses above or below a moving average to signal a potential change in trend.
Another strategy is to apply two moving averages to a chart: one longer and one shorter.
When the shorter-term MA crosses above the longer-term MA, it's a buy signal, as it indicates that the trend is shifting up. This is known as a "golden cross."
Meanwhile, when the shorter-term MA crosses below the longer-term MA, it's a sell signal, as it indicates that the trend is shifting down. This is known as a "dead/death cross."
MA and MA Cross Strategy Disadvantages
Moving averages are calculated based on historical data, and while this may appear predictive nothing about the calculation is predictive in nature.
Moving averages are always based on historical data and simply show the average price over a certain time period.
Therefore, results using moving averages can be quite random.
At times, the market seems to respect MA support/resistance and trade signals, and at other times, it shows these indicators no respect.
One major problem is that, if the price action becomes choppy, the price may swing back and forth, generating multiple trend reversal or trade signals.
When this occurs, it's best to step aside or utilize another indicator to help clarify the trend.
The same thing can occur with MA crossovers when the MAs get "tangled up" for a period of time during periods of consolidation, triggering multiple losing trades.
Ensure you use a robust risk management system to avoid getting "Chopped Up" or "Whip Sawed" during these periods.
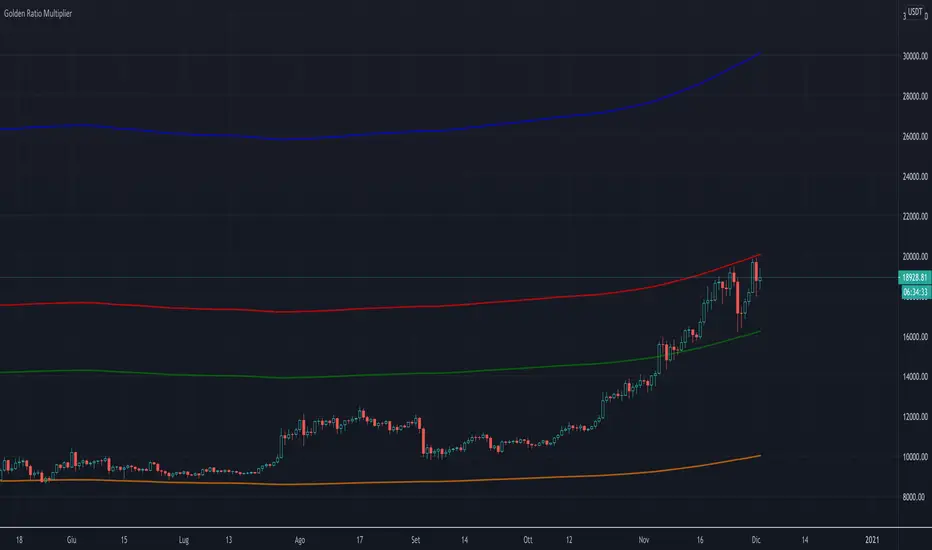
Golden Ratio Multiplier (x1.6; x2; x3)The script displays three multipliers (x1.618; x2; x3) of the Golden Ratio (starting with MA at 350 days) to identify the following levels of support:
the multiplier x1.618 is an accumulation high (green line)
the multiplier x2 is a support that identify a low bull high (red line)
the multiplier x3 is a support that identify an upper bull high (blu line)
Note: the orange line is the SMA at 350 days.
7EMA_5MA with Next Openbased on storwize's EMA/SMA script. Added a forecasting for the where the EMAs/SMAs will be in the next bar assuming a close where it currently is.

OnTheMoveWith this plot one is able to compare the different % change in the given time frame. It calculates the sma of a given period (defval = 7) for the close/open.
Strategy would be to choose (trade) from one to other asset in order to get higher rates when pumping or lower when dumping.
The Symbol & exchange has to be specified.
defSymbols = BTC, ETH and LINK
defExchange = BINANCE

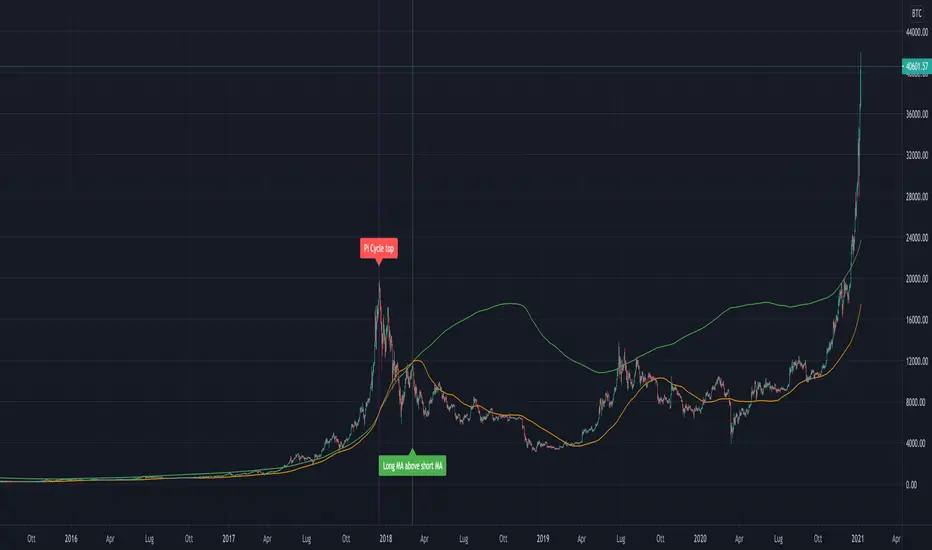
Pi Cycle Bitcoin Top IndicatorThe script implements the Pi Cycle Top indicator
This indicator identifies tops in the bitcoin market cycle. Historically, the Pi Cycle Top indicator has called out tops in the price of bitcoin within three days.
The script is very easy to use and it is possible to change the following parameters:
the time interval (default value is day);
the days of long moving average (default value is 365)
the days of short moving average (default value is 111)
show the moving average plots
show the Pi Cycle Top label highlighting the cross-point
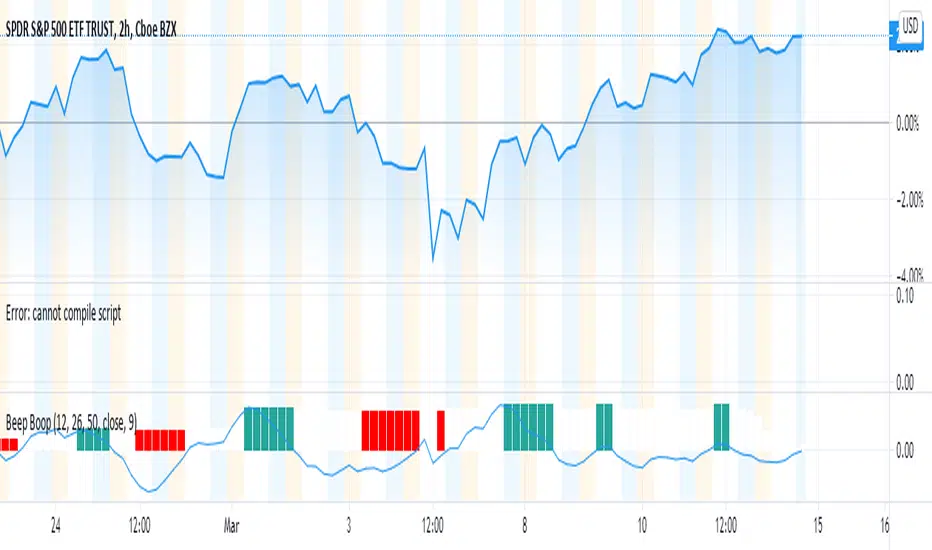
Beep Boop(Improved) Beep Boop Indicator for Trending Markets originally written by Trading Rush.
It is originally based on the MACD 12-26 and the 50 bar EMA.
The macd hist is color coded with green as buy and sell as red.
I added an option to use a couple of lower lag ema's (See line 13 - ema_signal).
Crypto EMA+MA+MACS by hobbeLeThis is an indicator that includes several EMAs and MAs (Used in Cryptotrading).
In addition, the Golden and Death Cross are also displayed.
Used MAs
MA 7 - Orange Line
MA 21 - Yellow Line
MA 25 - Grey Line
MA 99 - Blue Line
MA 200 - Green Line
Used EMAs
EMA 200 - Grey Dotted Line
EMA 222 - Pink Dotted Line
Golden Cross
Crossover MA25 + MA200
Death Cross
Crossunder MA25 + MA200
What is a Moving Average (MA) ?
A moving average (MA) is a widely used indicator in technical analysis that helps smooth out price action by filtering out the “noise” from random short-term price fluctuations.
Moving average is a trend-following, or lagging, indicator because it is based on past prices. The most common applications of moving averages are:
to identify the trend direction
to determine support and resistance levels
The two basic and commonly used moving averages are the simple moving average ( SMA ), which is the arithmetic average of a security over a defined number of time periods, and the exponential moving average ( EMA ), which gives greater weight to more recent prices.
What is a Golden Cross?
The golden cross is a candlestick pattern that is a bullish signal in which a relatively short-term moving average crosses above a long-term moving average. The golden cross is a bullish breakout pattern formed from a crossover involving a security's short-term moving average (such as the 15-day moving average) breaking above its long-term moving average (such as the 50-day moving average) or resistance level. As long-term indicators carry more weight, the golden cross indicates a bull market on the horizon and is reinforced by high trading volumes.
What Is a Death Cross?
The death cross is a technical chart pattern indicating the potential for a major selloff. The death cross appears on a chart when a stock’s short-term moving average crosses below its long-term moving average.
Source; Investopedia
