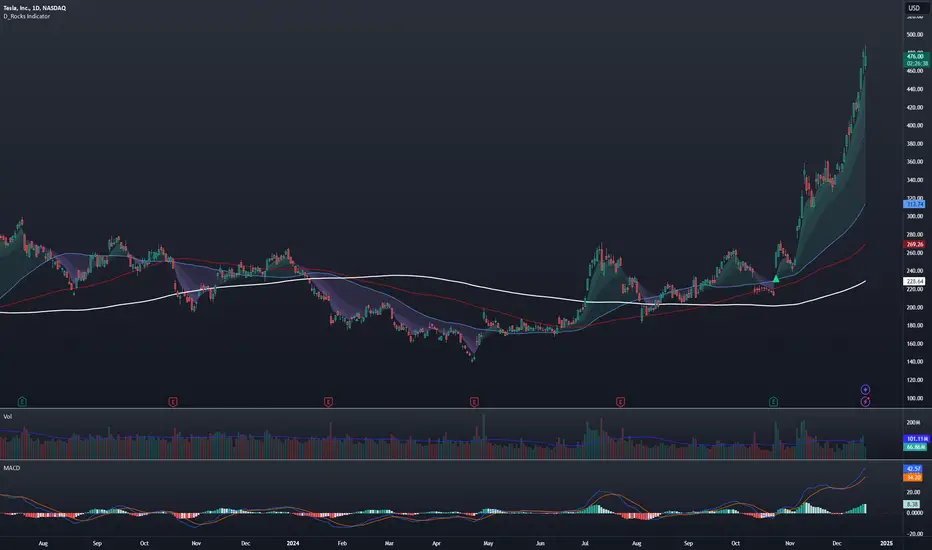
D_Rock's MA IndicatorD_Rock's Moving Average Indicator
This is an indicator version of my strategy linked here
**Overview:**
The basic concept of this indicator is to generate a signal when a faster/shorter length moving average crosses over (for Longs) or crosses under (for Shorts) a medium/longer length moving average. All of which are customizable. This indicator can work on any timeframe, however the daily is the timeframe used for the default settings and screenshots, as it was designed to be a multi-day swing strategy. Once a signal has been confirmed with a candle close, based on user options, the strategy is to enter the trade on the open of the next candle.
The crossover strategy is nothing new to trading, but what can make this strategy unique and helpful, is the addition of further confirmation points before a signal is generated along with the ability to show multiple moving averages on the chart if you choose. Each moving average pair can also be turned into a "cloud" instead of the traditional lines, for additional viewing preferences. Just about everything visual can be toggled on/off as well.
This indicator is a Trend (MA) indicator with optional confirmation points using a Momentum (MACD) indicator. While a Volume-based indicator is not shown here, one could consider using their favorite from that category to further compliment the signal idea.
If you would like to see the backtesting results for your favorite moving average crossover/under, please see my strategy version linked here .
Shoutout given to Ripster's Clouds Indicator as pieces of that code were taken and modified to create both the Cloud visualization effects, and the Moving Average Pair Plots that are implemented in this strategy.
MOVING AVERAGE OPTIONS
Select between and change the length & type of up to 5 pairs (10 total) of moving averages
The "Show Cloud-x" option will display a fill color between the "a" and "b" pairs
All moving averages lines can be toggled on/off in the "Style" tab, as well as adjusting their colors.
Visualization features do not affect calculations, meaning you could have all or nothing on the chart and the strategy will still produce results
SIGNAL CHOICES
Choose the fast/shorter length MA and the medium/longer length MA to determine the entry signal
CONFIRMATION OPTIONS
Both of these have customizable values and can be toggled on/off
A candle close over a slower/much longer length moving average
An additional cross-over (cross-under for Shorts) on the MACD indicator using default MACD values. While the MACD indicator is not necessary to have on the chart, it can help to add that for visualization. The calculations will perform whether the indicator is on the chart or not.
ADDITIONAL PLOTS
MACD (Moving Average Convergence/Divergence):
- The MACD is an optional confirmation indicator for this strategy.
- Plotting the indicator is not necessary for the strategy to work, but it can be helpful to visually see the status and position of the MACD if this feature is enabled in the strategy
- This helps to identify if there is also momentum behind the entry signal
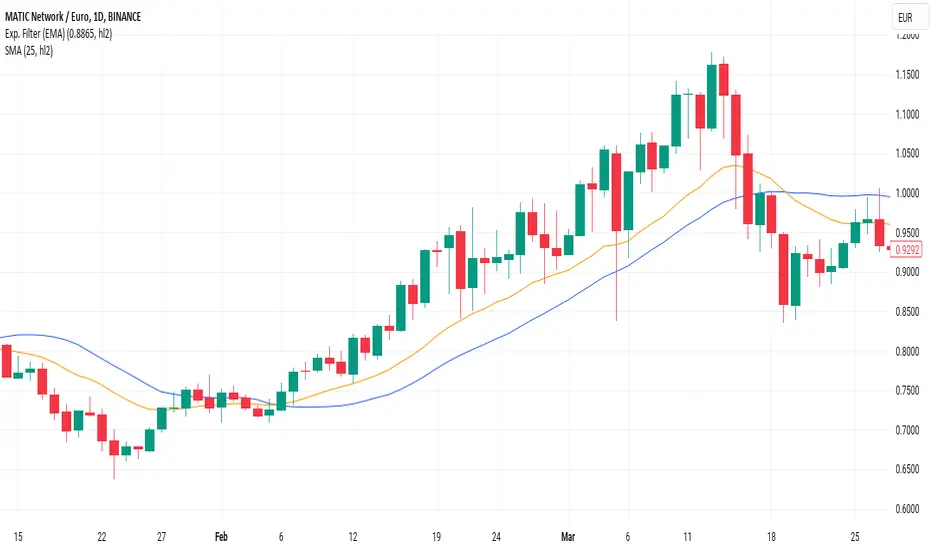
Basit Hareketli Ortalama (SMA)
Options Series - NonOverlay_Technical
⭐ 1. Purpose:
The script is designed to show technical indicators in a non-overlay form using candlestick representations. It combines multiple popular technical analysis tools to gauge the market's bullish or bearish conditions.
⭐ 2. Indicators:
The script uses several indicators across different timeframes: Exponential Moving Averages (EMA) for 5, 20, 50 periods. Simple Moving Average (SMA) for 200 periods. RSI (Relative Strength Index) for momentum. VWAP (Volume Weighted Average Price) for average price evaluation. PSAR (Parabolic SAR) for trend direction. Daily and multi-day (2-day and 3-day) data for broader market context.
⭐ 3. Candlestick Representation:
The script uses color-coded candlesticks to visually represent various indicators and their bullish/bearish states: Green candlesticks for bullish conditions. Red candlesticks for bearish conditions. Neutral/transparent for non-significant conditions.
⭐ 4. Important Conditions:
It calculates bullish and bearish conditions for each indicator: MA20: When the price is above or below the 20-period EMA. RSI: When RSI is above or below 50. VWAP: When the price is above or below the VWAP. PSAR: When the price is above or below the PSAR. 2-day and 3-day Moving Averages: Evaluating the broader trend.
⭐ 5. Bullish vs. Bearish Calculation:
The script sums up bullish and bearish signals to determine the overall market condition: Current_logical_bull: Counts the number of bullish indicators. Current_logical_bear: Counts the number of bearish indicators. The script compares these values to conclude whether the market is more bullish or bearish.
⭐ 6. Visual Plotting:
The script uses plotcandle to display the non-overlay signals at different levels for each condition, stacked vertically from MA20 to PSAR. Additionally, a master candle combines all indicators to show an overall market trend.
⭐ 7. Neon Effect on MA20:
It adds a neon-like effect to the MA20 line, making it visually prominent: A standard plot line with the base color. Two additional neon layers with increasing transparency to enhance the effect.
⭐ 8. Daily Timeframes and Lookahead:
The script fetches daily data using the lookahead feature to get a broader view of the market trend. It tracks the previous day’s and two days' data for comparison.
⭐ 9. Labels and Customization:
The script dynamically adds labels to the chart for the different plotted indicators at the last bar, making it easier to identify which indicator is being represented.
🚀 Conclusion:
The script combines multiple technical indicators, such as EMA, RSI, VWAP, PSAR, and multi-day moving averages, to visually assess bullish and bearish market conditions. It uses color-coded candlesticks to represent each indicator and sums up the signals to determine the overall trend.

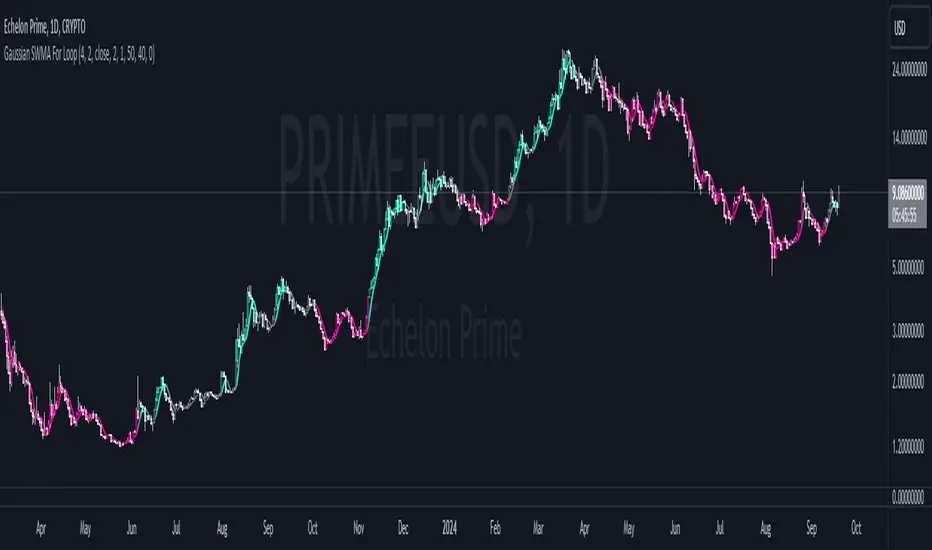
Gaussian SWMA For LoopGaussian SWMA For Loop Indicator
The "Gaussian SWMA For Loop" is a sophisticated indicator designed to identify potential trading opportunities by combining a Gaussian-weighted moving average (WMA) with a simple moving average (SMA), enhanced by a loop-based scoring system. This indicator is tailored for traders looking to capture trends and reversals with a refined approach, making use of advanced filtering techniques and custom thresholds for signal generation.
Key Features:
1. Gaussian Weighted Moving Average (WMA):
The indicator starts by applying a Gaussian filter to the input price data (default is the closing price). The Gaussian filter smooths the data by applying weights according to a Gaussian distribution, determined by the Gaussian Sigma parameter. This results in a smooth, noise-reduced WMA, which is more responsive to significant price movements while ignoring minor fluctuations.
2. Simple Moving Average (SMA) on Smoothed Data:
After the data is smoothed using the Gaussian filter, an SMA is calculated over this smoothed data. The length of this SMA can be adjusted via the SMA Length input, allowing users to control the level of additional smoothing applied to the already filtered data.
3. Loop-Based Scoring System:
Range Analysis: The core feature of this indicator is the loop-based scoring system. It evaluates the filtered SMA by comparing its current value to previous values over a specified range, defined by the From and To parameters.
Score Calculation: The loop iterates through each value within the defined range and adjusts a score based on whether the current filtered SMA is higher or lower than its historical values. This score is a measure of the trend's strength and direction.
Thresholds for Signal Generation: Users can define custom thresholds for long (Long Threshold) and short (Short Threshold) signals. The score is compared against these thresholds to generate buy and sell signals.
4. Signal Generation:
Buy Signal (L): Triggered when the score exceeds the user-defined Long Threshold.
Sell Signal (S): Triggered when the score falls below the Short Threshold.
5. Visual Enhancements:
The indicator plots the filtered SMA on the chart, with the line and bar colors changing based on the buy and sell signals:
Teal (color.rgb(0, 255, 187)) for a buy signal.
Magenta (color.rgb(255, 0, 157)) for a sell signal.
Gray for a neutral condition.
Additionally, the fill between the current and previous SMA values is colored based on the signal, providing a clear visual cue for trend direction and strength.
6. Alert Conditions:
The indicator includes customizable alerts that notify the user when a buy or sell signal is generated:
Long Alert: Notifies when a buy signal is triggered.
Short Alert: Notifies when a sell signal is triggered.
Configurable Inputs:
Main Group:
WMA Length (length): Sets the length of the Gaussian-weighted moving average.
SMA Length (len): Specifies the period for the SMA applied to the Gaussian-smoothed data.
Source (src): The price data used for calculations (default is the closing price).
Gaussian Sigma (sigma): Determines the standard deviation of the Gaussian distribution, influencing the smoothing effect.
For Loop Group:
From (a): The starting point for the loop-based score analysis.
To (b): The endpoint for the loop-based score analysis.
Threshold Group:
Long Threshold (threshold_L): Defines the score threshold above which a buy signal is triggered.
Short Threshold (threshold_S): Defines the score threshold below which a sell signal is triggered.
Practical Use:
This indicator is ideal for traders who want to identify trends and potential reversals with precision. The combination of Gaussian smoothing, SMA, and the loop-based scoring system offers a robust method to filter out noise and focus on significant market moves. The customizable thresholds and alert system further enhance its utility, making it a powerful tool for both manual and automated trading strategies.
Note: As with any trading indicator, it's recommended to backtest the "Gaussian SWMA For Loop" under various market conditions and use it in conjunction with other analysis techniques to confirm signals before making trading decisions.
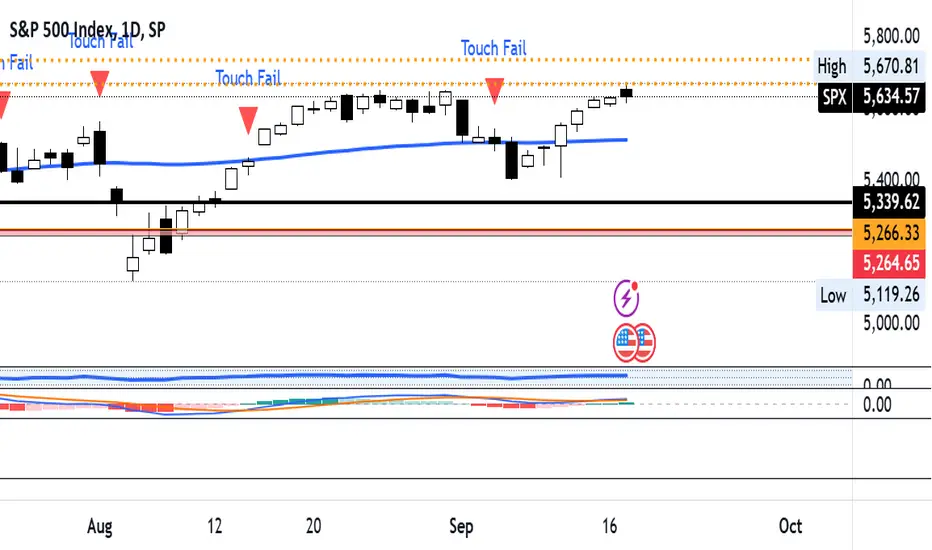
Price Touches 50-Day MA and Fails to CrossOverview: The Price Touches 50-Day MA and Fails to Cross Indicator is a powerful tool designed for traders and analysts using TradingView to monitor and identify key interactions between an asset's price and its 50-day Simple Moving Average (SMA). This indicator specifically highlights moments when the price touches the 50-day MA but fails to cross it, signaling potential support or resistance levels that could influence future price movements.
Key Features:
50-Day Simple Moving Average (SMA) Calculation:
Automatically calculates and plots the 50-day SMA on your chart, providing a clear reference point for price action analysis.
Touch Detection:
Identifies when the closing price comes within a user-defined tolerance (default is 0.1%) of the 50-day MA, indicating a "touch."
Failure to Cross Confirmation:
Determines if the price, after touching the MA, fails to cross it in the subsequent bar. This helps in recognizing potential reversal points or consolidation zones.
Visual Indicators:
Plots red downward triangles above the bars where a touch-and-fail event occurs, making it easy to spot these critical moments at a glance.
Customizable Touch Tolerance:
Allows users to adjust the sensitivity of touch detection by modifying the touch tolerance percentage, catering to different trading strategies and asset volatilities.
Alert Conditions:
Offers the option to set up alerts that notify you whenever a touch-and-fail event is detected, ensuring you never miss significant trading signals.
How It Works:
Calculating the 50-Day SMA:
The indicator computes the 50-day SMA using the closing prices, providing a smooth average that reflects the asset's mid-term trend.
Detecting a Touch:
A "touch" is registered when the absolute difference between the closing price and the 50-day SMA is less than or equal to the specified tolerance. This proximity suggests a potential support or resistance level.
Confirming Failure to Cross:
After a touch is detected, the indicator checks whether the price fails to move beyond the 50-day MA in the next bar. If the price remains on the original side of the MA, it signifies a failed attempt to cross, highlighting a possible reversal or consolidation.
Plotting Indicators:
When a touch-and-fail event is confirmed, a red downward triangle is plotted above the corresponding bar, providing a clear visual cue for traders.
Setting Up Alerts:
Users can enable alert conditions to receive real-time notifications whenever a touch-and-fail event is detected, allowing for timely trading decisions.
Customization Options:
Touch Tolerance (%):
Adjust the touch_tolerance input to set how close the price needs to be to the 50-day MA to be considered a touch. This flexibility allows the indicator to be tailored to different trading styles and asset behaviors.
Visual Styles:
Customize the appearance of the SMA line and the touch-fail indicators to match your charting preferences, ensuring seamless integration with your existing setup.
Benefits:
Enhanced Decision-Making:
By highlighting key interactions with the 50-day MA, this indicator aids in identifying potential entry and exit points, improving overall trading strategy.
Time Efficiency:
Automates the process of monitoring price movements relative to the 50-day MA, saving traders valuable time and reducing the need for constant manual analysis.
Versatility:
Suitable for various asset classes, including stocks, forex, commodities, and cryptocurrencies, making it a versatile tool for any trader's toolkit.
Happy Trading!
Daily Moving Average for Intraday TimeframesThis indicator provides a dynamic tool for visualizing the Daily Moving Average (DMA) on intraday timeframes.
It allows you to analyze how the price behaves in relation to the daily moving average in timeframes from 1 minute up to 1 day.
KEY FEATURES
DMA on Intraday timeframes only : This indicator is designed to work exclusively on intraday charts with timeframes between 1 minute and 1 day. It will not function on tick, second-based, or daily-and-above charts.
Color-Coded Zones for Trend Identification :
Green Zone: The price is above a rising DMA, signaling a bullish momentum.
Red Zone: The price is below a falling DMA, signaling a bearish momentum.
Yellow Zone: Signaling uncertainty or mixed conditions, where either the price is above a falling DMA or below a rising/flat DMA.
Configurable DMA Period : You can adjust the number of days over which the DMA is calculated (default is 5 days). This can be customized based on your trading strategy or market preferences.
24/7 Market Option : For assets that trade continuously (e.g., cryptocurrencies), activate the "Is trading 24/7?" setting to ensure accurate calculations.
WHAT IS THE DMA AND WHY USE IT INTRADAY?
The Daily Moving Average is a Simple Moving Average indicator used to smooth out price fluctuations over a specified period (in days) and reveal the underlying trend.
Typically, a SMA takes price value for the current timeframe and reveal the trend for this timeframe. It gives you the average price for the last N candles for the given timeframe.
But what makes the Intraday DMA interesting is that it shows the underlying trend of the Daily timeframe on a chart set on a shorter timeframe . This helps to align intraday trades with broader market movements.
HOW IS THE DMA CALCULATED?
If we are to build a N-day Daily Moving Average using a Simple Moving Average, we need to take the amount of candles A needed in that timeframe to account for a period of a day and multiply it by the number of days N of the desired DMA.
So for instance, let say we want to compute the 5-Day DMA on the 10 minute timeframe :
In the 10 minute timeframe there are 39 candles in a day in the regular session.
We would take the 39 candles per day and then multiply that by 5 days. 39 x 5 = 195.
So a 5-day moving average is represented by a simple moving average with a period of 195 when looking at a 10 minute timeframe.
So for each period, to create a 5-day DMA, you would have to set the period of your simple moving average like so :
- 195 minutes = 10 period
- 130 minutes = 15 period
- 65 minutes = 30 period
- 30 minutes = 65 period
- 15 minutes = 130 period
- 10 minutes = 195 period
- 5 minutes = 390 period
and so on.
This indicator attempts to do this calculation for you on any intraday timeframe and whatever the period you want to use is for your DMA. You can create a 10-day moving average, a 30-day moving average, etc.

Pink's Daily SMA Script🚗 This script provides a customizable overlay of seven simple moving averages (SMAs) on the chart. Users can control the display of each SMA by toggling them on or off. The lengths of these SMAs are adjustable, allowing for tailored analysis based on individual preferences.
📊 The script calculates daily SMA values using the request.security() function and plots them as horizontal lines on the chart. These SMAs are updated once per day, typically at the start of the pre-market session (9:00 AM in the "America/New_York" timezone). The script resets the SMA values at the start of each new day, ensuring fresh data for daily analysis.
🕒 In addition to the SMAs, the script includes an optional feature that highlights specific time ranges on the chart: from 11:00 AM to 11:05 AM and from 1:00 PM to 1:30 PM (based on the "America/New_York" timezone). Users can toggle these background highlights on or off, providing visual cues for key times during the trading day. The 11:00 AM window is highlighted in gray, while the 1:00 PM window is highlighted in blue.
🔖 The SMAs are labeled on the right side of the chart, with only one label visible at a time for each SMA. These labels display the length of the respective SMA, and their colors match the lines drawn on the chart, helping to distinguish between the different SMAs.
Special thanks to Pinks333 (www.tradingview.com)
Who provided the logic for the script and was willing to share her logic and open source the script.

Dynamic ConfluenceThe Dynamic MA Confluence Indicator is a powerful tool designed to simplify your trading experience by automatically identifying the most influential moving average (MA) lengths on your chart. Whether you're using Simple Moving Averages (SMA) or Exponential Moving Averages (EMA), this indicator helps you pinpoint the MA length that holds the greatest confluence, allowing you to make informed trading decisions with ease.
How It Works:
This indicator analyzes a wide range of moving averages, from short-term to long-term, to determine which ones are closest to each other. By setting a "Proximity Percentage," you can control how close these MAs need to be to be considered as having confluence. The indicator then calculates the average of these close MAs to establish a dynamic support or resistance level on your chart.
Why Use This Indicator?
Automatic Optimization: Unsure of which MA length to apply? The indicator automatically highlights the MA length with the most confluence, giving you a clear edge in identifying significant market levels.
Adaptability: Choose between SMA and EMA to suit your trading strategy and market conditions.
Enhanced Decision-Making: By focusing on the MA length with the greatest influence, you can better anticipate market movements and adjust your strategies accordingly.
Customizable Sensitivity: Adjust the Proximity Percentage to fine-tune the indicator's sensitivity, ensuring it aligns with your trading preferences.
Key Feature:
Current Key Confluence MA Length: Displayed in an optional table, this feature shows the MA length that currently has the most impact on the confluence level, providing you with actionable insights at a glance.
Whether you're a seasoned trader or just starting, the Dynamic MA Confluence Indicator offers a streamlined approach to understanding market dynamics, helping you trade smarter and with more confidence. This presentation text is designed to clearly communicate the purpose, functionality, and benefits of the indicator, making it easy for users to understand its value and how it can enhance their trading strategies.
The Dynamic MA Confluence Indicator is a tool designed to assist traders in analyzing market trends. It should not be considered as financial advice or a guarantee of future performance. Trading involves significant risk, and it is possible to lose more than your initial investment. Users should conduct their own research and consider their financial situation before making trading decisions. Always consult with a financial advisor if you are unsure about any trading strategies or decisions. This disclaimer is intended to remind users of the inherent risks in trading and the importance of conducting their own due diligence.

Sma Standard Deviation | viResearchSma Standard Deviation | viResearch
Conceptual Foundation and Innovation
The "Sma Standard Deviation" indicator from viResearch combines the benefits of Simple Moving Average (SMA) smoothing with Standard Deviation (SD) analysis, offering traders a powerful tool for understanding price trends and volatility. The SMA provides a straightforward approach to trend detection by calculating the average price over a defined period, while the SD component adds insight into the market's volatility by measuring the variation of prices around the SMA. This combination helps traders identify whether the price is moving within a typical range or deviating significantly, which can signal potential trend shifts or periods of increased volatility. By using both SMA and SD together, this indicator enhances the trader's ability to detect not only the trend direction but also how strongly the market is deviating from that trend, offering more informed decision-making.
Technical Composition and Calculation
The "Sma Standard Deviation" script uses two key elements: the Simple Moving Average (SMA) and Standard Deviation (SD). The SMA is calculated over a user-defined length and represents the smoothed average price over this period. The script also incorporates DEMA smoothing applied to different price sources, providing further refinement to the trend analysis. The SD is calculated by measuring the deviation of the price from the SMA over a separate user-defined length, showing how volatile the price is relative to its average. The script generates upper and lower SD boundaries by adding and subtracting the SD from the SMA, creating a volatility-adjusted range for the price. This allows traders to visualize whether the price is moving within expected bounds or breaking out of its typical range. The script monitors crossovers between the DEMA, SMA, and SD boundaries, generating trend signals based on these interactions.
Features and User Inputs
The "Sma Standard Deviation" script offers several customizable inputs, allowing traders to adjust the indicator to their specific strategies. The SMA Length controls the period for which the moving average is calculated, while the SD Length defines how long the period is for measuring price deviation. Additionally, the DEMA smoothing length can be adjusted for both the trend and standard deviation calculations, giving traders control over how responsive or smooth they want the indicator to be. The script also includes alert conditions that notify traders when trend shifts occur, either to the upside or downside.
Practical Applications
The "Sma Standard Deviation" indicator is designed for traders who want to analyze both market trends and volatility in a unified tool. The combination of the SMA and SD helps traders identify potential trend reversals, as large deviations from the SMA can indicate periods of increased volatility that precede significant price moves. This makes the indicator particularly effective for identifying trend reversals, managing volatility, and improving trend-following strategies. By analyzing when the price moves outside the volatility-adjusted range defined by the SD, traders can detect early signals of potential trend reversals. The SD component helps traders understand how volatile the market is relative to its average price, allowing for more informed decisions in both trending and volatile market conditions. The dual use of DEMA and SMA smoothing allows for a clearer trend signal, helping traders stay aligned with the prevailing market direction while managing the noise caused by short-term volatility.
Advantages and Strategic Value
The "Sma Standard Deviation" script offers significant value by integrating both trend detection and volatility analysis into a single tool. The use of SMA for smoothing price trends, combined with the SD for assessing price volatility, provides a more comprehensive view of the market. This dual approach helps traders filter out false signals caused by short-term fluctuations while identifying potential trend changes driven by increased volatility. This makes the "Sma Standard Deviation" indicator ideal for traders seeking a balance between trend-following and volatility management.
Alerts and Visual Cues
The script includes alert conditions that notify traders when significant trend shifts occur based on price crossovers with the SMA and SD boundaries. The "Sma Standard Deviation Long" alert is triggered when the price crosses above the upper volatility boundary, indicating a potential upward trend. Conversely, the "Sma Standard Deviation Short" alert signals a possible downward trend when the price crosses below the lower boundary. Visual cues, such as changes in the color of the SMA line, help traders quickly identify trend shifts and act accordingly.
Summary and Usage Tips
The "Sma Standard Deviation | viResearch" indicator provides traders with a robust tool for analyzing market trends and volatility. By combining the benefits of SMA smoothing with SD analysis, this script offers a comprehensive approach to detecting trend changes and managing risk. Incorporating this indicator into your trading strategy can help improve your ability to spot trend reversals, understand market volatility, and stay aligned with the broader market direction. The "Sma Standard Deviation" is a reliable and customizable solution for traders looking to enhance their technical analysis in both trending and volatile markets.
Note: Backtests are based on past results and are not indicative of future performance.

Lsma | viResearchLsma | viResearch
Certainly! Here's the revised text:
Conceptual Foundation and Innovation
The "Lsma" (Least Squares Moving Average) indicator, developed by viResearch, offers a refined approach to trend detection by using linear regression to smooth price data. Unlike traditional moving averages, the Lsma reduces lag by fitting a linear regression line through the data points, providing a more responsive and accurate representation of price trends. This dynamic approach enables traders to capture market movements with greater precision, especially in fast-moving markets.
Technical Composition and Calculation
The "Lsma" indicator is based on the least squares method, a statistical analysis technique that minimizes the difference between observed and predicted values. By applying this method to price data, the Lsma indicator calculates a trend line that reduces the impact of random fluctuations.
Linear Regression Calculation:
Length (len_lsma): The Lsma is computed over a user-defined period, allowing traders to adjust the sensitivity of the indicator to market conditions. A longer period provides a smoother trend, while a shorter period makes the indicator more responsive to recent price changes.
Offset (off): The script includes an optional offset parameter, which shifts the trend line forward or backward, providing additional flexibility in visualizing market trends.
Source (src): The input source (default: close price) determines which price data the Lsma is applied to. This can be customized to suit various trading strategies.
Trend Identification:
Lsma Direction: The script compares the current Lsma value to its previous value to detect trend direction. If the Lsma is increasing and the price is above it, this signals an uptrend (L). Conversely, if the Lsma is decreasing and the price is below it, this signals a downtrend (S).
Entry Confirmation (en): The user can select an entry confirmation source to further validate potential trade signals. This ensures that traders are not solely reliant on the Lsma's trend direction but can also confirm signals with additional data points.
Features and User Inputs
The "Lsma" script offers several customizable options, making it adaptable to various trading styles and market conditions:
Lsma Length: Controls the period over which the Lsma is calculated. Traders can increase this value to smooth out short-term fluctuations or reduce it for faster trend detection.
Offset: Allows users to shift the Lsma plot, which can help in analyzing trends or refining entry and exit points.
Source and Entry Confirmation: The indicator can be applied to different data sources, and users can select a secondary confirmation source for more accurate signal generation.
Practical Applications
The "Lsma" indicator is a versatile tool, especially well-suited for traders seeking to capture trends with minimal lag. It is particularly effective in volatile markets where traditional moving averages may lag behind price action, leading to delayed signals.
Key Uses:
Trend Following: The Lsma provides a clear view of the market's direction, allowing traders to align their positions with the prevailing trend.
Signal Confirmation: The entry confirmation feature enhances the reliability of trend signals, reducing the likelihood of false entries in choppy markets.
Trade Timing: The customizable length and offset settings give traders flexibility in determining the optimal timing for entering and exiting trades.
Advantages and Strategic Value
The "Lsma" indicator offers several advantages over traditional moving averages:
Reduced Lag: By applying linear regression, the Lsma minimizes lag, providing more timely trend signals.
Customizability: The adjustable length, offset, and source inputs give traders the ability to fine-tune the indicator to their specific needs.
Trend Clarity: The indicator's design ensures that only significant trends are captured, filtering out short-term noise that can obscure the bigger picture.
Summary and Usage Tips
The "Lsma" indicator is an excellent tool for trend-following traders, offering a powerful blend of precision and adaptability. By using linear regression, it provides a more accurate and responsive measure of price trends, helping traders stay aligned with market direction. For best results, traders should experiment with different Lsma lengths and entry confirmation sources to tailor the indicator to their strategy. Whether used for identifying trend reversals or confirming trend strength, the "Lsma" indicator is a reliable and versatile solution for modern trading.

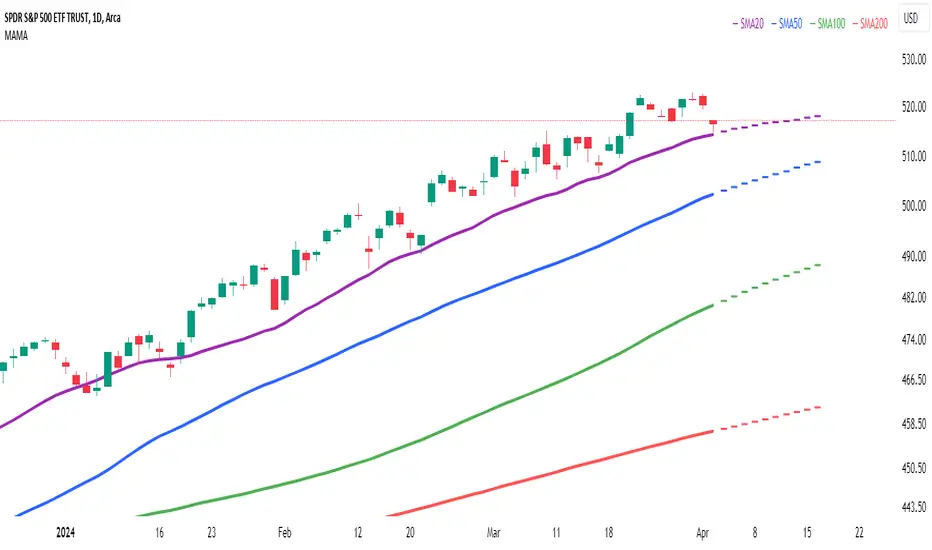
Multi Adaptive Moving Average (MAMA)The Multi Adaptive Moving Average (MAMA) indicator is an advanced tool for technical analysis, designed to provide traders with a detailed understanding of market trends and potential future price movements. This indicator utilizes multiple Simple Moving Averages (SMAs) and forecasting techniques to enhance decision-making processes.
Simple Moving Averages (SMAs):
Short MA (20-period): This moving average is highly responsive to price changes, making it ideal for capturing short-term trends. It helps traders identify quick market shifts and potential entry or exit points.
Mid MA (50-period): This average strikes a balance between short- and long-term trends, offering insights into the market's intermediate direction. It aids in confirming the sustainability of short-term trends.
Long MA (100-period): By smoothing out price data over a longer period, this moving average is useful for identifying long-term trends and filtering out short-term volatility.
Very Long MA (200-period): Often considered a critical indicator for determining the overall market trend, this average helps confirm the direction and strength of long-term movements.
Forecasting:
Flat Forecast: This approach assumes that prices will remain constant in the near future, which is particularly useful in markets trading sideways without a clear trend direction.
Linear Regression Forecast: This method uses historical data to project future price movements, offering a dynamic forecast based on existing trends. It helps traders anticipate potential price changes and plan their strategies accordingly.
Advantages:
Comprehensive Trend Analysis: By incorporating four different SMAs, the indicator provides a layered view of market trends across various timeframes. This enables traders to identify potential trend reversals and continuations with greater accuracy.
Predictive Insights: The forecasting feature offers traders a forward-looking perspective, enabling them to anticipate market movements and adjust their trading strategies proactively. This can be especially advantageous in volatile markets.
Customization: The MAMA indicator is highly customizable, allowing traders to adjust parameters such as the source of price data and the inclusion of the current unclosed candle. This flexibility ensures that the indicator can be tailored to fit different trading styles and market conditions.
Visual Clarity: The use of distinct colors for each SMA and their forecasts enhances visual interpretation, making it easier for traders to quickly assess market conditions and make informed decisions. The inclusion of a legend further aids in distinguishing between the different moving averages and their respective forecasts.
How to Use:
Trend Confirmation: Use the alignment of the SMAs to confirm market trends. For example, when the Short MA crosses above the Mid and Long MAs, it may indicate a bullish trend, while the opposite could suggest a bearish trend.
Entry and Exit Points: Look for crossovers between the SMAs as potential signals for entering or exiting trades. The forecasts can help in timing these decisions by providing an expectation of future price movements.
Risk Management: Utilize the Very Long MA to set stop-loss and take-profit levels, as it reflects the long-term trend and can help in avoiding trades against the prevailing market direction.
The MAMA indicator is intended to support technical analysis and should not be used as the sole basis for making trading decisions. Financial markets are inherently uncertain, and past performance does not guarantee future results. Traders should use this tool in conjunction with other analytical methods and consider their risk tolerance and investment objectives. It is advisable to conduct thorough research and consult with a financial advisor before making significant trading decisions. Always be aware of the risks involved in trading and invest only what you can afford to lose.
BTC Top Indicator - Extension from 20 Week SMA (Normalized)This Indicator calculates the logarithmic deviation of the BTCUSD price from its 20-week SMA and dynamically normalizes it between a lower signal line (-0.57) and an upper trendline defined by two historical points (May 30, 2011, at 1.75 and March 4, 2024, at 0.45).
The indicator line color changes dynamically:
green below 0
blue at 0.5
red above 1
Ideal for analyzing BTCUSD on the Index chart to identify potential overbought or oversold levels. It's better suited for identifying tops, than bottoms.

Uptrick: SMA Pivot Marker### Uptrick: SMA Pivot Marker (SPM) — Extensive Guide
#### Introduction
The **Uptrick: SMA Pivot Marker (SPM)** is a sophisticated technical analysis tool crafted by Uptrick to help traders interpret market trends and identify key price levels where significant reversals might occur. By integrating the principles of the Simple Moving Average (SMA) with pivot point analysis, the SPM offers a comprehensive approach to understanding market dynamics. This extensive guide explores the purpose, functionality, and practical applications of the SPM, providing an in-depth analysis of its features, settings, and usage across various trading strategies.
#### Purpose of the SPM
The **SMA Pivot Marker (SPM)** aims to enhance trading strategies by offering a dual approach to market analysis:
1. **Trend Identification**:
- **Objective**: To discern the prevailing market direction and guide trading decisions based on the overall trend.
- **Method**: Utilizes the SMA to smooth out price fluctuations, providing a clearer picture of the trend. This helps traders align their trades with the market's direction, increasing the probability of successful trades.
2. **Pivot Point Detection**:
- **Objective**: To identify key levels where the price is likely to reverse, providing potential support and resistance zones.
- **Method**: Calculates and marks pivot highs and lows, which are significant price points where previous trends have reversed. These levels are used to predict future price movements and establish trading strategies.
3. **Trend Change Alerts**:
- **Objective**: To notify traders of potential shifts in market direction, enabling timely adjustments to trading positions.
- **Method**: Detects and highlights crossover and crossunder points of the smoothed line, indicating possible trend changes. This helps traders react promptly to changing market conditions.
#### Detailed Functionality
1. **Smoothing Line Calculation**:
- **Simple Moving Average (SMA)**:
- **Definition**: The SMA is a type of moving average that calculates the average of a security’s price over a specified number of periods. It smooths out price data to filter out short-term fluctuations and highlight the longer-term trend.
- **Calculation**: The SMA is computed by summing the closing prices of the chosen number of periods and then dividing by the number of periods. For example, a 20-period SMA adds the closing prices for the past 20 periods and divides by 20.
- **Purpose**: The SMA helps in identifying the direction of the trend. A rising SMA indicates an uptrend, while a falling SMA indicates a downtrend. This smoothing helps traders to avoid being misled by short-term price noise.
2. **Pivot Points Calculation**:
- **Pivot Highs and Lows**:
- **Definition**: Pivot points are significant price levels where a market trend is likely to reverse. A pivot high is the highest price over a certain period, surrounded by lower prices on both sides, while a pivot low is the lowest price surrounded by higher prices.
- **Calculation**: The SPM calculates pivot points based on a user-defined lookback period. For instance, if the lookback period is set to 3, the indicator will find the highest and lowest prices within the past 3 periods and mark these points.
- **Purpose**: Pivot points are used to identify potential support and resistance levels. Traders often use these levels to set entry and exit points, stop-loss orders, and to gauge market sentiment.
3. **Visualization**:
- **Smoothed Line Plot**:
- **Description**: The smoothed line, calculated using the SMA, is plotted on the chart to provide a visual representation of the trend. This line adjusts its color based on the trend direction, helping traders quickly assess the market condition.
- **Color Coding**: The smoothed line is colored green (upColor) when it is rising, indicating a bullish trend, and red (downColor) when it is falling, indicating a bearish trend. This color-coding helps traders visually differentiate between uptrends and downtrends.
- **Line Width**: The width of the line can be adjusted to improve visibility. A thicker line may be more noticeable, while a thinner line might provide a cleaner look on the chart.
- **Pivot Markers**:
- **Description**: Pivot highs and lows are marked on the chart with lines and labels. These markers help in visually identifying significant price levels.
- **Color and Labels**: Pivot highs are represented with green lines and labels ("H"), while pivot lows are marked with red lines and labels ("L"). This color scheme and labeling make it easy to distinguish between resistance (highs) and support (lows).
4. **Trend Change Detection**:
- **Trend Up**:
- **Detection**: The indicator identifies an upward trend change when the smoothed line crosses above its previous value. This crossover suggests a potential shift from a downtrend to an uptrend.
- **Usage**: Traders can interpret this signal as a potential buying opportunity or an indication to review and possibly adjust their trading positions to align with the new uptrend.
- **Trend Down**:
- **Detection**: A downward trend change is detected when the smoothed line crosses below its previous value. This crossunder indicates a potential shift from an uptrend to a downtrend.
- **Usage**: This signal can be used to consider selling opportunities or to reassess long positions in light of the emerging downtrend.
#### User Inputs
1. **Smoothing Period**:
- **Description**: This input determines the number of periods over which the SMA is calculated. It directly affects the smoothness of the line and the sensitivity of trend detection.
- **Range**: The smoothing period can be set to any integer value greater than or equal to 1. There is no specified upper limit, offering flexibility for various trading styles.
- **Default Value**: The default smoothing period is 20, which is a common choice for medium-term trend analysis.
- **Impact**: A longer smoothing period results in a smoother line, filtering out more noise and highlighting long-term trends. A shorter period makes the line more responsive to recent price changes, which can be useful for short-term trading strategies.
2. **Pivot Lookback**:
- **Description**: This input specifies the number of periods used to calculate the pivot highs and lows. It influences the sensitivity of pivot point detection and the relevance of the identified levels.
- **Range**: The pivot lookback period can be set to any integer value greater than or equal to 1, with no upper limit. Traders can adjust this parameter based on their trading timeframe and preferences.
- **Default Value**: The default lookback period is 3, which provides a balance between detecting significant pivots and avoiding excessive noise.
- **Impact**: A longer lookback period generates more stable pivot points, suitable for identifying long-term support and resistance levels. A shorter lookback period results in more frequent and recent pivot points, useful for intraday trading and quick responses to price changes.
#### Applications for Different Traders
1. **Trend Followers**:
- **Using the SMA**: Trend followers utilize the smoothed line to gauge the direction of the market. By aligning trades with the direction of the SMA, traders can capitalize on sustained trends and improve their chances of success.
- **Trend Change Alerts**: The trend change markers alert trend followers to potential shifts in market direction. These alerts help traders make timely decisions to enter or exit positions, ensuring they stay aligned with the prevailing trend.
2. **Reversal Traders**:
- **Pivot Points**: Reversal traders focus on pivot highs and lows to identify potential reversal points in the market. These points indicate where the market has previously reversed direction, providing potential entry and exit levels for trades.
- **Pivot Markers**: The visual markers for pivot highs and lows serve as clear signals for reversal traders. By monitoring these levels, traders can anticipate price reversals and plan their trades to exploit these opportunities.
3. **Swing Traders**:
- **Combining SMA and Pivot Points**: Swing traders can use the combination of the smoothed line and pivot points to identify medium-term trading opportunities. The smoothed line helps in understanding the broader trend, while pivot points provide specific levels for potential swings.
- **Trend Change Alerts**: Trend change markers help swing traders spot new swing opportunities as the market shifts direction. These markers provide potential entry points for swing trades and help traders adjust their strategies to capitalize on market movements.
4. **Scalpers**:
- **Short-Term Analysis**: Scalpers benefit from the short-term signals provided by the SPM. The smoothed line and pivot points offer insights into rapid price movements, while the trend change markers highlight quick trading opportunities.
- **Pivot Points**: For scalpers, pivot points are particularly useful in identifying key levels where price may reverse within a short time frame. By focusing on these levels, scalpers can plan trades with tight stop-loss orders and capitalize on quick price changes.
#### Implementation and Best Practices
1. **Setting Parameters**:
- **Smoothing Period**: Adjust the smoothing period according to your trading strategy and market conditions. For long-term analysis, use a longer period to filter out noise and highlight broader trends. For short-term trading, a shorter period provides more immediate insights into price movements.
- **Pivot Lookback**: Choose a lookback period that matches your trading timeframe. For intraday trading, a shorter lookback period offers quick identification of recent price levels. For swing trading or long-term strategies, a longer lookback period provides more stable pivot points.
2. **Combining with Other Indicators**:
- **Integration with Technical Tools**: The SPM can be used in conjunction with other technical indicators to enhance trading decisions. For instance, combining the
SPM with indicators like RSI (Relative Strength Index) or MACD (Moving Average Convergence Divergence) can provide additional confirmation for trend signals and pivot points.
- **Support and Resistance**: Integrate the SPM’s pivot points with other support and resistance levels to gain a comprehensive view of market conditions. This combined approach helps in identifying stronger levels of support and resistance, improving trade accuracy.
3. **Backtesting**:
- **Historical Performance**: Conduct backtesting with historical data to evaluate the effectiveness of the SPM. Analyze past performance to fine-tune the smoothing period and pivot lookback settings, ensuring they align with your trading style and market conditions.
- **Scenario Analysis**: Test the SPM under various market scenarios to understand its performance in different conditions. This analysis helps in assessing the reliability of the indicator and making necessary adjustments for diverse market environments.
4. **Customization**:
- **Visual Adjustments**: Customize the appearance of the smoothed line and pivot markers to enhance chart readability and match personal preferences. Clear visual representation of these elements improves the effectiveness of the indicator.
- **Alert Configuration**: Set up alerts for trend changes to receive timely notifications. Alerts help traders act quickly on potential market shifts without constant monitoring, allowing for more efficient trading decisions.
#### Conclusion
The **Uptrick: SMA Pivot Marker (SPM)** is a versatile and powerful technical analysis tool that combines the benefits of the Simple Moving Average with pivot point analysis. By providing insights into market trends, identifying key reversal points, and detecting trend changes, the SPM caters to a wide range of trading strategies, including trend following, reversal trading, swing trading, and scalping.
With its customizable inputs, visual markers, and trend change alerts, the SPM offers traders the flexibility to adapt the indicator to different market conditions and trading styles. Whether used independently or in conjunction with other technical tools, the SPM is designed to enhance trading decision-making and improve overall trading performance. By mastering the use of the SPM, traders can gain a valuable edge in navigating the complexities of financial markets and making more informed trading decisions.

120 GOAT - Simple Moving Average Breakout IndicatorThe 120 GOAT indicator is a powerful tool designed to help traders identify key breakout points relative to the 120-day Simple Moving Average (SMA). This indicator tracks when the price crosses above or below the 120-day SMA, marking these transition points on the chart with dynamic labels that indicate the percentage change in price since the last crossover.
With the 120 GOAT indicator, traders can:
Identify trend reversals when the price crosses the 120-day SMA.
Monitor price momentum and potential support or resistance levels relative to the 120-day SMA.
Receive alerts when a breakout occurs above or below the 120-day SMA, ensuring they never miss an important market move.
Key Features:
120-day SMA: A customizable 120-day Simple Moving Average that serves as a benchmark for price movements.
Dynamic Labels: The indicator provides labels showing the number of days since the last crossover and the percentage change in price from the previous crossover.
Color-coded Breakout Signals: Labels change color based on the nature of the breakout and price movement:
Above SMA: Green for positive price change, blue for negative.
Below SMA: Orange for positive price change, red for negative.
Price Line Tracking: Displays the current price level relative to the SMA.
Custom Alerts: Set alerts for when the price crosses above or below the 120-day SMA to stay updated on significant market events.
How to Use the 120 GOAT Indicator:
Add the Indicator to Your Chart:
Open TradingView and go to the chart where you want to use the 120 GOAT indicator.
Click on the "Indicators" button at the top of the chart.
Search for "120 GOAT" and select it from the list to apply it to your chart.
Customize the Settings:
Show 120 MA: Toggle this option on if you want the 120-day SMA to be displayed on your chart.
MA Color: Choose your preferred color for the 120-day SMA line.
SMA Length: You can adjust the length of the moving average if you prefer a different period. The default is set to 120 days.
Interpret the Signals:
When the price crosses above the 120-day SMA, the indicator will display a label below the price bar showing the number of days since the last crossover and the percentage change in price. If the price change is positive, the label is green; if negative, it is blue.
When the price crosses below the 120-day SMA, a similar label will appear above the price bar. If the price change is positive, the label is orange; if negative, it is red.
Set Alerts for Key Market Movements:
Go to the Alerts panel and create a new alert.
Select 120 GOAT as the condition.
Choose either "Price Crossed Above SMA 120" or "Price Crossed Below SMA 120" as the alert criteria.
Configure the alert frequency and other settings as needed, then click "Create."
Monitor the Indicator for Trading Opportunities:
Use the breakout signals and percentage change information to identify potential trading opportunities.
Combine this indicator with other technical analysis tools to validate trade setups and enhance decision-making.
Disclaimer: The 120 GOAT indicator is designed for educational purposes and should not be considered as financial advice. Always conduct your own research and consult with a professional financial advisor before making trading decisions.

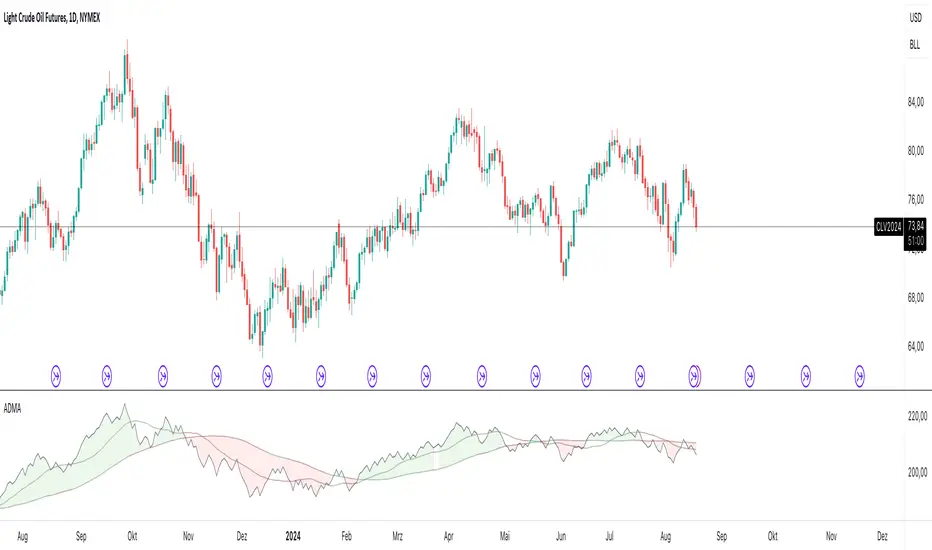
ADMAThe ADMA indicator is a technical analysis tool designed to identify trends and potential reversal points in a financial market. The indicator is based on the cumulative difference between the closing price and the high and low points of a candle. Two moving averages (MAs) are used to smooth the trend dynamics and generate clear signals.
Calculation:
The indicator calculates the trend as the cumulative difference between the current closing price and the maximum (or minimum) value of the current and previous candle, depending on market development.
The ADMA indicator is particularly useful for recognizing market dynamics and making trading decisions based on them. By using double smoothing, false signals are reduced, and the signals generated by the indicator are clear and easy to interpret. It is a flexible tool that can be adapted to different trading strategies.
ChartArt-Bankniftybuying5minName: ChartArt-BankNifty Buying Strategy (5-Minute)
Timeframe: 5-Minute Candles
Asset: BankNifty (Indian Stock Market Index)
Trading Hours: 9:30 AM - 2:45 PM IST (Indian Standard Time)
This strategy is designed for BankNifty intraday traders who want to capitalize on short-term price movements within a defined trading window. It combines technical indicators like Simple Moving Averages (SMA), Relative Strength Index (RSI), and candlestick patterns to identify potential buy signals during intraday downtrends. The strategy employs specific entry, stop-loss, and target conditions to manage trades effectively and minimize risk.
Technical Indicators Used
Simple Moving Averages (SMA):
EMA7: 7-period SMA on closing price.
EMA5: 5-period SMA on closing price.
Purpose: Used to identify the intraday trend by comparing short-term moving averages. The strategy focuses on situations where the market is in a minor downtrend, indicated by EMA5 being below EMA7.
Relative Strength Index (RSI):
RSI14: 14-period RSI, a momentum oscillator that measures the speed and change of price movements.
SMA14: 14-period SMA of the RSI.
Purpose: RSI is used to identify potential reversal points. The strategy looks for situations where the RSI is below its own moving average, suggesting weakening momentum in the downtrend.
Candlestick Patterns:
Relaxed Hammer or Doji (2nd Candle): A pattern where the second candle in a 3-candle sequence shows a potential reversal signal (Hammer or Doji), indicating indecision or a potential turning point.
Bearish 1st Candle: The first candle is bearish, setting up the context for a potential reversal.
Bullish 3rd Candle: The third candle must be bullish with specific characteristics (closing near the high, surpassing the previous high), confirming the reversal.
Strategy Conditions
Time Condition:
The strategy is only active during specific hours (9:30 AM to 2:45 PM IST). This ensures that trades are only taken during the most liquid hours of the trading day, avoiding potential volatility or lack of liquidity towards market close.
Intraday Downtrend Condition:
EMA5 < EMA7: Indicates that the market is in a minor downtrend. The strategy looks for reversal opportunities within this trend.
RSI Condition:
RSI14 <= SMA14: Indicates that the current RSI value is below its 14-period SMA, suggesting potential weakening momentum, which can precede a reversal.
Candlestick Patterns:
1st Candle: Must be bearish, setting up the context for a potential reversal.
2nd Candle: Must either be a Hammer or Doji, indicating a potential reversal pattern.
3rd Candle: Must be bullish, with specific characteristics (closing near the high, breaking the previous high, etc.), confirming the reversal.
RSI Crossover Condition:
A crossover of the RSI over its SMA in the last 5 periods is also checked, adding further confirmation to the reversal signal.
Entry and Exit Rules
Entry Signal:
A buy signal is generated when all the conditions (time, intraday downtrend, bearish 1st candle, hammer/doji 2nd candle, bullish 3rd candle, and RSI condition) are met. The trade is entered at the high of the bullish third candle.
Stop Loss:
The stop loss is calculated based on the difference between the entry price and the low of the second candle. If this difference is greater than 90 points, the stop loss is placed at the midpoint of the second candle's range (average of high and low). Otherwise, it is placed at the low of the second candle.
Target 1:
The first target is set at 1.8 times the difference between the entry price and the stop loss. When this target is hit, half of the position is exited to lock in partial profits.
Target 2:
The second target is set at 3 times the difference between the entry price and the stop loss. The remaining position is exited at this point, or if the price hits the stop loss.
Originality and Usefulness
This strategy is original in its combination of multiple technical indicators and candlestick patterns to identify potential reversals in a specific intraday timeframe. By focusing on minor downtrends and utilizing a 3-candle reversal pattern, the strategy seeks to capture quick price movements with a structured approach to risk management.
Key Benefits:
High Precision: The strategy’s multi-step filtering process (time condition, trend confirmation, candlestick pattern analysis, and momentum evaluation via RSI) increases the likelihood of accurate trade signals.
Risk Management: The use of a dynamic stop-loss based on candle characteristics, combined with partial profit-taking, allows traders to lock in profits while still giving the trade room to develop further.
Structured Approach: The strategy provides a clear, rule-based system for entering and exiting trades, which can help remove emotional decision-making from the trading process.
Charts and Signals
The strategy produces signals in the form of labels on the chart:
Buy Signal: A green label is plotted below the candle that meets all entry conditions, indicating a potential buy opportunity.
Stop Loss (SL): A red dashed line is drawn at the stop-loss level with a label indicating "SL".
Target 1 (1st TG): A blue dashed line is drawn at the first target level with a label indicating "1st TG".
Target 2 (2nd TG): Another blue dashed line is drawn at the second target level with a label indicating "2nd TG".
These visual aids help traders quickly identify entry points, stop loss levels, and target levels on the chart, making the strategy easy to follow and implement.
Backtesting and Optimization
Backtesting: The strategy can be backtested on TradingView using historical data to evaluate its performance. Traders should consider testing across different market conditions to ensure the strategy's robustness.
Optimization: Parameters such as the RSI period, moving averages, and target multipliers can be optimized based on backtesting results to refine the strategy further.
Conclusion
The ChartArt-BankNifty Buying Strategy offers a well-rounded approach to intraday trading, focusing on capturing reversals in minor downtrends. With a strong emphasis on technical analysis, precise entry and exit rules, and robust risk management, this strategy provides a solid framework for traders looking to engage in intraday trading on BankNifty.

Buy and Sell Alerts using VWAPThis is my first script, which I hope you'll enjoy.
The script generates alerts for buy and sell trades using VWAP and volume threshold that you select.
Indicators and Moving Averages :
This script allows you to choose which moving averages like VWAP, 9EMA, 10, 20, 50, 100, 200, and 325 SMAs you want to see on your chart.
Volume Threshold :
You can set a volume threshold, which is the minimum required volume required for buy and sell signals to be considered valid. (For example, I like 60,000 on SPY, 5 minute chart.)
Buy and Sell Signals :
The script checks if the stock prices crosses above or below the VWAP and if the trading volume is above the threshold you set.
If the price crosses above the VWAP and the volume is sufficient, a "Buy" signal is generated.
If the price crosses below the VWAP and the volume is sufficient, a "Sell" signal is generated.
This hopefully user-friendly indicator will alert you when certain conditions trading conditions are met, helping to make it a little easier to make informed trading decisions.

Three Anchored Moving Averages (VWAP / SMA / EMA)
This indicator allows users to anchor three types of moving averages (Simple Moving Average (SMA), Exponential Moving Average (EMA), and Volume Weighted Average Price (VWAP)) to specific points in time (anchor points)
Key Features:
Select from three Moving Average Types:
Simple Moving Average (SMA): Averages the closing prices over a specified period.
Exponential Moving Average (EMA): Gives more weight to recent prices, making it more responsive to new information.
Volume Weighted Average Price (VWAP): Averages the price weighted by volume, useful for understanding the average price at which the asset has traded over a period.
Up to Three Anchor Points:
Users can set up to three different anchor points to calculate the moving averages from specific dates and times. This allows for analysis of price action starting from significant points or specific events. For example, you can anchor to the low and high of a move to identify key levels or to points where the price takes off from a previous anchored MA.
Customisable Sentiment Options:
Each anchor point can be associated with a sentiment input (Auto, Bull, Bear, None), which influences if the MAs are displayed as lines or zones/bands:
Auto: Automatically determines the sentiment based on whether anchor points are on pivot highs and lows. If anchored to a pivot high, the system will assume a bearish sentiment and display a red band or zone between the MA OHLC4 and High. Anchoring to a pivot low will display a green band (OHLC4 - Low).
Bull: Forces a bullish sentiment (Green Band - OHLC4 to Low)
Bear: Forces a bearish sentiment (Red Band - OHLC4 to High)
None: Ignores sentiment and displays a single line (OHLC4)
Chart Matching:
The indicator includes an option to display the moving averages only if the chart symbol matches a specified ticker. This feature ensures that the indicator is relevant to the specific asset being analysed.
How to Use the Indicator:
1. Set Anchor Points: When added to your chart, select three anchor points by point and click. If you only wish to anchor to a single point, click on that point three times and disable the other two in settings once the indicator is applied.
2. Select Moving Average Type: Choose between SMA, EMA, or VWAP using the dropdown menu. EMAs are the most responsive.
3. Enable/Disable Anchor Points: Use the checkboxes to enable or disable each anchor point.
4. Select Sentiment Type: Choose between Auto, Bull, Bear, or None.
5. Chart Matching: Optionally, specify a chart symbol to restrict the indicator's display to that particular asset.
6. Interpret the Plots: The indicator plots the high, mid, and low values of the selected moving average type from each anchor point. The fills between these plots help identify potential support and resistance zones. These should be used as points of interest for pullback reversals or potential continuation if the price breaks through.
Practical Applications:
Trend Analysis: Identify the overall trend direction from specific historical points.
Support and Resistance: Determine key dynamic support and resistance levels based on anchored moving averages.
Event-Based Analysis: Anchor the moving averages to significant events (e.g., earnings releases, economic data) to study their impact on price trends.
Multi Timeframe Analysis: Higher Timeframe Anchors can be used to identify longer term trend analysis. Switching to a lower timeframe for execution triggers at these points wont distort the MA levels as they are anchored to a specific point in time
Intraday or Swing Trading: trend analysis using anchor points can be used for any style of trading (Intraday / Swing / Invest). Use anchored levels as points of interest and wait for hints in price action to try and catch the next move.

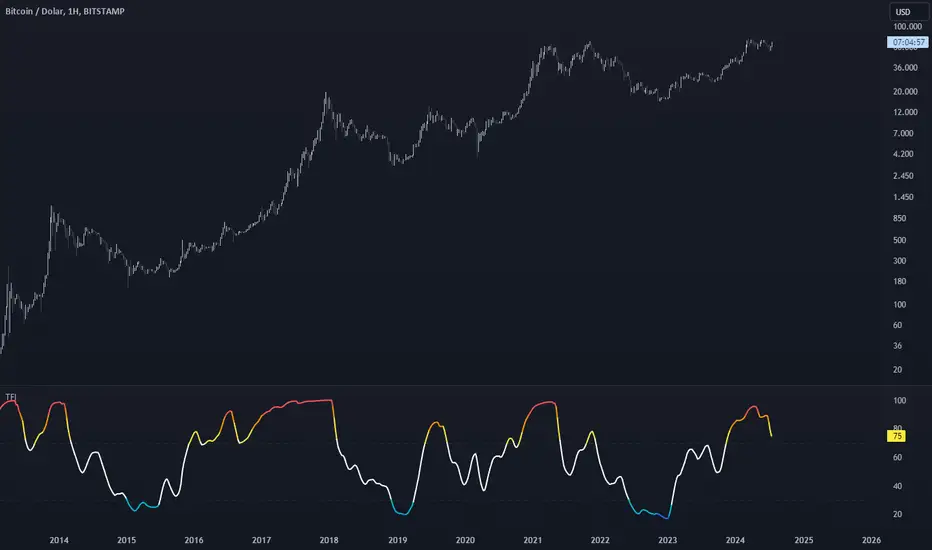
Trend Follower IndexDescription
The purpose of this index is to give an idea about the possible direction of the trend. The index is overbought between 70 and 100, and oversold between 30 and 0. Unlike a typical RSI calculation, the 6-bar simple moving average of the price is calculated first. Then, the 21-bar RSI value of this moving average is calculated.
Why
The 6-bar average is often one of the best averages to show the direction of prices. Closes below this average give strong indications of a trend reversal. To display this average on the horizontal plane, I used the RSI function and took 21 bar as the reference length. Because in my research, I realized that 21 bar length is the most ideal upper and lower points. That's why I coded an indicator that shows where a trend is going and how far that trend needs to go.
Use
It becomes oversold when the Moving Average falls below 30. Here we encounter 3 types of colors;
Light Blue: Indicates that the average is between 30 and 20. It indicates the stage when small purchases begin and the decline rate of the trend begins to decrease.
Blue: Indicates that the average is between 20 and 10. It indicates the stage when purchases begin to become more frequent and the rate of trend decline begins to decrease slightly.
Green: Indicates that the average has fallen below 10. It is the ideal level for purchasing. This indicates the stage when buying pressure has increased significantly and the trend is ready to reverse upward.
As the level decreases, purchases should increase.
Again, when the average value exceeds 70, it becomes overbought. Here we encounter three types of colors;
Yellow: Indicates that the average is between 70 and 80. It indicates the stage when small sales begin and the rate of increase in the trend begins to decrease.
Orange: Indicates that the average is between 80 and 90. It indicates the stage when sales begin to become more frequent and the upward trend begins to decrease somewhat.
Red: Indicates the average is above 90. It is an ideal level for sales. It now marks the stage where selling pressure has increased significantly and the trend is ready to turn downwards.
As the level increases, sales should increase.
Originality
First of all, this moving average is not an RSI. RSI is only used to establish the average on a flat basis. The RSI is merely a helpful tool in determining how much the moving average will rise or fall.
The 6-bar average of the value obtained by calculating Bar (Opening + Closing + High + Low) / 4 gives information about the main trend. In my research and usage, I have observed that as long as the price remains above this average, the price continues to move upwards, and when it remains below it, it is willing to move downwards.
Disclaimer
This indicator is for informational purposes only and should be used for educational purposes only. You may lose money if you rely on this to trade without additional information. Use at your own risk.
Version
v1.0
Vlad Waves█ CONCEPT
Acceleration Line (Blue)
The Acceleration Line is calculated as the difference between the 8-period SMA and the 20-period SMA.
This line helps to identify the momentum and potential turning points in the market.
Signal Line (Red)
The Signal Line is an 8-period SMA of the Acceleration Line.
This line smooths out the Acceleration Line to generate clearer signals.
Long-Term Average (Green)
The Long-Term Average is a 200-period SMA of the Acceleration Line.
This line provides a broader context of the market trend, helping to distinguish between long-term and short-term movements.
█ SIGNALS
Buy Mode
A buy signal occurs when the Acceleration Line crosses above the Signal Line while below the Long-Term Average. This indicates a potential bullish reversal in the market.
When the Signal Line crosses the Acceleration Line above the Long-Term Average, consider placing a stop rather than reversing the position to protect gains from potential pullbacks.
Sell Mode
A sell signal occurs when the Acceleration Line crosses below the Signal Line while above the Long-Term Average. This indicates a potential bearish reversal in the market.
When the Signal Line crosses the Acceleration Line below the Long-Term Average, consider placing a stop rather than reversing the position to protect gains from potential pullbacks.
█ UTILITY
This indicator is not recommended for standalone buy or sell signals. Instead, it is designed to identify market cycles and turning points, aiding in the decision-making process.
Entry signals are most effective when they occur away from the Long-Term Average, as this helps to avoid sideways movements.
Use larger timeframes, such as daily or weekly charts, for better accuracy and reliability of the signals.
█ CREDITS
The idea for this indicator came from Fabio Figueiredo (Vlad).

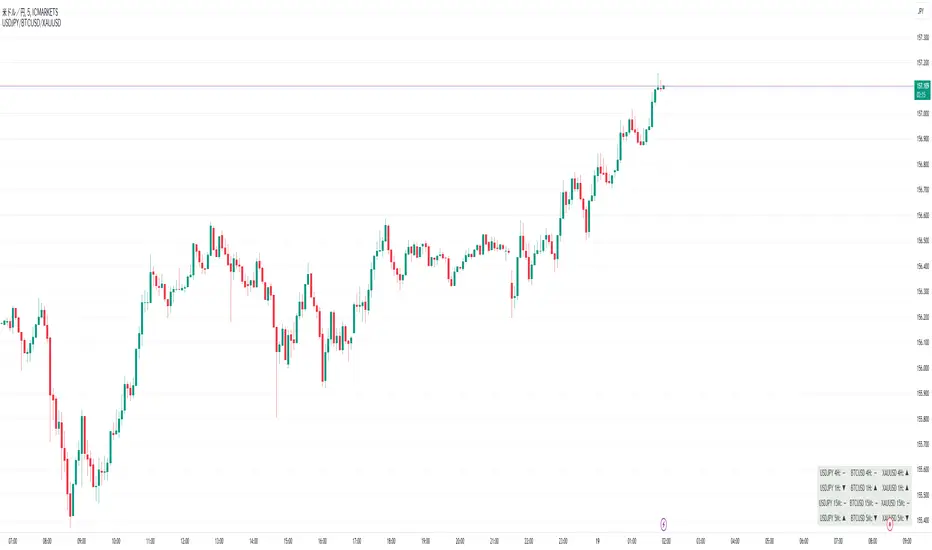
Perfect Order Alert USDJPY/BTCUSD/XAUUSDPerfect Order Alert USDJPY/BTCUSD/XAUUSD 日本語解説は下記
This indicator detects the perfect order of three moving averages and displays on the Panel in an easy-to-understand visual manner whether there is an uptrend, downtrend, or non-trend for each time leg.
This indicator detects perfect orders for the three currency pairs USDJPY/BTCUSD/XAUUSD on the 5-minute, 15-minute, 1-hour, and 4-hour time frames, and displays them on the Panel on the chart, with “▲” for up, “▼” for down, and “ー” for non-trend, so that you can quickly determine the trend. The panel is displayed on the chart.
In order to check for perfect orders without missing them, it is also possible to set up alerts that notify you of all the time frames and currency pairs as well.
Functions
Displaying 4H, 1H, 15M, 5M, up (▲), down (▼), other (-), of USDJPY/BTCUSD/XAUUSD on the panel.
*(By default, 20EMA, 75EMA, and 200EMA are hidden.)
Display position setting of the panel (You can choose from upper left, upper top, upper right, lower left, lower bottom, or lower right).
Panel color and text color change function
The moving average line can be hidden by default.
Moving average period change
Moving average color and thickness can be changed.
EMA/SMA switchable
Alert function - One alert can be set for each currency pair and time frame ▲▼, which is very useful.
Perfect Order Alert
You can use it even if you have a free account with only one alert setting.
To use the alert function, go to the Tradingview default alert settings, select “USDJPY/BTCUSD/XAUUSD” for the top item of conditions, and select “Call Alert() function” in the frame just below it!
_* Supplementary explanation: ____________
Please note that due to the limitation of the script, only 3 currency pairs and 4 time frames are displayed with 12 items (Panels for currency pairs other than USDJPY/BTCUSD/XAUUSD are also created, but they are indicators for other scripts, so if you are interested in other currency pairs, please use those. If you are interested in other currency pairs, please use them.)
Please note that we may change the functions or delete the indicator itself without prior notice.
Translated with DeepL.com (free version)
Reference image of the setting screenReference image of the setting screen
設定画面参考画像
3本の移動平均線のパーフェクトオーダーを検知し、時間足ごとに上昇トレンドか下降トレンドかノントレンドかを視覚的にわかりやすくPanelに表示するインジゲーターです。
このインジゲーターは、USDJPY/BTCUSD/XAUUSDの3通貨ペアの5分足、15分足、1時間足、4時間足のパーフェクトオーダーを検知して、チャートに表示されるPanelに、上昇は「▲」下降は「▼」ノントレンドは「ー」と、すぐに判断できる表示にしてあります。
パーフェクトオーダーを逃さずチェックできるように、それぞれの時間足や通貨ペアも全てを通知してくれるアラート設定が可能なのも特徴です。
機能紹介
・USDJPY/BTCUSD/XAUUSDの4H,1H,15M,5M,の上昇(▲),下降(▼),その他(-),をパネルに表示
※(デフォルトでは20EMA,75EMA,200EMAの3本で非表示にしてあります)
・パネルの表示位置設定(左上、上、右上、左下、下、右下、から選択できます。)
・パネルの色とテキスト色変更機能
・移動平均線表示非表示機能(デフォルトでは表示OFFにしてあります。)
・移動平均線期間変更
・移動平均線色と太さ変更
・EMA/SMA切り替え可能
・アラート機能ー1つのアラート設定で通貨ペアと時間足▲▼一つ一つを細かく教えてくれるので便利。
※パーフェクト オーダーアラート
無料アカウントで1つしかアラート設定できなくても使えます。
アラート機能はTradingviewデフォルトのアラート設定から、条件の一番上の項目を「USDJPY/BTCUSD/XAUUSD」選択、そのすぐ下の枠に「Alert()関数の呼び出し」を選択でOK!
_※ 補足説明____________
・スクリプトの制限の為、3通貨ペアと4つの時間足の12項目で表示させていますのでご了承ください
(USDJPY/BTCUSD/XAUUSD以外の通貨ペアのPanelも作成していますが別スクリプトのインジゲーターになりますので他の通貨ペアも興味がある方はそちらをお使いください)
・予告なしで機能の変更やインジゲーター自体の削除等行う事もあるかもなのでご了承ください。
Heiken Ashi Ribbon [UkutaLabs]█ OVERVIEW
The Heiken Ashi Ribbon is a powerful trading tool that creates a strong ribbon that indicates market strength. This ribbon is created using four moving averages that use Heiken Ashi values (high, low, open and close) as its input values.
The ribbon will also be colored green, red or grey depending on whether or not its direction aligns with current market strength.
█ USAGE
The Heiken Ashi Ribbon is created using a series of four moving averages that uses values from the Heiken Ashi bars as its inputs. The user has the ability to select whether the moving averages are EMAs or SMAs, as well as the ability to control the period of the moving averages.
If the moving average calculated using the Heiken Ashi Open is below the moving average calculated using the Heiken Ashi Close, the ribbon will be colored green, indicating a bullish trend. If the moving average calculated using the Heiken Ashi Open is above the moving average calculated using the Heiken Ashi Open, the ribbon will be colored red, indicating a bearish trend.
This indicator also uses a series of hidden EMAs to determine market strength. If these EMAs do not align with the direction of the Heiken Ashi Ribbon, the Ribbon will instead be colored grey, indicating uncertainty in the market, as well as a possible reversal.
█ SETTINGS
Configuration
• Moving Average Type: Determines whether or not the Heiken Ashi Moving Averages will be drawn as EMAs or SMAs.
• Moving Average Period: Determines the period of the Heiken Ashi Moving Averages.
Moving Average
• Moving Average Input: Determines the input values for the hidden EMAs.

Filtered MACD with Backtest [UAlgo]The "Filtered MACD with Backtest " indicator is an advanced trading tool designed for the TradingView platform. It combines the Moving Average Convergence Divergence (MACD) with additional filters such as Moving Average (MA) and Average Directional Index (ADX) to enhance trading signals. This indicator aims to provide more reliable entry and exit points by filtering out noise and confirming trends. Additionally, it includes a comprehensive backtesting module to simulate trading strategies and assess their performance based on historical data. The visual backtest module allows traders to see potential trades directly on the chart, making it easier to evaluate the effectiveness of the strategy.
🔶 Customizable Parameters :
Price Source Selection: Users can choose their preferred price source for calculations, providing flexibility in analysis.
Filter Parameters:
MA Filter: Option to use a Moving Average filter with types such as EMA, SMA, WMA, RMA, and VWMA, and a customizable length.
ADX Filter: Option to use an ADX filter with adjustable length and threshold to determine trend strength.
MACD Parameters: Customizable fast length, slow length, and signal smoothing for the MACD indicator.
Backtest Module:
Entry Type: Supports "Buy and Sell", "Buy", and "Sell" strategies.
Stop Loss Types: Choose from ATR-based, fixed point, or X bar high/low stop loss methods.
Reward to Risk Ratio: Set the desired take profit level relative to the stop loss.
Backtest Visuals: Display entry, stop loss, and take profit levels directly on the chart with
colored backgrounds.
Alerts: Configurable alerts for buy and sell signals.
🔶 Filtered MACD : Understanding How Filters Work with ADX and MA
ADX Filter:
The Average Directional Index (ADX) measures the strength of a trend. The script calculates ADX using the user-defined length and applies a threshold value.
Trading Signals with ADX Filter:
Buy Signal: A regular MACD buy signal (crossover of MACD line above the signal line) is only considered valid if the ADX is above the set threshold. This suggests a stronger uptrend to potentially capitalize on.
Sell Signal: Conversely, a regular MACD sell signal (crossunder of MACD line below the signal line) is only considered valid if the ADX is above the threshold, indicating a stronger downtrend for potential shorting opportunities.
Benefits: The ADX filter helps avoid whipsaws or false signals that might occur during choppy market conditions with weak trends.
MA Filter:
You can choose from various Moving Average (MA) types (EMA, SMA, WMA, RMA, VWMA) for the filter. The script calculates the chosen MA based on the user-defined length.
Trading Signals with MA Filter:
Buy Signal: A regular MACD buy signal is only considered valid if the closing price is above the MA value. This suggests a potential uptrend confirmed by the price action staying above the moving average.
Sell Signal: Conversely, a regular MACD sell signal is only considered valid if the closing price is below the MA value. This suggests a potential downtrend confirmed by the price action staying below the moving average.
Benefits: The MA filter helps identify potential trend continuation opportunities by ensuring the price aligns with the chosen moving average direction.
Combining Filters:
You can choose to use either the ADX filter, the MA filter, or both depending on your strategy preference. Using both filters adds an extra layer of confirmation for your signals.
🔶 Backtesting Module
The backtesting module in this script allows you to visually assess how the filtered MACD strategy would have performed on historical data. Here's a deeper dive into its features:
Backtesting Type: You can choose to backtest for buy signals only, sell signals only, or both. This allows you to analyze the strategy's effectiveness in different market conditions.
Stop-Loss Types: You can define how stop-loss orders are placed:
ATR (Average True Range): This uses a volatility measure (ATR) multiplied by a user-defined factor to set the stop-loss level.
Fixed Point: This allows you to specify a fixed dollar amount or percentage value as the stop-loss.
X bar High/Low: This sets the stop-loss at a certain number of bars (defined by the user) above/below the bar's high (for long positions) or low (for short positions).
Reward-to-Risk Ratio: Define the desired ratio between your potential profit and potential loss on each trade. The backtesting module will calculate take-profit levels based on this ratio and the stop-loss placement.
🔶 Disclaimer:
Use with Caution: This indicator is provided for educational and informational purposes only and should not be considered as financial advice. Users should exercise caution and perform their own analysis before making trading decisions based on the indicator's signals.
Not Financial Advice: The information provided by this indicator does not constitute financial advice, and the creator (UAlgo) shall not be held responsible for any trading losses incurred as a result of using this indicator.
Backtesting Recommended: Traders are encouraged to backtest the indicator thoroughly on historical data before using it in live trading to assess its performance and suitability for their trading strategies.
Risk Management: Trading involves inherent risks, and users should implement proper risk management strategies, including but not limited to stop-loss orders and position sizing, to mitigate potential losses.
No Guarantees: The accuracy and reliability of the indicator's signals cannot be guaranteed, as they are based on historical price data and past performance may not be indicative of future results.

Exponential Smoothing FilterThe digital exponential filter, in finance known as Exponential Moving Average (EMA) , can be used as a technical indicator for chart analysis to visualize uptrends and downtrends in the market. Unlike the classic simple moving average, the EMA requires only two values for its calculation: the last calculated exponential average price and the current price. This is a simple and fast calculation - even for wide smoothing windows. For further details and the math please refer to the "exponential smoothing" article on Wikipedia.
Here are some additional key points about the exponential moving average:
The EMA can react more quickly to price changes because it can give more weight to current prices - depending on your parameter settings.
Short-term, disruptive price fluctuations are smoothed out well, making prevailing trends more visible.
Despite good smoothing properties, it delays the input values slightly, so it can follow sudden trend changes well.
The EMA is well suited to dynamic markets and trading strategies.
The filter is a good basis for further processing such as gradient analysis.
How to use
When you add the script to your charts, you'll immediately see a thin orange line across your time series, smoothing out price fluctuations.
There are only two parameters to set
smoothing factor between 0.0000 = no smoothing and 0.9999 = strong smoothing
input source : open, high, low, close hl2, etc.
Chart output
In the example chart above, you can see that the orange line follows the highs and lows better than the blue line , which is a simple moving average (SMA).
Additionally, the orange line has a shorter lag, or reacts faster when the trend of the original price data suddenly changes. These characteristics are critical for buying and selling decisions: quickly reacting and tracking highs and lows while providing a smooth line that filters out distracting noise.