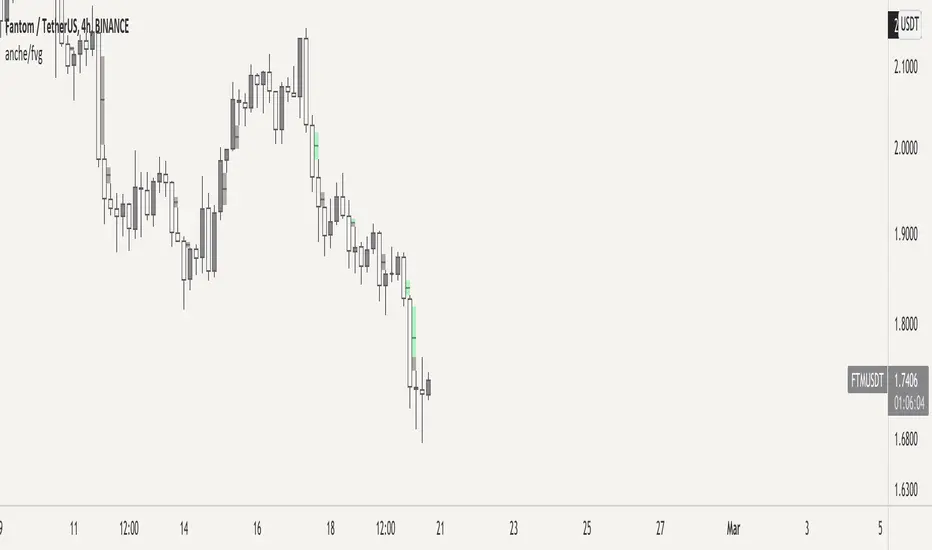
Fair Value Gap by AncheIndicator that plots boxes for fair value gaps (also known as imbalances or inefficiencies)
fair value gaps are a very useful concept in price action trading, as they provide a trader with information about where a lot of orders were injected creating this inefficiency in the market. This inefficiency can become a magnet for price in the future to resolve this inefficiency as there are many resting orders. A trader can use this information to target a fair value gap, or to look for a potential entry for a long/short making it a good POI.
you have the possible to extend boxes to the right of the screen or to edit their width
fair value gaps tend to get mitigated, to restore the balance. This indicator gives you the option to define a mitigation using a full fill or a 0.5 fill. You can also define what to use for mitigation: candle bodies or candle wicks.
there are some other indicators for fair value gaps, although I haven't found one that let's me define a 0.5 mitigation, this indicator suits my trading style
Komut dosyalarını "fvg" için ara
MarketReader_StrategyMarketReader_Strategy is a very useful and advanced indicator:
- It draws buying (green) and selling (orange) zone .
-Once the buying or selling zone is tapped, the color is automatically changed to grey
-It shows liquidity pool ($$$) engineered by market behaviour
Buying or selling area are determined by an algorithm that combines volume profile, Elliott Wave principles and order flow delivery .
On the above example:
At “1” , you can see that the first buying zone is drawn since January 12
At “2” , the buying zone is tapped on January 18 with a strong bullish reaction.
At “3” and “3’” , you can see that liquidity pool has been created by market maker on both buying and selling side. It is typical of market behavior.
Market maker will take the downside liquidity by targeting the buying zone and then reverse (to the upside) targeting the upside liquidity pool that fuel the pump to the selling zone “4” . This selling zone is reached at “5” with a strong bearish reaction.
“6” represent active buying zone, waiting to be tapped.
To buy or take profit on these areas will depend on market behavior on the way down. Does the market engineer liquidity before? We use 2 complementary indicators helping us to take position on these areas but feel free to experiment with your own.
Usually, I wait price comes to selling or buying zone, then I go on lower timeframe (15 to 30 times lower) searching for divergences and convergences on Momemtum reader (also available on tradingview)
This indicator does not repaint and works on Forex, Crypto, Indices, Commodities and stock.

Fractal Fire Zones/Wave RiderMulti timeframe confluence reader: This indicator plots fractals on any specific timeframe selected, multi time frame ema cross that changes color with the trend, multi timeframe 200ema and a calculation that shows potential turning points with a multi timeframe stochastic oscillator confluence. The fire zones are preferred in a ranging market or for potential scalps while the ema trend is designed to keep you with the main trend in any given session. The accumulation/distribution candles can be used to gauge pull backs for re entry or exits based on time or multiple confirmations.
