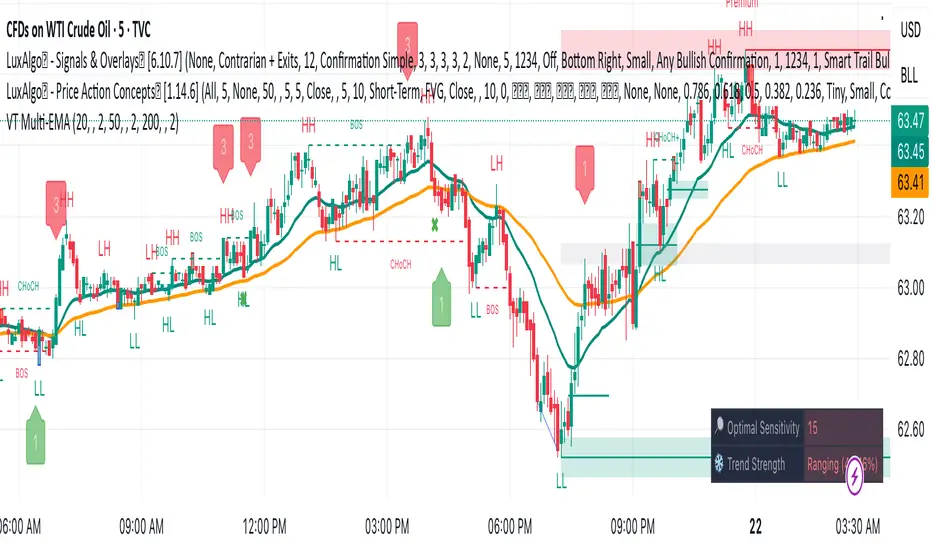
LuxAlgo® - Price Action Concepts™Price Action Concepts™ is a first of it's kind all-in-one indicator toolkit which includes various features specifically based on pure price action.
Order Blocks w/ volume data, real-time market structure (BOS, CHoCH, EQH/L) w/ 'CHoCH+' being a more confirmed reversal signal, a MTF dashboard, Trend Line Liquidity Zones (real-time), Chart Pattern Liquidity Zones, Liquidity Grabs, and much more detailed customization to get an edge trading price action automatically.
Many traders argue that trading price action is better than using technical indicators due to lag, complexity, and noisy charts. Popular ideas within the trading space that cater towards price action trading include "trading like the banks" or "Smart Money Concepts trading" (SMC), most prominently known within the forex community.
What differentiates price action trading from others forms of technical analysis is that it's main focus is on raw price data opposed to creating values or plots derived from price history.
Mostly all of the features within this script are generated purely from price action, more specifically; swing highs, swing lows, and market structure... which allows users to automate their analysis of price action for any market / timeframe.
🔶 FEATURES
This script includes many features based on Price Action; these are highlighted below:
Market structure (BOS, CHoCH, CHoCH+, EQH/L) (Internal & Swing) multi-timeframe
Volumetric Order Blocks & mitigation methods (bullish & bearish)
Liquidity Concepts
Trend Line Liquidity Zones
Chart Pattern Liquidity
Liquidity Grabs Feature
Imbalance Concepts MTF w/ multiple mitigation methods
Fair Value Gaps
Balanced Price Range
Activity Asymmetry
Strong/Weak Highs & Lows w/ volume percentages
Premium & Discount Zones included
Candle Coloring based on market structure
Previous Highs/Lows (Daily, Monday's, Weekly, Monthly, Quarterly)
Multi-Timeframe Dashboard (15m, 1h, 4h, 1d)
Built-in alert conditions & Any Alert() Function Call Conditions
Advanced Alerts Creator to create step-by-step alerts with various conditions
+ more (see changelog below for current features)
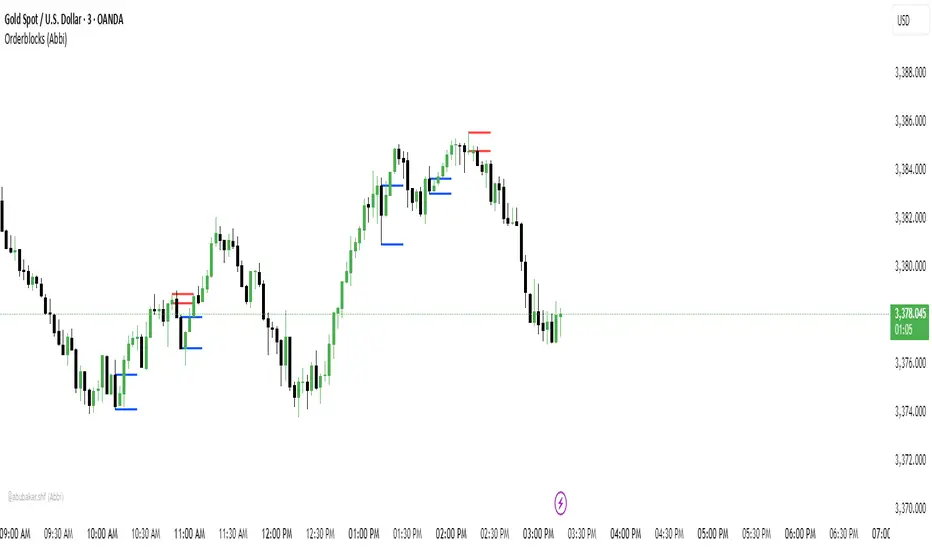
🔶 BASIC DEMONSTRATION
In the image above we can see a demonstration of the market structure labeling within this indicator. The automatic BOS & CHoCH labels on top of dashed lines give clear indications of breakouts & reversals within the internal market structure (short term price action). The "CHoCH+" label is also demonstrated as it triggers only if price has already made a new higher low, or lower high.
We can also see a solid line with a larger BOS label in the middle of the chart. This label demonstrates a break of structure taking into account the swing market structure (longer term price action). All of these labels are generated in real-time.
🔶 USAGE & EXAMPLES
In the image below we can see how a trade setup could be created using Order Blocks w/ volume metrics to find points of interest in the market, swing / internal market structure to get indications of longer & shorter term reversals, and trend line liquidity zones to find more likely impulses & breakouts within trends.
We can see in the next image below that price came down to the highest volume order block marked out previously as our point of interest for an entry used in confluence with the overall market structure being bullish (swing CHoCH). Due to price closing below the middle Order Block at (24.77%), we saw it was mitigated, and then price revisited liquidity above the Trend Line zone above, leading us to the first Order Block as a target.
You will notice the % values adjust as Order Blocks are touched & mitigated, aligning with the correct volume detected when the Order Block was established.
In the image below we can see more features from within Price Action Concepts™ indicator, including Chart Pattern Liquidity, Fair Value Gaps (one of many Imbalance Concepts), Liquidity Grabs, as well as the primary market structures & OBs.
By using multiple features as such, users can develop a greater interpretation of where liquidity rests in the market, which allows them to develop trading plans a lot easier. Liquidity Grabs are highlighted as blue/red boxes on the wicks during specific price action that indicates the market has made an impulse specifically to take out resting buy or sell side orders.
We can notice in the trade demonstrated below (hindsight example) how price often moves to the areas of the most liquidity, even if unexpected according to classical technical analysis performed by retail traders such as chart patterns. Wicks to take out orders above & potentially trap traders are much more noticeable with features such as these.
The Chart Patterns which can be detected include:
Ascending/Descending Wedges (Asc/Desc Wedge)
Ascending/Descending Broadening Wedges (Asc/Desc BW)
Ascending/Descending/Symmetrical Triangles (Asc/Desc/Sym Triangle)
Double Tops/Bottoms (Double Top/Double BTM)
Head & Shoulders (H&S)
Inverted Head & Shoulders (IH&S)
General support & resistance during undetected patterns
In the image below we can see more features from within the indicator, including Balanced Price Range (another imbalance method similar to FVG), Market Structure Candle Coloring, Accumulation & Distribution zones, Premium & Discount zones w/ a percentage on each zone, the MTF dashboard, as well as the Previous Daily Highs & Lows (one of many highs/lows) displayed on the chart automatically.
The colored candles use more specific market structure analysis, specifically allowing users to visualize when trends are considered "normal" or "strong". By utilizing other features alongside this market structure analysis, such as noticing price retesting the PDL level + the Equilibrium as resistance, a Balanced Price Range below price, the discount with a high 72% metric, and the MTF dashboard displaying an overall bearish structure...
...users can instantly gain a deeper interpretation of price action, make highly confluent trading plans while avoiding classical technical indicators, and use traditional retail trading concepts such as chart patterns / trend lines to their advantage in finding logical areas of liquidity & points of interest in the market.
The image below shows the previous chart zoomed in with 2 liquidity concepts re-enabled & used alongside a new range targeting the same Discount zone.
🔶 SETTINGS
Market Structure Internal: Allows the user to select which internal structures to display (BOS, CHoCH, or None).
Market Structure Swing: Allows the user to select which swing structures to display (BOS, CHoCH, or None).
MTF Scanner: See market structure on various timeframes & how many labels are active consecutively.
Equal Highs & Lows: Displays EQH / EQL labels on chart for detecting equal highs & lows.
Color Candles: Plots candles based on the internal & swing structures from within the indicator on the chart.
Order Blocks Internal: Enables Internal Order Blocks & allows the user to select how many most recent Internal Order Blocks appear on the chart as well as select a color.
Order Blocks Swing: Enables Swing Order Blocks & allows the user to select how many most recent Swing Order Blocks appear on the chart as well as select a color.
Mitigation Method: Allows the user to select how the script mitigates an Order Block (close, wick, or average).
Internal Buy/Sell Activity: Allows the user to display buy/sell activity within Order Blocks & decide their color.
Show Metrics: Allows the user to display volume % metrics within the Order Blocks.
Trend Line Liquidity Zones: Allows the user to display Trend Line Zones on the chart, select the number of Trend Lines visible, & their colors.
Chart Pattern Liquidity: Allows the user to display Chart Patterns on the chart, select the significance of the pattern detection, & their colors.
Liquidity Grabs: Allows the user to display Liquidity Grabs on the chart.
Imbalance Concepts: Allows the user to select the type of imbalances to display on the chart as well as the styling, mitigation method, & timeframe.
Auto FVG Threshold: Filter out non-significant fair value gaps.
Premium/ Discount Zones: Allows the user to display Premium, Discount , and Equilibrium zones on the chart
Accumulation / Distribution: Allows the user to display accumulation & distribution consolidation zones with an optional Consolidation Zig-Zag setting included.
Highs/Lows MTF: Displays previous highs & lows as levels on the chart for the previous Day, Monday, Week, Month, or quarter (3M).
General Styling: Provides styling options for market structure labels, market structure theme, and dashboard customization.
Any Alert() Function Call Conditions: Allows the user to select multiple conditions to use within 1 alert.
🔶 CONCLUSION
Price action trading is a widely respected method for its simplicity & realistic approach to understanding the market itself. Price Action Concepts™ is an extremely comprehensive product that opens the possibilities for any trader to automatically display useful metrics for trading price action with enhanced details in each. While this script is useful, it's critical to understand that past performance is not necessarily indicative of future results and there are many more factors that go into being a profitable trader.
🔶 HOW TO GET ACCESS
You can see the Author's instructions below to get instant access to this indicator & our premium suite.
Komut dosyalarını "fvg" için ara

[astropark] Fair Value GapsDear Followers,
today a new epic tool, the "Fair Value Gap (FVG) Finder" .
Fair Value Gaps are quite important to trade, as they represent both volume and trading unfilled gaps, which most of the time are filled and then price reverse .
This indicator will let you set alerts on when a new FVG is found and when it is filled.
Traded together with Breaker Blocks (BB) and Supply/Demand Order Blocks (OB) , you can easily spot important points where to start a short or a long trade.
Here my Breaker Blocks (BB) and Supply/Demand Order Blocks (OB) indicator
Here below some examples on how to use the indicator.
On Bitcoin
On EURUSD

OB - MentorXOB - MentorX
Advanced OrderBlock Detection with Smart Alerts
🎯 Key Features:
- Smart OrderBlock Detection: Identifies bullish/bearish OrderBlocks using fractal breaks
- Multi-Timeframe Alerts: Get instant notifications on 1m, 3m, 5m, 15m, 30m, 1h, 4h
- Strength Filter: Only alerts on significant OrderBlocks (ATR-based strength)
- Visual Confirmation: Alerts sync perfectly with drawn OrderBlock lines
- Customizable Settings: Adjust line styles, colors, and alert preferences
🔔 Alert System:
How It Works:
- OrderBlock detected → Lines drawn → Alert triggered
- No false signals - only alerts when OrderBlock is visible on chart
- Strength filter prevents noise alerts on weak OrderBlocks
Alert Examples:
🔴 Bearish OrderBlock Created
Timeframe: 15m
High: 1.2345
Low: 1.2300
Strength: 2.45% ATR
🟢 Bullish OrderBlock Created
Timeframe: 1h
High: 1.2400
Low: 1.2350
Strength: 3.20% ATR
⚙️ Setup:
1. Enable "Enable Alerts" in settings
2. Select desired timeframes (1m, 3m, 5m, 15m, 30m, 1h, 4h)
3. Adjust "Minimum OB Strength" (0.1-5.0% ATR)
4. Create TradingView alert with "Any alert() function call"
🎨 Customization:
- Line styles: Solid, Dashed, Dotted
- Colors: Customize bearish/bullish line colors
- Fractal filters: 3-bar or 5-bar fractals
- FVG filtering: Optional Fair Value Gap confirmation
📊 Perfect for:
- Scalping
- Swing trading
- Multi-timeframe analysis
- Professional trading strategies
Perfect for scalping, swing trading, and multi-timeframe analysis!
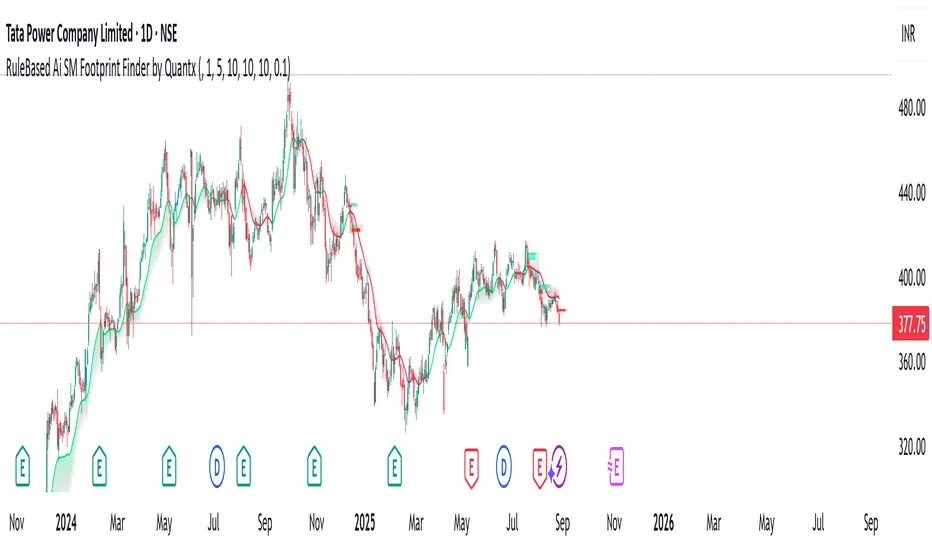
RuleBased Ai SM Footprint Finder by QuantxRuleBased AI SM Footprint Finder by Quantx
Uncover where the Smart Money is entering and exiting the market with precision. The RuleBased AI SM Footprint Finder combines AI-driven logic with institutional Orderblock footprint analysis to reveal hidden liquidity zones, accumulation, and distribution and FVG levels.
✅ Spot Smart Money footprints early
✅ Identify high-probability reversal and Pullback zones
✅ Filter out noise with AI-based confirmation
✅ Works across stocks, indices, and derivatives and Market instruments
Trade with the confidence of knowing where big players are moving their capital.
ICT24 – First FVG + NDOG/NWOG (MNQ1! 1m)This indicator takes into account the information ICT shared in his Mentorship 2024. It marks the FFVG in 3 sessions and considers the NDOGs and NWOGs. In an A setup, it gives a signal.

ICT ZigZag Lines"ZigZag Lines" is a market structure tool that helps traders visualize liquidity zones and key points of interest.
This version provides essential features for understanding institutional order flow concepts and identifying important levels.
Features included:
- Liquidity lines (previous highs/lows, killzones, time zone levels)
- First Fair Value Gap of the day (M1 9:30 –4) - demo
- Macro time (8:50 – 9:10) - demo
- Multi-timeframe SMT (3 correlated assets)
- Engulfing patterns at three levels
- Volume heatmap (high and extra high)
- Three higher timeframes with FVG and imbalance visualization
- Option to add custom chart symbols
Benefits:
Organized market structure in one layout
Consistent and standardized mapping
Fully customizable (style, colors, thickness, labels)
Notice: This is a visualization tool and does not provide trading recommendations. Prior knowledge of ICT concepts is required.

ICT ZigZag Lines PRO"ZigZag Lines Pro" is an advanced indicator for traders who apply institutional order flow and liquidity concepts. It automatically organizes relevant market zones to provide a clear and structured perspective.
Features included:
- All functionalities of ZigZag Lines
- NDOG/NWOG
- GAP RTH
- True Opens (TMSO, TSO, TDO, TWO, TMO, TYO)
- Configurable horizontal and vertical levels
- Five higher timeframes with FVG and imbalance visualization
- Liquidity grab markings on higher timeframes with SMT detection
Benefits:
Consolidated view of levels, gaps, and liquidity
Standardized market mapping for consistent analysis
Complete customization of all visual elements
Notice: This is a visualization tool and does not provide trading recommendations. Prior knowledge of ICT concepts is required.

Same-Direction Candles (Two Symbols)Same-Direction Candles (Two Symbols)
What it does
Highlights bars on your chart when two symbols print the same candle direction on the chosen timeframe:
Both Bullish → one color
Both Bearish → another color
Great for spotting synchronous moves (e.g., NQ & ES, QQQ & SPY), or confirming risk-on/risk-off with an inverse asset (e.g., NQ vs DXY with inversion).
How it works
For each bar, the script checks whether close > open (bullish), close < open (bearish), or equal (doji) for:
The chart’s symbol
A second symbol pulled via request.security() (optionally on a different timeframe)
If both symbols are bullish, it paints Bull color; if both are bearish, it paints Bear color. Dojis can be ignored.
Inputs
Second symbol: Ticker to compare (e.g., CME_MINI:ES1!, NASDAQ:QQQ, TVC:DXY).
Second symbol timeframe: Leave blank to use the chart’s TF, or set a specific one (e.g., 5, 15, D).
Invert second symbol direction?: Flips the second symbol’s candle direction (useful for inversely related assets like DXY vs indices).
Ignore doji candles: Skip highlights when either candle is neutral (open == close).
Coloring options: Toggle bar coloring and/or background shading; pick colors; set background transparency.
Alerts
Three alert conditions:
Both Bullish
Both Bearish
Both Same Direction (bullish or bearish)
Create alerts from the Add Alert dialog after adding the script.
Use cases
Index confluence: NQ & ES moving in lockstep
ETF confirmation: QQQ & SPY agreement
FX/Index risk signals: Invert DXY against NQ/ES to see when equity strength aligns with dollar weakness
Tips
For mixed timeframes (e.g., chart on 1m, ES on 5m), set Second symbol timeframe to the higher TF to reduce noise.
Keep Ignore dojis on for cleaner signals.
Combine with your own entry rules (structure, FVGs, liquidity sweeps).
Notes
Works on any symbol/timeframe supported by TradingView.
Overlay script; no strategy/entries/exits are executed.
Past performance ≠ future results; for education only.
Version: 1.0 – initial release (bar/background highlights, doji filter, inversion, multi-TF support, alerts).

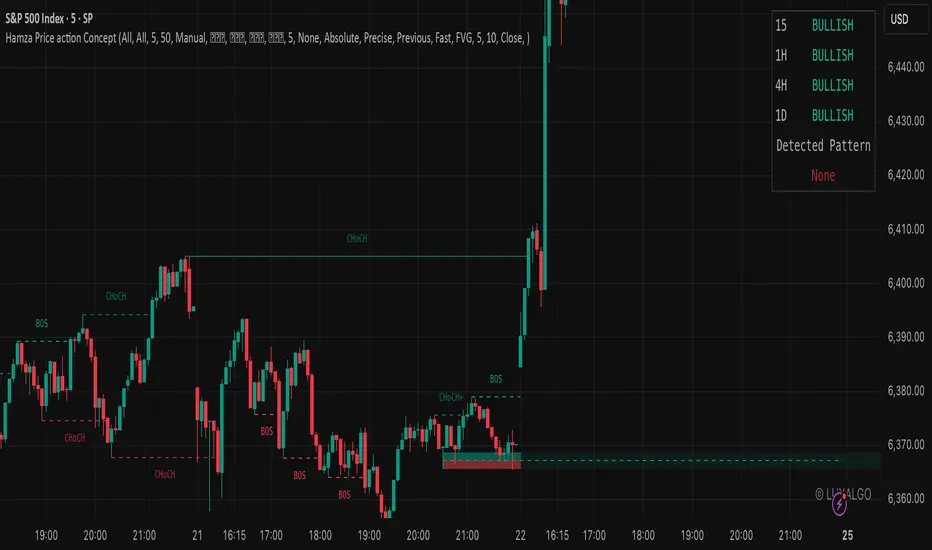
Hamza Price action ConceptsPrice Action Hamza Concepts is a powerful all-in-one tool combining SMC, ICT concepts, and classic price action structure. It automatically detects market structure shifts, order blocks, FVGs, CHoCH, BOS, and premium-discount zones. Ideal for scalping, intraday, swing, and position trading.
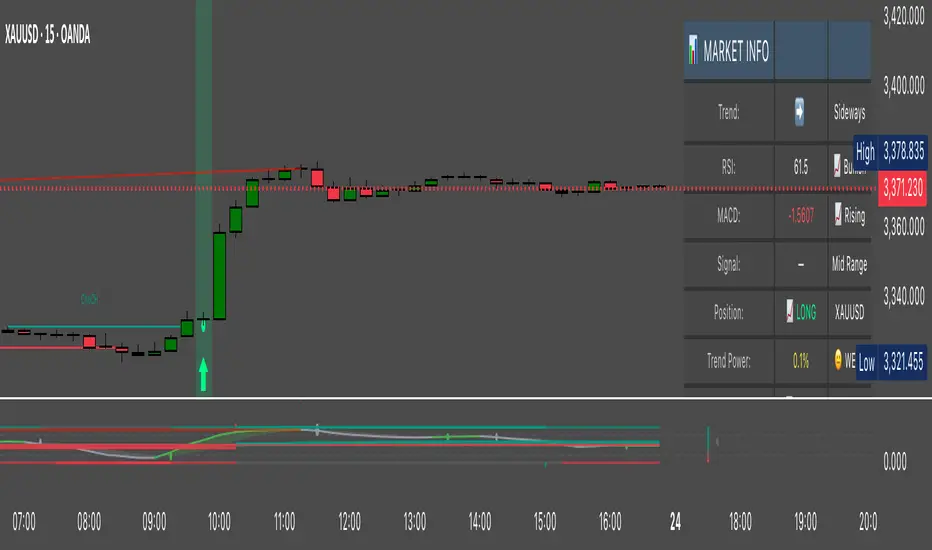
Hassi XAUUSD 15TF BUY/SELL (Anchored, Non-Repainting)What this does
Hassi XAUUSD 15TF BUY/SELL is a non-repainting signal indicator designed for XAUUSD (Gold) on the 15-minute timeframe (also works on BTCUSD). It blends EMA crossover + RSI + MACD with optional volume & volatility filters, and prints anchored BUY/SELL arrows that stay glued to their candle (no visual drifting on zoom/scale/replay). Optional confidence% labels help you judge signal quality at a glance.
Why it’s stable (no repaint)
Signals confirm only on bar close (barstate.isconfirmed).
Arrows/X marks are placed with label.new(x=bar_index, y=high/low, xloc.bar_index, yloc.abovebar/belowbar) so they remain exactly above/below the triggering candle.
No request.security for higher-TF lookaheads; no negative offsets.
How signals are generated
Core trigger: EMA(9) crosses EMA(21)
RSI filter (opt): RSI ≥ RSI Buy Min (default 50) for buys; ≤ RSI Sell Max (default 50) for sells
MACD filter (opt): MACD line crosses its signal or histogram sign matches direction
Volume/ATR filters (opt): require a basic volume spike and above-average ATR volatility (toggleable)
Divergence (opt): lightweight RSI divergence hints (diamond marks)
Anchored markers
BUY: triangle below the signal candle
SELL: triangle above the signal candle
EXIT (❌): small x above (long exit) / below (short exit) when the opposite signal confirms
Nudges: fine-tune vertical placement with tick offsets (inputs) without breaking anchoring
Inputs (defaults)
Fast EMA: 9
Slow EMA: 21
RSI Length: 14
MACD Fast/Slow/Signal: 12 / 26 / 9
Require RSI filter (50 line): ✅
Require MACD cross filter: ✅
RSI Buy Min / RSI Sell Max: 50 / 50
Buy/Sell/Exit Offset (ticks): 0 / 0 / 0
Advanced toggles: Trend Strength ✅, Dynamic Sizing (visual) ✅, Volume Filter ⛔, Volatility Filter ⛔, RSI Divergence ⛔, Show Confidence ✅
Status line/table: ✅
Alerts
Add any of these in Add Alert → Condition: this indicator
Buy Signal → {{ticker}} BUY @ {{close}} - ANCHORED SIGNAL
Sell Signal → {{ticker}} SELL @ {{close}} - ANCHORED SIGNAL
Exit Mark → {{ticker}} EXIT @ {{close}} - ANCHORED EXIT
Recommended use (15-minute XAUUSD)
Use during active sessions (London/NY overlaps).
Keep defaults; enable Volume & Volatility filters in high-noise conditions.
Add confluence (S/R, structure/BOS, session highs/lows, FVG or HTF bias).
Manage risk with structure-based SL or ATR x 1.0–1.5, and partial TP at 1:1–1.5R.
Note: You mentioned it has ~80% win rate on 15TF in your testing. Performance varies by broker feed, session, spread, and risk management. Treat results as educational, not a guarantee.
Non-repainting notes
Signals lock on close; historical arrows are final.
Labels are bar/price anchored (no drift when you zoom or change scale).
Arrays trim old labels automatically to avoid drawing limits.
FAQ
Q: Why don’t past arrows move when I resize the chart?
A: They’re label.new() anchored to bar_index and bar high/low with xloc/yloc, so they stay with the candle.
Q: Can I turn it into a strategy/backtest?
A: Yes—wrap the same signals into strategy.entry/exit, but this release is an indicator by design.
Q: Will it work on BTC or other pairs/timeframes?
A: Yes, but it’s tuned for XAUUSD M15. Adapt filters for other markets.
Changelog
v1.0 — Initial public release: anchored non-repainting arrows, optional RSI/MACD filters, volume/ATR filter, divergence hints, confidence labels, status panel, alerts.
Disclaimer
This tool is for education and analysis only. It is not financial advice. Trading involves risk; do your own research and manage risk responsibly.
ICT Intraday – Sweep + FVG + Displacement (v5). By Momo GOLDStrategy based on ICT concepts: the indicator provides very effective entry and exit points on EURUSD.

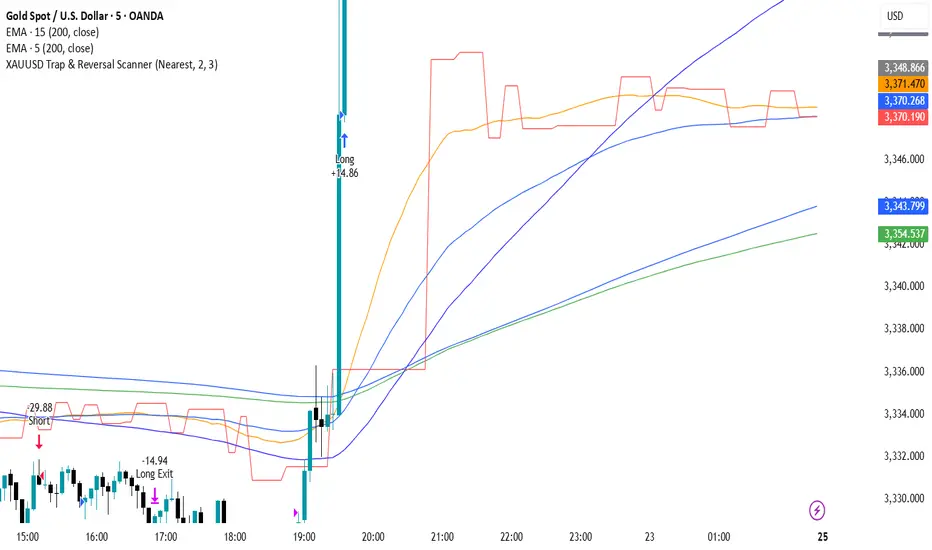
XAUUSD Trap & Reversal ScannerThis strategy is designed for XAUUSD (Gold) on 5m/15m timeframes.
It detects and trades reversal traps confirmed by classic patterns:
Double Tops / Double Bottoms
Head & Shoulders / Inverse H&S
Fair Value Gaps (FVG / IFVG)
Trap Sweeps (stop hunts)
Additional filters:
EMA200 trend confirmation
London & New York trading session filter (12:00–17:00 UTC)
Risk management with ATR-based stop loss
Partial profit-taking (50% at 1:1, remainder at 1:RR up to 1:4)
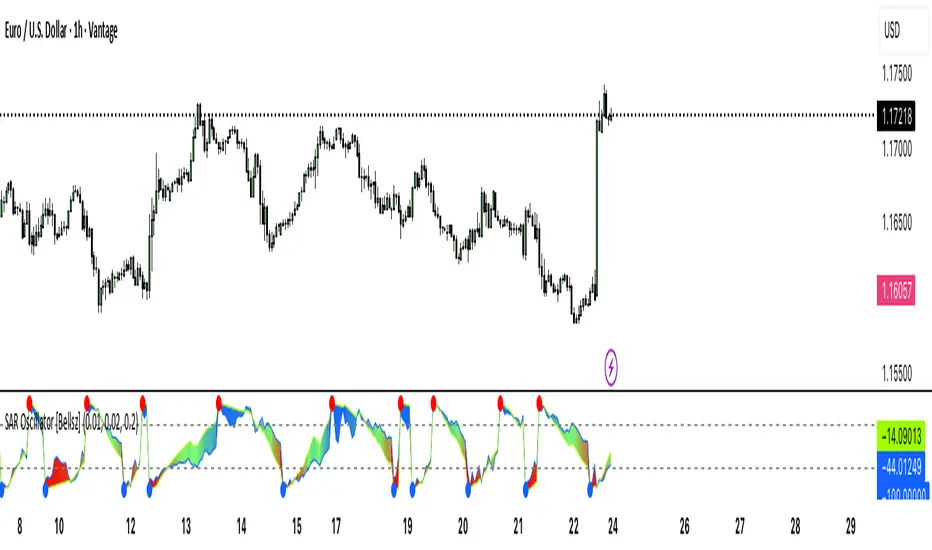
SAR Oscillator [Bellsz]Converts Parabolic SAR into a normalized oscillator with crossover signals, gradient fills, and trend strength levels. A cleaner way to read SAR momentum. Making it easier to read momentum shifts, trend strength, and reversals directly in the sub-chart. Instead of dots on price only, this tool converts SAR dynamics into a smooth oscillator that highlights bias and turning points.
What it shows
Normalized Price Line — scaled view of price relative to SAR.
Normalized SAR Line — SAR value normalized across the high/low range.
SAR Dots — visual cue when crossovers occur (potential reversal or trend acceleration).
Gradient Fill — color-coded background for quick read of momentum direction/intensity.
Guide Levels — ±50 baseline to track trend strength and overextension.
Why use it
Converts SAR into an oscillator format, easier to compare across instruments & timeframes.
Highlights momentum shifts early (crossovers, gradient flips).
Adds structure with gradient fill and baselines, making SAR more actionable than standard dot plots.
Works as a trend bias filter or confirmation tool alongside other indicators.
Inputs
Acceleration / Increment / Maximum — adjust SAR sensitivity.
Custom Colors — choose your scheme for price, SAR, and gradients.
Best practices
Use on intraday or swing TFs as a trend bias filter.
Look for Normalized Price crossing Normalized SAR as potential entry signals.
Watch how SAR dots cluster near ±100 for exhaustion or reversal signals.
Notes
This is a visual enhancement of SAR; it does not repaint.
Combine with volume, FVGs, or session models for added context.
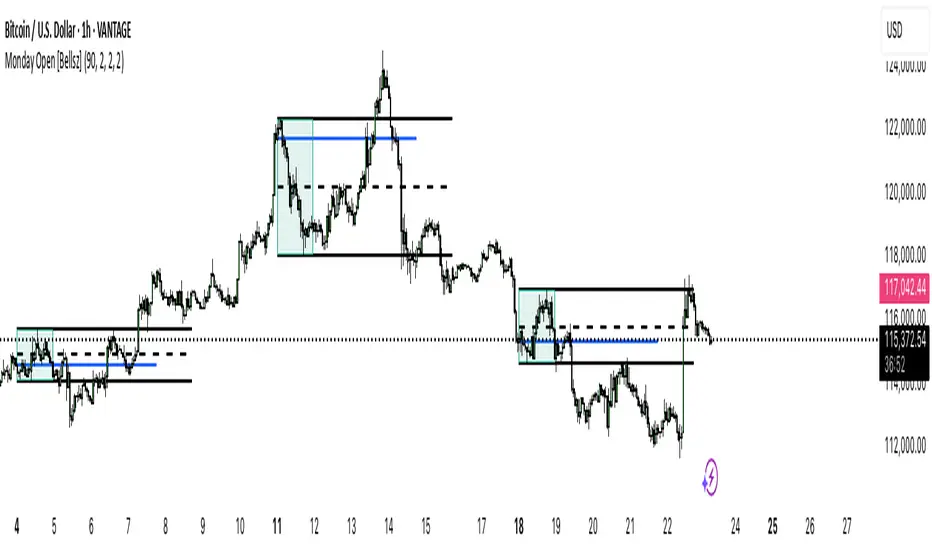
Monday Open [Bellsz]Plots the NY Monday range with box, High/Low, EQ, and Monday Open, then projects those levels forward by N bars. Clean weekly framing for liquidity targets and mean reversion.
Purpose
Maps the full New York Monday (00:00–23:59 NY time) and projects its High, Low, EQ (midpoint), and Monday Open forward. Use it to frame the week’s liquidity map, “magnet” levels, and mean-reversion targets with one glance.
What it draws
Monday Box — live-updating box for the NY Monday session (fill + border).
High/Low (solid lines) — locked at Monday close and optionally extended N bars.
EQ / Midline (dashed) — (High + Low) ÷ 2, extended N bars.
Monday Open (solid line) — projected from Monday’s first bar, extended N bars during Monday (temporary), then replaced by a fixed Monday-Open line at session end.
How it works
Detects NY calendar day without dayofyear and anchors to America/New_York.
Starts tracking at NY Monday 00:00; updates the box/high/low in real time.
When Monday ends, the script freezes the range and plots final H/L/EQ + Open, extending each by your chosen number of bars.
No lookahead; levels are only finalized after Monday completes.
Inputs
Extend lines (bars →) — how far to project H/L/EQ/Open into the future.
Monday Box Fill / Border — style the range box.
High/Low Line Color / Width — style Monday H & L.
EQ Line Color / Width — style midpoint.
Monday Open Color / Width — style the Monday open.
Why use this indicator
Weekly bias framing: Monday’s range often acts as the reference box for the week’s expansion.
Liquidity targeting: Equal highs/lows and EQ act as common magnet/rebalance areas.
Confluence: Combine with sessions/killzones, FVGs, order blocks, or news timing.
Best practices
Keep chart on your normal trading TF (M5–H1 for intraday, H4–D for swing).
Watch EQ taps and previous Monday H/L sweeps Tuesday–Friday.
Pair the projection length with your strategy’s average holding horizon.
Notes & limitations
All timing is NY session-based (America/New_York). If your symbol trades Sunday evening (futures/FX), Monday begins at 00:00 NY as coded.
Market holidays that shift liquidity can affect the “feel” of Monday’s range.
Works on any symbol/TF supported by TradingView. No repainting after Monday close.
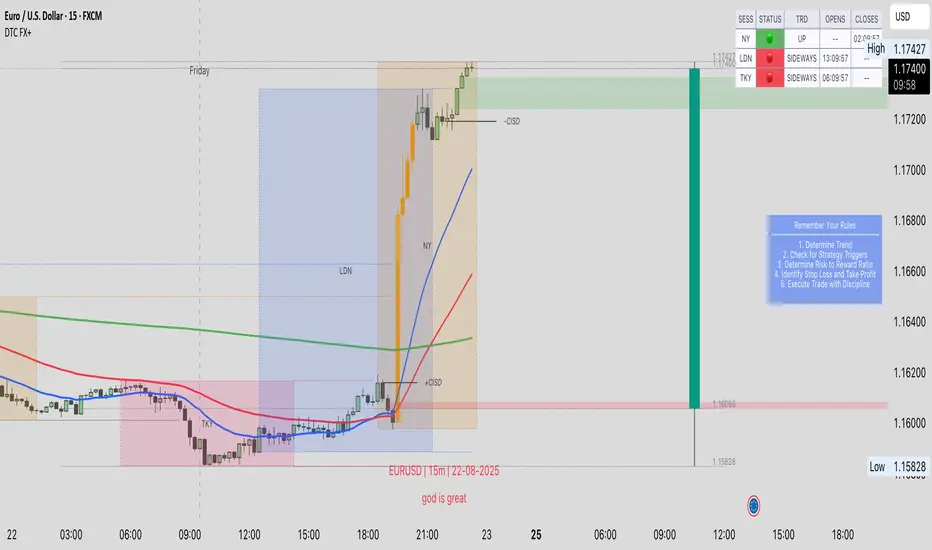
DTC FX+DTC FX+
All in One Indicator for Forex Markets
A comprehensive FX session indicator designed to help traders identify and analyze different trading sessions throughout the day.
This indicator provides real-time detection of major FX trading sessions including New York, London, and Tokyo sessions. It displays session ranges, highs and lows, and includes volume analysis to help identify periods of increased market activity.
Key features include:
• Real-time FX Session Detection (NY, London, Tokyo)
• Live Daily Candle Overlay with OHLC tracking
• Volume Bars for Strong Volume Detection
• Session Trend Detection
• Dynamic Session Status Tables
• Daily Dividers and Session Box Visualization
• Custom Trading Rules Display
• Watermark System
• Moving Averages (EMA, WMA, SMA)
• Fair Value Gaps (FVG) Detection
• Support & Resistance Levels (CISD)
• Gap Violations Analysis
• Session-specific Volume Analysis
• Customizable Session Times and Colors
• Theme-aware Display Options
• Multiple Watermark Styles
• Session Range and Extremes Display
• Professional Session Dashboard
The session dashboard provides a clear overview of current market conditions, while customizable trading rules can be displayed directly on the chart. Session boxes and dividers help visualize different trading periods, making it easier to understand market structure across different time zones.
All session times, colors, and display options are fully customizable to match your trading preferences. The indicator works across multiple timeframes and includes theme-aware display options for both light and dark chart themes.
Whether you're a day trader looking for session-based opportunities or a swing trader analyzing market structure, this indicator provides the tools needed to better understand FX market dynamics across different trading sessions.
EMA PRO (2–3 optional, VIPIN MTF + Alerts)This indicator plots up to 3 customizable EMAs with multi-timeframe support and alerts.
Features:
• Up to 3 EMAs (fully optional – show/hide individually)
• Custom length, timeframe, color, and line width for each EMA
• EMA1–EMA2 cloud fill with trend bias coloring
• Optional bar coloring based on EMA1 vs EMA2
• Alerts included for:
– Price crossing above/below EMA1
– EMA1 crossing above/below EMA2
How to Use:
• Scalping (1m–5m): EMA20 + EMA50, EMA200 for higher trend
• Intraday (15m–1H): EMA21 + EMA50 + EMA200
• Swing (4H–1D): EMA50 + EMA200
• Cloud turns green = bullish bias, red = bearish bias
• Use confluence with structure (BOS, CHoCH, OB/FVG) for best entries
⚠️ Disclaimer: This script is for educational and informational purposes only.
It is not financial advice. Always do your own research and practice proper risk management before trading.
Shelf FVG Alert Multi TF 3 [FINAL]shelf best i have ever seen it. thats pattern shows zones where we can see impuls

SMC Yardımcısı - TR (Optimize v2.1)BOS (Break of Structure)
Labels when price closes above/below a previous swing high/low.
Shows continuation of the current trend.
CHOCH (Change of Character)
Appears when trend direction shifts (from bullish to bearish or vice versa).
Marks possible market reversals.
FVG (Fair Value Gap)
Highlights price imbalance zones (3-candle gaps).
These are often areas where price later returns to “fill” liquidity.
OTE (Optimal Trade Entry, 62–79% retracement)
Uses the last swing high and swing low.
Draws the Fibonacci retracement zone (62–79%), considered a common institutional entry area.
BSL (Buy Side Liquidity – Equal Highs)
Detects equal highs and plots them as liquidity pools.
Shows where buy-side liquidity/stop hunts may occur.
SSL (Sell Side Liquidity – Equal Lows)
Detects equal lows and plots them.
Indicates sell-side liquidity levels.
Inducement / Liquidity Sweep
If price wicks above BSL or below SSL but closes back inside, a “sweep” label is shown.BOS (Break of Structure – Yapı Kırılımı)

PreviousDayHLEQCME_MINI:NQ1!
Indicator Overview: The "PreviousDayHLEQ" indicator is an essential tool for traders employing Inner Circle Trader (ICT) methodologies, designed to plot the High (H), Low (L), Equilibrium (EQ, the midpoint between high and low), and Optimal Trade Entry (OTE) levels at 61.8%, 70%, and 79% of the previous trading day's range. It provides a clear visual reference for potential support, resistance, and entry zones based on the prior day's price action, helping traders anticipate continuations or reversals in the current day. This indicator stands out by incorporating directional OTE auto-detection, adjusting levels based on whether the previous day formed a new high or low relative to the day before, offering insights into market bias without manual recalculation.
Core Functionality: It tracks and displays the previous day's high and low, calculating the EQ as the average for balance points, and OTE levels as percentage retracements of the range. The script uses a user-defined trading day definition (with timezone support) to accurately capture the day's extremes, ensuring alignment with global market sessions. This core setup allows traders to quickly identify key ICT levels like fair value gaps or liquidity pools from the prior day.
Unique OTE Auto Detection: One of the indicator's most innovative features is its automatic detection of OTE direction. If the previous day made a new high compared to the day before, OTE levels are calculated downward from the high to the low (bearish bias), highlighting potential short entries. Conversely, a new low triggers upward OTE levels from the low to the high (bullish bias), signaling long opportunities. This auto-detection is unique, as it dynamically adapts to historical price expansion without user input, a capability not found in standard previous day indicators that typically use fixed directions. It empowers ICT traders to gauge carry-over momentum from the prior day, such as in scenarios where a bullish expansion suggests buying dips to the 61.8% level.
Directional Bias Indication: Beyond plotting levels, the OTE calculation inherently indicates the previous day's bias (expansion upward or downward), providing context for current day trades. This unique bias detection helps traders align with market structure, e.g., favoring shorts if OTE is downward-oriented, enhancing decision-making in ICT frameworks like order block identification.
Left-Side Trimming Innovation: The indicator includes a highly unique left-side trimming option, allowing users to restrict the historical extension of lines to a specified number of bars (e.g., the last 8 bars). This reduces visual clutter on charts with long history, focusing attention on recent and relevant price action—a feature rarely seen in previous day indicators, where lines often span the entire chart and obscure current developments. Traders can toggle trimming on/off and adjust the bar count, making it ideal for clean, professional setups.
Customization and Visual Controls: Users can fully customize line colors (separate for high, low, EQ, and each OTE level), styles (solid, dashed, dotted), and label properties (text color, background color, transparency, size). This level of granularity ensures the indicator fits any chart theme or strategy, with options to enable/disable individual elements like EQ or OTE for minimalistic views. The stick-right label option keeps labels visible as the chart updates, preventing overlap.
Auto-Deletion at Trading Day End: Levels can be automatically cleared at the indicator's calculated market close (17:00 NY time), a unique feature that prevents accumulation of outdated data, keeping the chart fresh for the next day. This is particularly useful for day traders who reset their setups daily.
No External Dependencies: The indicator operates solely on chart price data using built-in Pine Script functions, ensuring reliability and compatibility without needing additional libraries or internet access.
How It Works
Previous Day Data Capture: The script identifies the previous trading day using the user-defined timezone and calculates high, low, EQ, and OTE levels based on that day's range.
OTE Calculation: Levels are computed as percentages of the range, with auto-detection switching direction if a new high/low was made relative to the day before.
Drawing and Trimming: Lines are plotted with user-set padding for extension, and trimming cuts the left side to focus on current action.
Update Mechanism: Levels update in real-time as the previous day's data is fixed, but the script refreshes on chart reloads or new days.
Deletion Logic: At market close, if auto-delete is enabled, all elements are removed to prepare for the next cycle.
Uniqueness and Innovation
Session OTE Auto Detection: Automatically determines OTE direction based on previous day's high/low expansion, a rare feature that provides bias insights not available in basic previous day high/low indicators, aiding ICT traders in identifying entry zones with market context.
Left-Side Trimming: This innovation allows customizable historical line length, solving chart clutter issues unique to previous day indicators that typically show full history, enhancing usability for live trading.
Directional OTE with Multi-Level Support: Combines auto-bias detection with three OTE percentages (61.8%, 70%, 79%), offering more granular entry options than single-level tools, tailored for ICT's focus on range retracements.
Independent Customization per Element: Separate controls for high, low, EQ, and OTE colors/styles, plus transparency and size, provide unmatched flexibility compared to rigid indicators.
Auto-Deletion for Cleanliness: Unique cleanup at market close prevents level buildup, a practical feature for multi-day analysis not commonly implemented in similar tools.
How to Use It
Setup: Add to chart, configure timezone (e.g., "America/New_York"), and enable the indicator.
Customization: Adjust line colors (e.g., blue for high), styles (dashed for OTE), and enable trimming (8 bars for focus).
Interpretation: Use OTE for entries (e.g., buy at 61.8% in bullish bias); EQ for reversion.
Tips: Test on historical data; combine with ICT concepts like CISD, FVG etc.
This indicator elevates ICT trading with its auto-detection and trimming. Use with risk management; trading carries risk

HTF POC with Zones & AlertsPlots a Point of Control (POC) per candle from a timeframe you choose (MTF). Because TradingView doesn’t expose true footprint data, the POC here is a proxy (choose: Body Mid, Range Mid, or Typical Price HLC3). The script draws the POC line and an optional POC zone (±% of that candle’s range), then alerts when price retests the zone (wick touches count).
Use it to:
Mark key levels inside candles that often act as magnets or reaction zones
Track retests of strong bars (imbalance) across higher timeframes
Add clean confluence with S/R, FVGs, or trend tools
Features: Selectable TF, zone width, extend lines/zones, historical caps, alerts, and info panel.
Note: This is an estimate of POC from OHLC, not real bid/ask volume. Use as context, not a standalone signal.

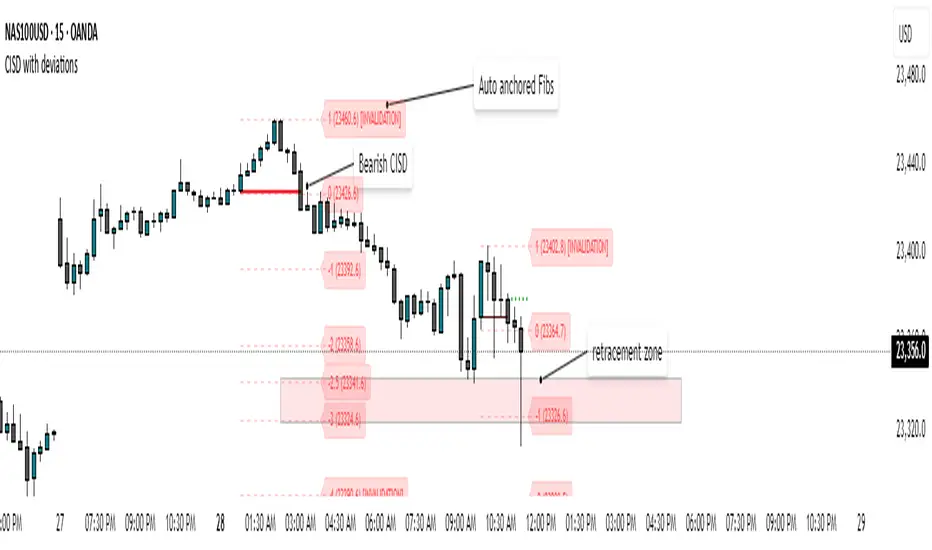
CISD with deviationsChange in State Delivery (CISD) is a well-recognized concept and serves as a key signal for identifying market direction through the behavior of CISD levels. In this approach, CISD is applied as the core measure of market structure, removing the variability that comes from user-defined interpretations.
How does it works :
Identifies CISD levels as the market delivers price.
Track whether price respects or violates these levels.
A confirmed shift (change in state) signals a potential transition in trend
Provides a clean structure map to guide execution
How to use it :
1)Align CISD shifts with your higher timeframe bias and the deviation levels marked by the indicator which often serve as the area for retracement or continuations.
2) Use CISD confirmation as a filter for trade entries.
3) Combine with liquidity pools, FVGs, or session timing for added confluence.
Features covered :
1) Automatic Bearish and Bullish CISD plotting.
2) Anchored Fibonacci levels are plotted based on the confirmed CISD. The Fibonacci levels are fixed and cannot be modified by the user because these levels serve a purpose.
3) Alerts can be set up by the users for whenever a bearish/bullish CISD is confirmed.
4) Automatic invalidations are set so that when price invalidates a CISD or hits the -4 level of a CISD as full target level, the CISD is automatically removed.
5) Currently , the maximum CISDs visible are limited to 3 each (bullish and bearish) to avoid cluttering on the chart.
Volume Imbalance Analyzer - 70% & 80% Version1.01Here’s a clean “definition” you can drop into your docs. It explains **what** the indicator is, **what it helps with**, and **how** to use it—plain and practical.
# Definition
**Volume Imbalance Analyzer (70% & 80%)** flags bars where estimated buy vs. sell volume is heavily one-sided. It colors those bars, adds labels (B70/B80 or S70/S80), and can alert you in real time. The goal is to quickly spot spots of **aggressive participation** (buyers or sellers) that often act as magnets for a **retest** or as **exhaustion/continuation** areas.
# What it helps you do
* **Find high-energy bars** where one side dominates (potential turning or continuation points).
* **Plan retests:** Track when price comes back into the imbalance candle’s range (common entry/take-profit logic).
* **Filter trades:** Only act when the market shows unusual pressure (≥70% or ≥80%).
* **Add context to setups:** Combine with S/R, FVGs, or trend tools to time entries with less guesswork.
* **Alert-driven workflow:** Get notified the moment extreme pressure prints.
# How it helps (workflow)
1. **Scan for signals:**
* **B80/B70** = strong buying; **S80/S70** = strong selling.
* 80% is “extreme” and overrides 70%.
2. **Mark the zone:** The imbalance candle’s **high–low** defines a zone. Many traders wait for a **retest** into that range.
3. **Decide intent:**
* After **B80/B70**, look for pullbacks to buy (or fades if you see exhaustion).
* After **S80/S70**, look for rallies to sell (or fades if exhaustion).
4. **Confirm with context:** Check trend, key levels, liquidity, session timing, ATR/volatility.
5. **Manage risk:** Place stops beyond the zone; size trades so a failed retest doesn’t ruin the day.
# How it works (under the hood, briefly)
The script **estimates buy/sell volume** from each candle’s body, wicks, and total volume, then computes an **imbalance %**. If the % crosses **70%** or **80%** (scaled by a Sensitivity setting), it paints the bar, drops a label, and optionally fires an alert. It also stores the imbalance candle’s range so you can watch for a **retest**.
# Reading the signals (quick guide)
* **B80**: Extreme buyer pressure → watch for pullback buys or exhaustion shorts, depending on context.
* **B70**: Strong buyer pressure → mild continuation bias.
* **S80**: Extreme seller pressure → watch for rally sells or exhaustion longs.
* **S70**: Strong seller pressure → higher reversal probability noted in the table (informational).
# Configuration tips
* **Sensitivity**: Higher = more bars qualify (more signals).
* **Label distance**: Scales with ATR so labels don’t overlap candles.
* **Colors/opacity**: Separate for 70% vs 80% and buyer vs seller.
* **Alerts**: Enable to catch signals live without staring at the screen.
# Notes & limits
* Uses **estimation** (not true bid/ask) on most symbols; treat as a **context tool**, not a stand-alone system.
* The optional stats table’s “expected outcomes” are **informational**, not live probabilities.
* Works on any timeframe; results improve when combined with structure and risk controls.
