Fair Value Gap Suite Adrian V1.0.0Brief description
The “FVG Suite” identifies fair value gaps across multiple time units, evaluates them with a displacement score, optionally filters them according to market structure events (BOS/CHOCH), and provides context-based alerts for first touch, partial and full fills, and invalidation. The aim is to show only high-quality imbalances and trade them based on rules.
What makes the script unique (originality/added value)
Displacement score: Strength of the impulse movement as a combination of (body/ATR, range/ATR, volume Z-score).
MTF aggregator: FVGs from higher timeframes are collected, ranked, and displayed as zones on the active chart (including overlap clustering).
Structure context: Optionally, only FVGs after confirmed BOS/CHOCH in the trend direction, including premium/discount evaluation relative to the HTF range.
Adaptive invalidation: FVG expires after candles, opposing BOS or defined time (e.g., end of session).
Session/instrument filter: Time window (e.g., NY/LDN), minimum tick size, ATR-based minimum gap.
Smart fill logic: Distinguishes between first touch, partial fill (≥ %), full fill (100%); alarms per event.
Statistics overlay (optional): Hit rate/expectancy per TF & session for fine-tuning the filters.
How it works (conceptually)
FVG definition (3-candle pattern): Bullish if High < Low (bearish analog). Size = gap span in points.
Quality score:Score = w1*(|Body|/ATR) + w2*(Range/ATR) + w3*(Volume-Z), normalized to 0–100.
MTF scan: List of higher TFs: (customizable). Findings are merged, ranked, and displayed as zones with priority (color/opacity).
Context filter: Only FVGs that emerge after BOS/CHOCH in the direction of the current trend; optional exclusion in premium/discount areas.
Invalidation & alerts: A zone is considered active until the invalidation rule takes effect. Alerts are triggered upon: initial contact, partial/full filling, invalidation.
Important inputs
Min. FVG size: × ATRor ticks/points
Min. displacement score: (0–100)
MTF list:
BOS/CHOCH filter: On/Off (Lookback candles)
Session filter: NY/LDN/Asia (local time, weekend toggle)
Invalidation: maxBars = , Opposite BOS = On/Off, Session End = On/Off
Fill definitions: Partial fill ≥ % of the gap; Full fill = 100%
Overlay options: Zone color/transparency, HTF label, statistics overlay On/Off
Alerts (names & triggers)
FVG Suite – First Touch: Price touches an active FVG zone for the first time.
FVG Suite – Partial Fill: Partial fill ≥ configured threshold.
FVG Suite – Full Fill: Gap completely filled.
FVG Suite – Invalidated: Zone invalidated by rules. (Alert message contains: symbol, TF of the zone, direction, score, size, trigger rule.)
Use (best practices)
Trade in the trend direction with BOS/CHOCH filter; target counter-imbalances/liquidity pools.
Use session filters to avoid news spikes/illiquid periods.
Calibrate parameters for each market/TF (ATR/volume profiles differ).
Limitations
Structure labels can be reevaluated for new highs/lows (repainting of labels, not of FVG finds).
Spreads/news can generate “pseudo fills.”
Backtests/statistics are sample-dependent; no guarantee of results.
Changelog
v1.0 – First release (score model, MTF aggregator, BOS/CHOCH filter, fill alerts).
Credits
FVG concept: public ICT/SMC literature (general idea). Implementation/scoring, MTF ranking, smart fill logic: own development.
Note/disclaimer
No financial advice. For educational purposes only. Trading involves high risk; use stop losses and a fixed risk budget.
"fvg" için komut dosyalarını ara
Fair Value Gap Suite Adrian V1.0.0Brief description
The “FVG Suite” identifies fair value gaps across multiple time units, evaluates them with a displacement score, optionally filters them according to market structure events (BOS/CHOCH), and provides context-based alerts for first touch, partial and full fills, and invalidation. The aim is to show only high-quality imbalances and trade them based on rules.
What makes the script unique (originality/added value)
Displacement score: Strength of the impulse movement as a combination of (body/ATR, range/ATR, volume Z-score).
MTF aggregator: FVGs from higher timeframes are collected, ranked, and displayed as zones on the active chart (including overlap clustering).
Structure context: Optionally, only FVGs after confirmed BOS/CHOCH in the trend direction, including premium/discount evaluation relative to the HTF range.
Adaptive invalidation: FVG expires after candles, opposing BOS or defined time (e.g., end of session).
Session/instrument filter: Time window (e.g., NY/LDN), minimum tick size, ATR-based minimum gap.
Smart fill logic: Distinguishes between first touch, partial fill (≥ %), full fill (100%); alarms per event.
Statistics overlay (optional): Hit rate/expectancy per TF & session for fine-tuning the filters.
How it works (conceptually)
FVG definition (3-candle pattern): Bullish if High < Low (bearish analog). Size = gap span in points.
Quality score:Score = w1*(|Body|/ATR) + w2*(Range/ATR) + w3*(Volume-Z), normalized to 0–100.
MTF scan: List of higher TFs: (customizable). Findings are merged, ranked, and displayed as zones with priority (color/opacity).
Context filter: Only FVGs that emerge after BOS/CHOCH in the direction of the current trend; optional exclusion in premium/discount areas.
Invalidation & alerts: A zone is considered active until the invalidation rule takes effect. Alerts are triggered upon: initial contact, partial/full filling, invalidation.
Important inputs
Min. FVG size: × ATRor ticks/points
Min. displacement score: (0–100)
MTF list:
BOS/CHOCH filter: On/Off (Lookback candles)
Session filter: NY/LDN/Asia (local time, weekend toggle)
Invalidation: maxBars = , Opposite BOS = On/Off, Session End = On/Off
Fill definitions: Partial fill ≥ % of the gap; Full fill = 100%
Overlay options: Zone color/transparency, HTF label, statistics overlay On/Off
Alerts (names & triggers)
FVG Suite – First Touch: Price touches an active FVG zone for the first time.
FVG Suite – Partial Fill: Partial fill ≥ configured threshold.
FVG Suite – Full Fill: Gap completely filled.
FVG Suite – Invalidated: Zone invalidated by rules. (Alert message contains: symbol, TF of the zone, direction, score, size, trigger rule.)
Use (best practices)
Trade in the trend direction with BOS/CHOCH filter; target counter-imbalances/liquidity pools.
Use session filters to avoid news spikes/illiquid periods.
Calibrate parameters for each market/TF (ATR/volume profiles differ).
Limitations
Structure labels can be reevaluated for new highs/lows (repainting of labels, not of FVG finds).
Spreads/news can generate “pseudo fills.”
Backtests/statistics are sample-dependent; no guarantee of results.
Changelog
v1.0 – First release (score model, MTF aggregator, BOS/CHOCH filter, fill alerts).
Credits
FVG concept: public ICT/SMC literature (general idea). Implementation/scoring, MTF ranking, smart fill logic: own development.
Note/disclaimer
No financial advice. For educational purposes only. Trading involves high risk; use stop losses and a fixed risk budget.
Noon Curve Box with Quadrants & 1st FVGOverview 📜
The Noon Curve Box with Quadrants & 1st FVG is a comprehensive analysis tool built for intraday traders. It automates the process of identifying and visualizing key time-based concepts popularized by ICT (Inner Circle Trader) and other price action methodologies.
While the concepts themselves are public, this script's value lies in its unique automation and clear presentation. It saves you the manual effort of marking session ranges, quadrants, and searching for critical imbalances every single day, allowing you to focus purely on execution.
Underlying Concepts Explained 🧠
This script is built on a few core price action principles:
Time-Based Profiling: The idea that different times of the trading day have different characteristics. The script visually separates the main session into 2-hour quadrants to help you track momentum shifts.
Fair Value Gaps (FVG): An FVG is a three-bar pattern that indicates a price imbalance or inefficiency. It's a foundational concept in many institutional trading methods.
A Bullish FVG (or BISI) forms when there is a gap between the first candle's high and the third candle's low:
Candle 1 HighCandle 3 High
"Silver Bullet" Time Windows: This indicator specifically targets the first FVG formed during the high-impact AM session (9:30-10:00 NY Time) and a corresponding PM session (13:30-14:00 NY Time), as these are often considered high-probability reversal or continuation zones.
Key Features & How It Works ✨
Automated Session Box: The script automatically draws a box around the high and low of your specified trading session (default is 8:00 AM - 4:00 PM New York time). This provides an instant view of the day's operating range.
Dynamic Quadrant Analysis: The session is automatically divided into 2-hour quadrants. Each box is colored based on its internal momentum (close vs. open), providing an at-a-glance summary of buying or selling pressure throughout the day.
Precision FVG Detection:
The script's core logic scans for the very first FVG within the AM (9:30-10:00) and PM (13:30-14:00) windows.
It identifies the exact 3-bar pattern and immediately draws a box marking the imbalance zone. Once the first FVG is found for a window, the script stops searching, ensuring your chart remains clean and focused on the most significant, initial imbalance.
The FVG boxes extend to the current bar, keeping these key levels of interest visible all day.
How to Use This Indicator 🎯
Context: Use the Session Box high and low as your primary intraday support and resistance levels.
Momentum: Use the Quadrant Box colors to gauge the flow of the market. A switch from red to green, for example, can signal a potential shift in control.
High-Probability Setups: The AM and PM First FVG boxes are your key points of interest. These imbalances often act as price magnets. Look for price to return to these zones to find potential entries, as they may act as support (bullish FVG) or resistance (bearish FVG).
Settings and Customization ⚙️
You have full control over all visual elements.
Session Control: Adjust the session time and timezone.
Visual Toggles: Enable or disable the Session Box, Quadrants, and AM/PM FVGs.
Color Customization: Match all elements to your personal chart theme.
History: Limit the number of historical FVG boxes displayed to keep your chart clean.

Inversion Fair Value Gap Consumption | Flux Charts💎 GENERAL OVERVIEW
Introducing our new Inversion Fair Value Gap Consumption (IFVG) indicator! Inversion Fair Value Gaps occur when a Fair Value Gap becomes invalidated. They reverse the role of the original Fair Value Gap, making a bullish zone bearish and vice versa. IFVGs get "consumed" when market orders fill the gap occurred. With this indicator, you can now see the percentage of the IFVG's consumed part. For more information about the process, read the "HOW DOES IT WORK" section of the description.
Features of the new Consumption IFVG Indicator :
Render Bullish / Bearish IFVG Zones
See The Consumed Part Of The IFVG Zones
Combination Of Overlapping FVG Zones
Variety Of Zone Detection / Sensitivity / Filtering / Invalidation Settings
High Customizability
🚩UNIQUENESS
This indicator stands out with its ability to render the consumed part of IFVGs. You can see how much of the IFVG's gap is filled, with it's percentage. Also the ability to combine overlapping FVG zones will result in cleaner charts for traders. You can customize the FVG Filtering method, FVG & IFVG Zone Invalidation, Detection Sensitivity etc. according to your needs to get the best performance from the indicator.
📌 HOW DOES IT WORK ?
A Fair Value Gap generally occur when there is an imbalance in the market. They can be detected by specific formations within the chart. An Inversion Fair Value Gap is when a FVG becomes invalidated, thus reversing the direction of the FVG.
IFVGs get consumed when a Close / Wick enters the IFVG zone. Check this example:
⚙️SETTINGS
1. General Configuration
FVG Zone Invalidation -> Select between Wick & Close price for FVG Zone Invalidation.
IFVG Zone Invalidation -> Select between Wick & Close price for IFVG Zone Invalidation. This setting also switches the type for IFVG consumption.
Zone Filtering -> With "Average Range" selected, algorithm will find FVG zones in comparison with average range of last bars in the chart. With the "Volume Threshold" option, you may select a Volume Threshold % to spot FVGs with a larger total volume than average.
FVG Detection -> With the "Same Type" option, all 3 bars that formed the FVG should be the same type. (Bullish / Bearish). If the "All" option is selected, bar types may vary between Bullish / Bearish.
Detection Sensitivity -> You may select between Low, Normal or High FVG detection sensitivity. This will essentially determine the size of the spotted FVGs, with lower sensitivies resulting in spotting bigger FVGs, and higher sensitivies resulting in spotting all sizes of FVGs.
Show Historic Zones -> If this option is on, the indicator will render invalidated IFVG zones as well as current IFVG zones. For a cleaner look at current IFVG zones which are not invalidated yet, you can turn this option off.

ICT FVG & Order Flow (IRL to ERL)Overview
Master liquidity with precision. This indicator brings the iCT trading concept to life by automatically detecting liquidity pools, fair value gaps, and key swing points. It shows you exactly where price is likely to move next — from Internal Range Liquidity (IRL) to External Range Liquidity (ERL). With built-in alerts and multi-timeframe validation, it helps you stay one step ahead of the market.
Concept
Markets move where liquidity is. According to iCT theory, price usually sweeps internal liquidity (IRL) first and then hunts for external liquidity (ERL). By mapping this process in real time, the indicator provides a clear framework for understanding market structure, liquidity grabs, and directional bias.
How it works
Detects the High-Probability Leg (HPL) — the leg containing a fair value gap (FVG)
Highlights unmitigated FVGs within the current context.
Marks swing points (SPs), IRL levels, and ERL targets automatically.
Identifies IRL rejections when liquidity is taken inside the leg.
Identifies if a FVG is Respected or Disrespected by 2 Candle Rejection (2CR)
Notifies you of every critical liquidity event:
New context leg
New FVG
IRL rejection
ERL or SP liquidity sweep
FVG is Respected or Disrespected by 2CR
Key Features
Automatic drawing of IRL, ERL, and SP levels
FVG types: Simple FVG or Breakaway Gap (BAG)
Multi-timeframe sweep check – if a single candle takes both IRL and ERL, the indicator zooms into a lower timeframe to confirm which liquidity was swept first
Fully customizable alerts for all liquidity events
Flexible settings for swing points, lookback depth, colors, and style
How to use
Start from the monthly chart to define the macro trend.
Analyze the latest order flow leg:
Bullish FVG = bullish context
Bearish FVG = bearish context
Step down to the daily timeframe and repeat the analysis.
Wait for price to approach or reject from IRL (the indicator highlights it automatically).
Drop to a lower timeframe for entries — use timeframe alignment to select the right LTF.
Enter with the FVG model, targeting liquidity within the leg.
Place take profit inside the context — e.g., never above ERL in a bullish setup.
🔔 Alerts
New Context
New FVG
IRL Rejection
ERL Sweep
SP Sweep
2CR
⚙️ Customization
Context side (auto/manual)
LTF pointer (auto/manual)
Show/hide Resistance FVG, Overlapping Defense, ERL/SP sweeps, 2CR
Look back bars, swing lines, swing length, line offsets
* Full color customization (FVG, bullish/bearish, labels, boxes)

Michael's FVG Detector═══════════════════════════════════════
Michael's FVG Detector
═══════════════════════════════════════
A clean and efficient Fair Value Gap (FVG) indicator for TradingView that helps traders identify market imbalances with precision.
───────────────────────────────────────
Overview
───────────────────────────────────────
Fair Value Gaps (FVGs) are price inefficiencies that occur when there's a gap between the wicks of candlesticks, indicating rapid price movement with minimal trading activity. These gaps often act as support/resistance zones where price may return to "fill the gap."
This indicator automatically detects and visualizes both bullish and bearish FVGs on any timeframe, making it easy to spot potential trading opportunities.
───────────────────────────────────────
Features
───────────────────────────────────────
Core Functionality
Automatic FVG Detection : Identifies Fair Value Gaps in real-time as they form
Bullish & Bearish FVGs : Detects both upward and downward price gaps
3-Candle Pattern : Uses classic FVG logic (current candle low > high from 2 bars ago for bullish, vice versa for bearish)
Gap Size Display : Shows the exact size of each FVG in ticks directly on the box
Confirmed Bars Only : Only draws FVGs on confirmed bars to prevent repainting
Customization
Color Settings : Fully customizable colors for bullish and bearish FVGs with transparency control
Text Color : Configurable color for the tick size labels
Default Styling : Comes with sensible defaults (20% transparency, dark gray labels)
Performance Optimization
Smart Cleanup : Automatically removes boxes outside the visible chart area
Efficient Rendering : Maintains optimal performance even on lower timeframes
No Repainting : Uses confirmed bars only for reliable signals
───────────────────────────────────────
How It Works
───────────────────────────────────────
Detection Logic
Bullish FVG:
Current bar's low is higher than the high from 2 bars ago
Creates an upward gap that price left behind during bullish momentum
Bearish FVG:
Current bar's high is lower than the low from 2 bars ago
Creates a downward gap that price left behind during bearish momentum
Visual Display
Each detected FVG is displayed as:
A semi-transparent colored box spanning the gap area
The box extends from bar -2 to the current bar
Gap size in ticks shown at the bottom-left of each box
Singular/plural formatting ("1 tick" vs "X ticks")
───────────────────────────────────────
Performance Notes
───────────────────────────────────────
Cleanup runs every 50 bars to maintain optimal performance
Only creates boxes on confirmed bars (no real-time repainting)
Efficiently manages memory by removing off-screen boxes
Suitable for both manual and automated trading strategies
───────────────────────────────────────
Disclaimer
───────────────────────────────────────
This indicator is for educational and informational purposes only. It is not financial advice. Always do your own research and risk management before making trading decisions.
───────────────────────────────────────
Author : Michael
Version : 1.0
License : Free for personal use
Last Updated : November 2025

ICT Sweep + FVG Entry (v6) • Antoine📌 ICT Sweep + FVG Entry (Antoine)
This indicator is designed for price action traders who follow ICT concepts and want a mechanical tool to spot liquidity sweeps, fair value gaps (FVGs), and precise entry signals.
🔎 Key Features
Liquidity Pools (HTF)
• Automatically plots recent swing highs/lows from a higher timeframe (5m/15m).
• These act as Buy Side Liquidity (BSL) and Sell Side Liquidity (SSL) levels where stop orders accumulate.
Sweep Detection
• Identifies when price breaks a pool (BSL/SSL) but closes back inside → a classic liquidity grab.
• Plots a triangle on the chart when a sweep is confirmed.
Fair Value Gap (FVG) Highlighting
• Detects bullish and bearish FVGs on the execution timeframe (ideal for 1m).
• Option to display active FVG zones with shaded boxes.
Entry Signals
• A signal (cross) appears when:
A liquidity sweep occurs.
An FVG forms in the direction of the rejection.
Price retests the FVG (entry at the 50% mid-level or edge).
Alerts Ready
• Get alerted for sweeps (bullish/bearish) and for entry confirmations (long/short FVG retests).
🎯 How to Use
Choose your HTF (5m or 15m) → The indicator maps major liquidity pools.
Drop to LTF (1m) → Wait for a sweep signal at one of the pools.
Confirm with FVG → If an FVG appears in the sweep’s direction, the indicator waits for a retest.
Entry → Enter on the retest of the FVG (edge or 50%).
Risk Management
Stop loss: just beyond the sweep’s wick.
Target: opposite liquidity pool.
Minimum recommended R:R: 1:2.
✅ Why this helps
This tool makes it easier to trade ICT-style setups without missing opportunities:
No need to manually draw every swing high/low.
Automatic FVG detection saves time.
Clear sweep + FVG + retest logic keeps your entries mechanical and disciplined.
⚠️ Disclaimer: This script is for educational purposes only. It does not guarantee profits. Always use proper risk management.

High Time Frame FVG [TakingProphets]HTF FVG
The HTF FVG indicator is built for traders who want a clean, multi-timeframe view of Fair Value Gaps (FVGs) without manually flipping charts. It automatically detects unmitigated FVGs across up to five higher timeframes and overlays them directly on your active chart, keeping your execution bias aligned with higher-timeframe liquidity.
✨ What it does
📌 Multi-timeframe mapping – Detects and plots bullish/bearish FVGs across up to 5 custom HTFs + your current chart.
🧩 Auto-labeling – Each gap is tagged with its originating timeframe (e.g., M5, H1, D1).
🔄 Live updates – FVGs extend forward in time and are automatically removed once mitigated based on your plan.
🟢 Inverse FVGs (optional) – Highlight “inverse gaps” for traders who utilize them in reversal models.
🎯 Consequent Encroachment lines – Enable mid-gap CE levels for precision-based trade management.
⚡ Optimized performance – Built with array management, capped lookback periods, and per-timeframe limits for smooth charting.
🛠️ How it works
Fair Value Gaps are detected using a 3-candle structure:
Bullish FVG → the high of two candles ago is below the low of the prior candle.
Bearish FVG → the low of two candles ago is above the high of the prior candle.
For each selected timeframe:
When an FVG forms, a box is drawn from the gap boundaries and extended forward by a configurable number of bars.
If price closes into the gap on its originating timeframe, the box is automatically removed.
If Consequent Encroachment is enabled, a mid-gap line is plotted for refined targeting.
When multiple gaps exist per side, only the closest unmitigated one remains highlighted for clarity.
⚙️ Inputs & customization
Detection Sensitivity → High / Medium / Low
Lookback Period → 1 Day / 1 Week / 1 Month / Max
Extend Gaps → Add extra forward bars beyond the originating candle.
Show Consequent Encroachment → Toggle CE midlines on/off.
Show Inverse FVGs → Mark inverted gaps for advanced models.
Custom HTFs → Choose up to 5 timeframes to map onto your execution chart.
Appearance Settings → Configure colors, transparency, label size, and gap boundary styles.
📈 Practical tips
Use smaller execution timeframes (e.g., 1m–5m) and overlay multiple HTFs (e.g., M15, H1, H4, D1).
Watch for stacked HTF FVGs in the same price zone — these often create higher-probability draw areas.
Pair CE midlines with session timing, PD arrays, and liquidity concepts to refine entries.
Limit your lookback period and max stored FVGs for better performance during volatile sessions.
📌 Notes
This tool does not generate buy/sell signals. It’s a context mapping utility to help align your trading plan with higher-timeframe structure.
Weekend gaps are automatically filtered out to reduce false positives.
🏷️ Credits & disclaimer
Concepts: ICT / Smart Money methodologies around imbalances and liquidity gaps.
Disclaimer: This script is for educational purposes only and should not be considered financial advice. Always test on demo and trade your own plan.

First FVG📘 Indicator Description (English)
First FVG – NY Open is a TradingView indicator designed to automatically identify the first Fair Value Gap (FVG) that appears during the New York session, following the ICT (Inner Circle Trader) methodology.
It highlights institutional inefficiencies in price caused by imbalanced price action and helps traders spot high-probability entry zones, especially after the 9:30 AM EST (New York Open).
⚙️ How It Works
Session time: The indicator scans for FVGs starting at 9:32 AM (allowing 3 candles after the NY Open to form).
FVG Conditions:
Bullish FVG: When the high of 2 candles ago is lower than the low of the current candle and the middle candle is bullish.
Bearish FVG: When the low of 2 candles ago is higher than the high of the current candle and the middle candle is bearish.
Only the first FVG per session is drawn, as taught by ICT for setups like Judas Swing or NY Reversal models.
A colored box is drawn to represent the FVG zone.
A dotted horizontal line (CE) is drawn at the midpoint of the FVG box (Consequent Encroachment), a key level watched by smart money traders.
A dashed vertical line is drawn at 9:30 NY time to mark the open.
🧠 How to Use It
Wait for the NY Open (9:30 AM EST) – the indicator becomes active at 9:32 AM.
Watch for the first FVG box of the day. This is often a high-probability reaction zone.
Use the CE line (center of the FVG) as a reference for entries, rejections, or liquidity grabs.
Combine with market structure, PD Arrays, and liquidity concepts as taught by ICT for confluence.
The FVG box and CE line will extend forward for several candles for visual clarity.
🎛️ Customizable Settings
Session time (default: 09:32–16:00 NY)
FVG box color (up/down)
Text color
Max number of days to keep boxes on chart
Option to show or hide the 9:30 NY Open vertical line

Multi-Timeframe Fair Value Gap (FVG)Multi-Timeframe Fair Value Gap (FVG) Indicator
Description
This indicator identifies and displays Fair Value Gaps (FVGs) across multiple timeframes simultaneously. A Fair Value Gap occurs when price moves so quickly that it leaves behind an area where no actual trading has taken place. These areas often act as magnets for price to return to later, making them valuable for traders to identify potential support and resistance zones.
Key features:
·Support for up to 6 different timeframes simultaneously
·Customizable colors for each timeframe
·Option to display middle lines within FVGs
·Automatic FVG mitigation detection (by price or wick)
·Bullish and bearish FVGs clearly distinguished
·Highly customizable appearance
The indicator uses different colors for each timeframe, allowing you to easily distinguish between short-term and long-term FVGs. This makes it an excellent tool for multi-timeframe analysis and for identifying key areas where price might react.
How to Use
Add the indicator to your chart
·Configure the timeframes you want to monitor (default: 5m, 15m, 1h, 4h, Daily, Weekly)
·Customize colors for each timeframe if desired
·Choose between "Close" or "Wick" mitigation method
·Look for areas where multiple FVGs overlap - these often represent stronger zones
The indicator automatically tracks when an FVG has been filled (mitigated) and removes it from the chart. This keeps your analysis clean and focused on active, unfilled gaps that are still likely to affect price.
——————————————————————————————————————————————————————————
该指标可同时识别并显示多个时间周期的公允价值缺口(FVGs)。公允价值缺口发生在价格快速移动时,留下了一个没有实际交易发生的区域。这些区域通常会吸引价格稍后回归,使它们成为交易者识别潜在支撑和阻力区域的有价值工具。
主要特点:
·同时支持多达6个不同的时间周期
·每个时间周期可自定义颜色
·可选显示FVG内的中线
·自动检测FVG的填补(通过收盘价或影线)
·清晰区分看涨和看跌的FVG
·高度可定制的外观
注意:此版本为单次缓解版本,FVG只要被触碰到1次就会被缓解,不会等待fvg完全穿越才缓解
HTF Inversion Fair Value Gap | Flux Charts💎 GENERAL OVERVIEW
Introducing our new Higher Timeframe Inversion Fair Value Gaps (IFVG) indicator! Inversion Fair Value Gaps occur when a Fair Value Gap becomes invalidated. They reverse the role of the original Fair Value Gap, making a bullish zone bearish and vice versa. This indicator finds the latest IFVG in a higher timeframe and renders it in the current chart with it's divergence. For more information about the process, read the "HOW DOES IT WORK" section of the description.
Features of the new Higher Timeframe IFVG Indicator :
Renders The Higher Timeframe IFVG
Invalidation Borders
Variety Of Zone Detection / Sensitivity / Filtering / Invalidation Settings
High Customizability
🚩 UNIQUENESS
This indicator lets you take a look at the bigger picture by rendering the latest IFVG in a higher timeframe. You can see the current IFVG divergence to see how is the price action acting around the IFVG. You also can customize the FVG Filtering method, FVG & IFVG Zone Invalidation, Detection Sensitivity etc. according to your needs to get the best performance from the indicator.
📌 HOW DOES IT WORK ?
A Fair Value Gap generally occur when there is an imbalance in the market. They can be detected by specific formations within the chart. An Inversion Fair Value Gap is when a FVG becomes invalidated, thus reversing the direction of the FVG.
This indicator then renders the IFVG in a higher timeframe in your chart like this :
The opaque dashed lines at the top and the bottom of the IFVG indicate the bars that formed the original FVG. The middle dashed line that is semi-transparent shows the candlestick that invalidated the original FVG, thus created the current IFVG. The vertical solid top & bottom wicks indicate the current divergence of the highest & lowest points to the current IFVG.
The IFVGs can act as strong support & resistance points, depending on their creation volume and invalidation volume. Traders can use them for confirmation signals to their positions.
⚙️ SETTINGS
1. General Configuration
Higher Timeframe -> The higher timeframe to detect latest IFVG from. Keep in mind that his setting must be higher than the current timeframe.
IFVG Zone Invalidation -> Select between Wick & Close price for IFVG Zone Invalidation.
2. Fair Value Gaps
FVG Zone Invalidation -> Select between Wick & Close price for FVG Zone Invalidation.
Zone Filtering -> With "Average Range" selected, algorithm will find FVG zones in comparison with average range of last bars in the chart. With the "Volume Threshold" option, you may select a Volume Threshold % to spot FVGs with a larger total volume than average.
FVG Detection -> With the "Same Type" option, all 3 bars that formed the FVG should be the same type. (Bullish / Bearish). If the "All" option is selected, bar types may vary between Bullish / Bearish.
Detection Sensitivity -> You may select between Low, Normal or High FVG detection sensitivity. This will essentially determine the size of the spotted FVGs, with lower sensitivities resulting in spotting bigger FVGs, and higher sensitivities resulting in spotting all sizes of FVGs.
3. Dasboard
You can enable / disable the mitigation dashboard and customize it here.
4. Customization
Offset -> The number of candlesticks the IFVG will be rendered to the right of the latest bar.
Width -> The width of the rendered IFVG in candlesticks.

Fibonacci Inversion Fair Value Gaps | Flux Charts💎 GENERAL OVERVIEW
Introducing our new Fibonacci Inversion Fair Value Gaps (IFVG) indicator! Inverse Fair Value Gaps occur when a Fair Value Gap becomes invalidated. They reverse the role of the original Fair Value Gap, making a bullish zone bearish and vice versa. This indicator plots the Fibonacci retracement levels of the IFVG, which often act like support & resistance levels.
Features of the new Fibonacci IFVGs Indicator :
Renders Bullish / Bearish IFVG Zones
Renders Fibonacci Retracement Levels Of IFVGs
Combination Of Overlapping FVG Zones
Variety Of Zone Detection / Sensitivity / Filtering / Invalidation Settings
High Customizability
🚩UNIQUENESS
This indicator stands out with its ability to render up to 3 Fibonacci retracement levels of IFVGs. Fibonacci retracement levels are widely used within trading, and we wanted to implement them for IFVG zones. You can also customize the FVG Filtering method, FVG & IFVG Zone Invalidation, Detection Sensitivity etc. according to your needs to get the best performance from the indicator.
📌 HOW DOES IT WORK ?
A Fair Value Gap generally occur when there is an imbalance in the market. They can be detected by specific formations within the chart. An Inverse Fair Value Gap is when a FVG becomes invalidated, thus reversing the direction of the FVG.
This indicator renders 0.618, 0.5 and 0.382 (can be changed from the settings) Fibonacci retracement levels of the IFVGs, which often act as support and resistances. Check this example :
⚙️SETTINGS
1. General Configuration
FVG Zone Invalidation -> Select between Wick & Close price for FVG Zone Invalidation.
IFVG Zone Invalidation -> Select between Wick & Close price for IFVG Zone Invalidation. This setting also switches the type for IFVG consumption.
Zone Filtering -> With "Average Range" selected, algorithm will find FVG zones in comparison with average range of last bars in the chart. With the "Volume Threshold" option, you may select a Volume Threshold % to spot FVGs with a larger total volume than average.
FVG Detection -> With the "Same Type" option, all 3 bars that formed the FVG should be the same type. (Bullish / Bearish). If the "All" option is selected, bar types may vary between Bullish / Bearish.
Detection Sensitivity -> You may select between Low, Normal or High FVG detection sensitivity. This will essentially determine the size of the spotted FVGs, with lower sensitivies resulting in spotting bigger FVGs, and higher sensitivies resulting in spotting all sizes of FVGs.
Show Historic Zones -> If this option is on, the indicator will render invalidated IFVG zones as well as current IFVG zones. For a cleaner look at current IFVG zones which are not invalidated yet, you can turn this option off.
2. Fibonacci Retracement Levels
You can enable / disable up to 3 different Fibonnaci Retracement levels at this group of settings. You can also switch their line styles between solid, dashed and dotted as well as changing their colors.

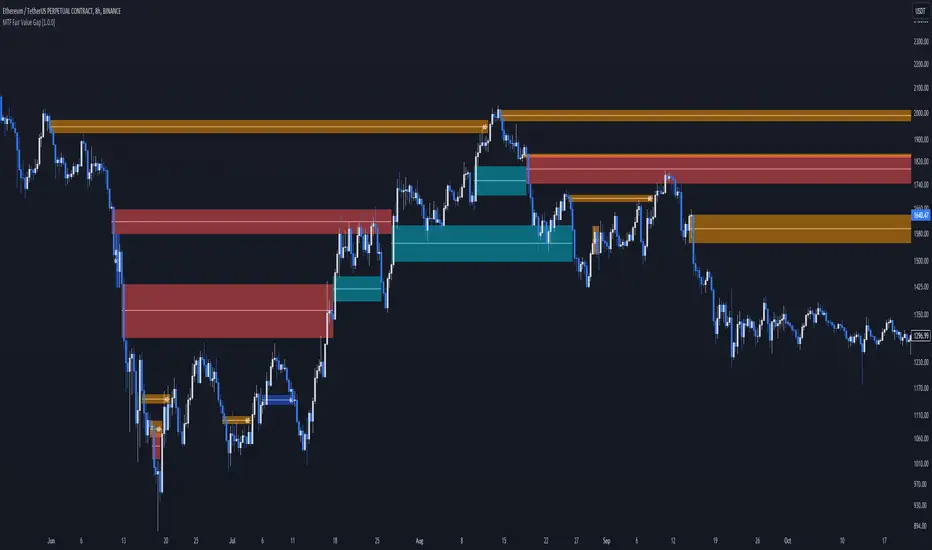
MTF Fair Value Gap [BigBeluga]The MTF Fair Value Gap (FVG) indicator provides multi-timeframe options to observe lower or higher gaps in different timeframes within your current one. This can enhance the confluence in your trading decisions.
🔶 USAGE
An FVG is formed when a candle has an 'empty' body, leaving a gap. These areas are often filled before the market continues to trend in its original direction.
In practical terms, FVGs serve to highlight support areas (bullish FVGs) and resistance zones (bearish FVGs). As a gap is filled, signaling the end of the existing imbalance, it tends to foreshadow an impending price reversal.
While this approach is inherently contrarian, individuals seeking a more trend-following strategy can opt to use FVG identification as straightforward signals. This entails taking a long position upon detecting a bullish FVG and adopting a short position in the presence of a bearish FVG.
🔹 Mitigation
The mitigation point is where the user selects when the FVG is considered filled or no longer usable.
Source => Choose the candle's low/high or close as the mitigation point.
Point => Choose the FVG's mitigation point to trigger after the candle's Source has filled it. Users can choose between the middle point or the top/bottom of the FVG.
ccc
🔹 MTF
This script can display MTF FVGs from different timeframes while showing the current one. This is extremely useful as it avoids the need to switch timeframes frequently and can add significant confluence with the current FVG.
🔹 Threshold
The Threshold is an input to remove insignificant FVGs that are too small to be truly useful. Users can choose between:
Auto => Automatically remove unusable FVGs.
Manual => Set an automatic Threshold.
🔶 TIPS
Users can choose how many FVGs to display on the current chart for better visualization.
Users can choose which FVGs to display: only the current one, only MTF ones, or both.
ORB + Fair Value Gaps (FVG/iFVG) Suite with Daily 50% MidlineA complete smart-money–focused price-action toolkit combining the New York Open Range Breakout (ORB), ICT-style Fair Value Gaps, Inverted FVGs, and a dynamic Daily 50% Midline.
Designed for traders who want a clean, fast, and highly visual way to track liquidity, imbalances, and intraday directional bias.
📌 Key Features
1. NY Session ORB (09:30–09:45 New York Time)
Automatically plots:
ORB High
ORB Low
Labels for ORB high/low
Optional 5-minute chart restriction
Lines extend forward for easy reference
Used to identify breakout conditions, liquidity sweeps, and directional bias into the morning session.
📌 2. ICT-Style Fair Value Gaps (FVGs)
Full automated detection of bullish & bearish FVGs based on the classic 3-candle displacement structure:
Bullish FVG: high < low
Bearish FVG: low > high
Each FVG is drawn as a box with:
Custom colour
Custom border style (solid, dashed, dotted)
Automatic extension to the right until filled
Optional size text showing the gap in points (font size/colour adjustable)
Adjustable max lookback for performance
📌 3. Inverted FVGs (iFVGs)
Once price fully fills an FVG, it automatically becomes an iFVG, shown with:
Custom iFVG colour
Custom border style
Extension to the right
Once price trades through the zone from the opposite side, the iFVG is considered “consumed” and:
It stops extending
And optionally auto-deletes based on user settings
This makes it easy to track meaningful imbalances that turn into liquidity pockets.
📌 4. “Show Only After ORB” Filter
Optionally hide all FVGs/iFVGs formed before the ORB completes.
This is especially useful for intraday strategies focused on NY session structure only.
📌 5. Daily 50% Midline (OHLC Midpoint)
A dynamic, always-updating midpoint of the current daily candle:
Mid = (Daily High + Daily Low) / 2
Features:
Custom colour
Dashed styling
Extends left and right as a horizontal ray
Updates live as the daily candle forms
Great for bias filters, mean reversion, and daily liquidity zones.
📌 6. Performance-Optimized (Fast!)
Built with:
Fully configurable max lookback
Memory-efficient arrays
Auto-cleaning of old FVG/iFVG objects
Lightweight daily midline recalculation
This allows extremely fast rendering even on 1-minute charts.
📌 7. Alerts
Includes a clean alert condition:
Price returned to a Fair Value Gap
Works for both bullish and bearish FVG revisits.
🎯 Who This Indicator Is For
This tool is ideal for traders who use:
ICT / SMC concepts
Liquidity-based trading
ORB strategies
Imbalance-driven price action
Intraday or NY session-focused setups
Futures, crypto, forex, and equities
🎁 Summary
This indicator gives you:
A clean ORB framework
Automatic, dynamic FVG and iFVG analysis
Real-time daily candle context
Customizable visuals
Powerful session filtering
Efficient performance
All in one clean, intuitive package built for real-time decision making.

Support & Resistance Zones + FVG**Overview:**
This tool automatically identifies **key support and resistance levels** and highlights **Fair Value Gaps (FVGs)** on the chart. It helps traders of all levels **visualize important price areas**, spot potential market reactions, and make better-informed trading decisions.
Support and resistance zones are areas where price tends to **reverse, stall, or accelerate**, making them essential for entries, exits, and stop-loss placement. Fair Value Gaps represent rapid price movements that leave temporary imbalances, which often act as **future targets or reversal points**. Together, these features provide a **comprehensive view of market structure**.
---
## Features:
1. **Automatic Support & Resistance Detection:**
* Detects zones based on recent price action patterns:
* **Bull-to-Bear transitions** → resistance zones
* **Bear-to-Bull transitions** → support zones
* Dynamically calculates **zone heights** based on recent candle ranges, adapting to market volatility.
2. **Broken Zones & Proximity Alerts:**
* Highlights zones that have been broken, helping traders **focus on relevant levels**.
* Optional proximity alerts indicate broken zones that are **near the current price**, showing potential retests.
3. **Fair Value Gaps (FVGs):**
* Detects bullish and bearish gaps automatically.
* Options to **ignore narrow gaps** and **remove fully crossed FVGs**.
* Acts as a guide for potential **price targets or reversal areas**.
4. **Clean Chart & Customization:**
* Hides overlapping or invalid zones to reduce clutter.
* Fully adjustable inputs, including:
* Zone length
* Lookback range
* Zone height multiplier
* FVG extension
* Display and opacity settings
5. **Timeframe-Independent:**
* Works on **any chart interval**, from scalping to long-term swing charts.
---
## How It Helps Traders:
* **Identify Key Levels Automatically:**
Visualizes areas where the price has historically reacted. These zones act as **natural barriers** guiding entries and exits.
* **Spot Broken Zones:**
Broken zones may lose significance but could act as **future retest points**, helping assess trend continuation or reversal.
* **Visualize Price Gaps (FVGs):**
Gaps left by rapid price movement often act as **price magnets**, providing potential targets or reversal points.
* **Reduce Noise:**
Automatically hides overlapping or invalid zones for a **cleaner, easier-to-read chart**, highlighting only the most significant levels.
* **Adaptable to Any Trading Style:**
Useful for **swing trading, intraday trading, or scalping**, showing where buyers and sellers are most active.
---
## Practical Usage Guide:
1. **Enable Support & Resistance Zones:**
* Visualize critical price levels.
* Adjust **zone length, lookback range, and height multiplier** to fit your trading style and volatility.
2. **Enable FVGs:**
* Highlights gaps created by rapid price movements.
* Customize **minimum gap size, extension, and filtering options** to reduce chart noise.
3. **Observe Price Reactions:**
* **Bounce at support:** Potential buy opportunity.
* **Reversal at resistance:** Potential sell/short opportunity.
* **Breakout:** Watch for price breaking a zone for trend continuation trades.
4. **Risk Management:**
* Place stop-loss orders just outside zones to protect trades.
* Use broken zones as **profit targets** or areas to tighten stops.
5. **Trend Analysis:**
* Understand where buyers and sellers are concentrated.
* Identify strong trends by observing multiple zones being respected or broken.
6. **Multi-Timeframe Application:**
* Apply on different timeframes to **align short-term entries with longer-term structure**, improving trade probability.
---
## Key Inputs & Customizations:
* **Support & Resistance Zones:**
* Show/Hide Zones
* Zone Length Extend (bars)
* Loopback Range (bars)
* Zone Height Multiplier
* Hide Overlapped Zones
* Hide Broken Zones
* Ignore Last N Candles for Break Check
* Show Proximity Broken Zones
* Proximity Range for Broken Zones
* **Fair Value Gaps (FVGs):**
* Show/Hide FVGs
* Extend FVGs (bars)
* Minimum FVG Size
* Ignore Narrow FVGs
* Ignore Fully Crossed FVGs
* Up and Down Colors with Opacity
---
**Summary:**
This indicator saves **time, improves chart clarity, and highlights key market levels**. It is suitable for beginners who want to **understand market structure visually**, as well as experienced traders seeking **precise entry, exit, and target zones**. By combining support/resistance detection with Fair Value Gaps, it provides a **complete visual guide to price behavior**, helping traders make **more confident and informed decisions**.

ICT Venom Trading Model [TradingFinder] SMC NY Session 2025SetupIntroduction
The ICT Venom Model is one of the most advanced strategies in the ICT framework, designed for intraday trading on major US indices such as US100, US30, and US500. This model is rooted in liquidity theory, time and price dynamics, and institutional order flow.
The Venom Model focuses on detecting Liquidity Sweeps, identifying Fair Value Gaps (FVG), and analyzing Market Structure Shifts (MSS). By combining these ICT core concepts, traders can filter false breakouts, capture sharp reversals, and align their entries with the real institutional liquidity flow during the New York Session.
Key Highlights of ICT Venom Model :
Intraday focus : Optimized for US indices (US100, US30, US500).
Time element : Critical window is 08:00–09:30 AM (Venom Box).
Liquidity sweep logic : Price grabs liquidity at 09:30 AM open.
Confirmation tools : MSS, CISD, FVG, and Order Blocks.
Dual setups : Works in both Bullish Venom and Bearish Venom conditions.
At its core, the ICT Venom Strategy is a framework that explains how institutional players manipulate liquidity pools by engineering false breakouts around the initial range of the market. Between 08:00 and 09:30 AM New York time, a range called the “Venom Box” is formed.
This range acts as a trap for retail traders, and once the 09:30 AM market open occurs, price usually sweeps either the high or the low of this box to collect stop-loss liquidity. After this liquidity grab, the market often reverses sharply, giving birth to a classic Bullish Venom Setup or Bearish Venom Setup
The Venom Model (ICT Venom Trading Strategy) is not just a pattern recognition tool but a precise institutional trading model based on time, liquidity, and market structure. By understanding the Initial Balance Range, watching for Liquidity Sweeps, and entering trades from FVG zones or Order Blocks, traders can anticipate market reversals with high accuracy. This strategy is widely respected among ICT followers because it offers both risk management discipline and clear entry/exit conditions. In short, the Venom Model transforms liquidity manipulation into actionable trading opportunities.
Bullish Setup :
Bearish Setup :
🔵 How to Use
The ICT Venom Model is applied by observing price behavior during the early hours of the New York session. The first step is to define the Initial Range, also called the Venom Box, which is formed between 08:00 and 09:30 AM EST. This range marks the high and low points where institutional traders often create traps for retail participants. Once the official market opens at 09:30 AM, price usually sweeps either the top or bottom of this box to collect liquidity.
After this liquidity grab, the market tends to reverse in alignment with the true directional bias. To confirm the setup, traders look for signals such as a Market Structure Shift (MSS), Change in State of Delivery (CISD), or the appearance of a Fair Value Gap (FVG). These elements validate the reversal and provide precise levels for trade execution.
🟣 Bullish Setup
In a Bullish Venom Setup, the market first sweeps the low of the Venom Box after 09:30 AM, triggering sell-side liquidity collection. This downward move is often sharp and deceptive, designed to stop out retail long positions and attract new sellers. Once liquidity is taken, the market typically shifts direction, forming an MSS or CISD that signals a reversal to the upside.
Traders then wait for price to retrace into a Fair Value Gap or a demand-side Order Block created during the reversal leg. This retracement offers the ideal entry point for long positions. Stop-loss placement should be just below the liquidity sweep low, while profit targets are set at the Venom Box high and, if momentum continues, at higher session or daily highs.
🟣 Bearish Setup
In a Bearish Venom Setup, the process is similar but reversed. After the Initial Range is defined, if price breaks above the Venom Box high following the 09:30 AM open, it signals a false breakout designed to collect buy-side liquidity. This move usually traps eager buyers and clears out stop-losses above the high.
After the liquidity sweep, confirmation comes through an MSS or CISD pointing to a reversal downward. At this stage, traders anticipate a retracement into a Fair Value Gap or a supply-side Order Block formed during the reversal. Short entries are taken within this zone, with stop-loss positioned just above the liquidity sweep high. The logical profit targets include the Venom Box low and, in stronger bearish momentum, deeper session or daily lows.
🔵 Settings
Refine Order Block : Enables finer adjustments to Order Block levels for more accurate price responses.
Mitigation Level OB : Allows users to set specific reaction points within an Order Block, including: Proximal: Closest level to the current price. 50% OB: Midpoint of the Order Block. Distal: Farthest level from the current price.
FVG Filter : The Judas Swing indicator includes a filter for Fair Value Gap (FVG), allowing different filtering based on FVG width: FVG Filter Type: Can be set to "Very Aggressive," "Aggressive," "Defensive," or "Very Defensive." Higher defensiveness narrows the FVG width, focusing on narrower gaps.
Mitigation Level FVG : Like the Order Block, you can set price reaction levels for FVG with options such as Proximal, 50% OB, and Distal.
CISD : The Bar Back Check option enables traders to specify the number of past candles checked for identifying the CISD Level, enhancing CISD Level accuracy on the chart.
🔵 Conclusion
The ICT Venom Model is more than just a reversal setup; it is a complete intraday trading framework that blends liquidity theory, time precision, and market structure analysis. By focusing on the Initial Range between 08:00 and 09:30 AM New York time and observing how price reacts at the 09:30 AM open, traders can identify liquidity sweeps that reveal institutional intentions.
Whether in a Bullish Venom Setup or a Bearish Venom Setup, the model allows for precise entries through Fair Value Gaps (FVGs) and Order Blocks, while maintaining clear risk management with well-defined stop-loss and target levels.
Ultimately, the ICT Venom Model provides traders with a structured way to filter false moves and align their trades with institutional order flow. Its strength lies in transforming liquidity manipulation into actionable opportunities, giving intraday traders an edge in timing, accuracy, and consistency. For those who master its logic, the Venom Model becomes not only a strategy for entry and exit, but also a deeper framework for understanding how liquidity truly drives price in the New York session.

Structural Liquidity Signals [BullByte]Structural Liquidity Signals (SFP, FVG, BOS, AVWAP)
Short description
Detects liquidity sweeps (SFPs) at pivots and PD/W levels, highlights the latest FVG, tracks AVWAP stretch, arms percentile extremes, and triggers after confirmed micro BOS.
Full description
What this tool does
Structural Liquidity Signals shows where price likely tapped liquidity (stop clusters), then waits for structure to actually change before it prints a trigger. It spots:
Liquidity sweeps (SFPs) at recent pivots and at prior day/week highs/lows.
The latest Fair Value Gap (FVG) that often “pulls” price or serves as a reaction zone.
How far price is stretched from two VWAP anchors (one from the latest impulse, one from today’s session), scaled by ATR so it adapts to volatility.
A “percentile” extreme of an internal score. At extremes the script “arms” a setup; it only triggers after a small break of structure (BOS) on a closed bar.
Originality and design rationale, why it’s not “just a mashup”
This is not a mashup for its own sake. It’s a purpose-built flow that links where liquidity is likely to rest with how structure actually changes:
- Liquidity location: We focus on areas where stops commonly cluster—recent pivots and prior day/week highs/lows—then detect sweeps (SFPs) when price wicks beyond and closes back inside.
- Displacement context: We track the last Fair Value Gap (FVG) to account for recent inefficiency that often acts as a magnet or reaction zone.
- Stretch measurement: We anchor VWAP to the latest N-bar impulse and to the Daily session, then normalize stretch by ATR to assess dislocation consistently across assets/timeframes.
- Composite exhaustion: We combine stretch, wick skew, and volume surprise, then bend the result with a tanh transform so extremes are bounded and comparable.
- Dynamic extremes and discipline: Rather than triggering on every sweep, we “arm” at statistical extremes via percent-rank and only fire after a confirmed micro Break of Structure (BOS). This separates “interesting” from “actionable.”
Key concepts
SFP (liquidity sweep): A candle briefly trades beyond a level (where stops sit) and closes back inside. We detect these at:
Pivots (recent swing highs/lows confirmed by “left/right” bars).
Prior Day/Week High/Low (PDH/PDL/PWH/PWL).
FVG (Fair Value Gap): A small 3‑bar gap (bar2 high vs bar1 low, or vice versa). The latest gap often acts like a magnet or reaction zone. We track the most recent Up/Down gap and whether price is inside it.
AVWAP stretch: Distance from an Anchored VWAP divided by ATR (volatility). We use:
Impulse AVWAP: resets on each new N‑bar high/low.
Daily AVWAP: resets each new session.
PR (Percentile Rank): Where the current internal score sits versus its own recent history (0..100). We arm shorts at high PR, longs at low PR.
Micro BOS: A small break of the recent high (for longs) or low (for shorts). This is the “go/no‑go” confirmation.
How the parts work together
Find likely liquidity grabs (SFPs) at pivots and PD/W levels.
Add context from the latest FVG and AVWAP stretch (how far price is from “fair”).
Build a bounded score (so different markets/timeframes are comparable) and compute its percentile (PR).
Arm at extremes (high PR → short candidate; low PR → long candidate).
Only print a trigger after a micro BOS, on a closed bar, with spacing/cooldown rules.
What you see on the chart (legend)
Lines:
Teal line = Impulse AVWAP (resets on new N‑bar extreme).
Aqua line = Daily AVWAP (resets each session).
PDH/PDL/PWH/PWL = prior day/week levels (toggle on/off).
Zones:
Greenish box = latest Up FVG; Reddish box = latest Down FVG.
The shading/border changes after price trades back through it.
SFP labels:
SFP‑P = SFP at Pivot (dotted line marks that pivot’s price).
SFP‑L = SFP at Level (at PDH/PDL/PWH/PWL).
Throttle: To reduce clutter, SFPs are rate‑limited per direction.
Triggers:
Triangle up = long trigger after BOS; triangle down = short trigger after BOS.
Optional badge shows direction and PR at the moment of trigger.
Optional Trigger Zone is an ATR‑sized box around the trigger bar’s close (for visualization only).
Background:
Light green/red shading = a long/short setup is “armed” (not a trigger).
Dashboard (Mini/Pro) — what each item means
PR: Percentile of the internal score (0..100). Near 0 = bullish extreme, near 100 = bearish extreme.
Gauge: Text bar that mirrors PR.
State: Idle, Armed Long (with a countdown), or Armed Short.
Cooldown: Bars remaining before a new setup can arm after a trigger.
Bars Since / Last Px: How long since last trigger and its price.
FVG: Whether price is in the latest Up/Down FVG.
Imp/Day VWAP Dist, PD Dist(ATR): Distance from those references in ATR units.
ATR% (Gate), Trend(HTF): Status of optional regime filters (volatility/trend).
How to use it (step‑by‑step)
Keep the Safety toggles ON (default): triggers/visuals on bar‑close, optional confirmed HTF for trend slope.
Choose timeframe:
Intraday (5m–1h) or Swing (1h–4h). On very fast/thin charts, enable Performance mode and raise spacing/cooldown.
Watch the dashboard:
When PR reaches an extreme and an SFP context is present, the background shades (armed).
Wait for the trigger triangle:
It prints only after a micro BOS on a closed bar and after spacing/cooldown checks.
Use the Trigger Zone box as a visual reference only:
This script never tells you to buy/sell. Apply your own plan for entry, stop, and sizing.
Example:
Bullish: Sweep under PDL (SFP‑L) and reclaim; PR in lower tail arms long; BOS up confirms → long trigger on bar close (ATR-sized trigger zone shown).
Bearish: Sweep above PDH/pivot (SFP‑L/P) and reject; PR in upper tail arms short; BOS down confirms → short trigger on bar close (ATR-sized trigger zone shown).
Settings guide (with “when to adjust”)
Safety & Stability (defaults ON)
Confirm triggers at bar close, Draw visuals at bar close: Keep ON for clean, stable prints.
Use confirmed HTF values: Applies to HTF trend slope only; keeps it from changing until the HTF bar closes.
Performance mode: Turn ON if your chart is busy or laggy.
Core & Context
ATR Length: Bigger = smoother distances; smaller = more reactive.
Impulse AVWAP Anchor: Larger = fewer resets; smaller = resets more often.
Show Daily AVWAP: ON if you want session context.
Use last FVG in logic: ON to include FVG context in arming/score.
Show PDH/PDL/PWH/PWL: ON to see prior day/week levels that often attract sweeps.
Liquidity & Microstructure
Pivot Left/Right: Higher values = stronger/rarer pivots.
Min Wick Ratio (0..1): Higher = only more pronounced SFP wicks qualify.
BOS length: Larger = stricter BOS; smaller = quicker confirmations.
Signal persistence: Keeps SFP context alive for a few bars to avoid flicker.
Signal Gating
Percent‑Rank Lookback: Larger = more stable extremes; smaller = more reactive extremes.
Arm thresholds (qHi/qLo): Move closer to 0.5 to see more arms; move toward 0/1 to see fewer arms.
TTL, Cooldown, Min bars and Min ATR distance: Space out triggers so you’re not reacting to minor noise.
Regime Filters (optional)
ATR percentile gate: Only allow triggers when volatility is at/above a set percentile.
HTF trend gate: Only allow longs when the HTF slope is up (and shorts when it’s down), above a minimum slope.
Visuals & UX
Only show “important” SFPs: Filters pivot SFPs by Volume Z and |Impulse stretch|.
Trigger badges/history and Max badge count: Control label clutter.
Compact labels: Toggle SFP‑P/L vs full names.
Dashboard mode and position; Dark theme.
Reading PR (the built‑in “oscillator”)
PR ~ 0–10: Potential bullish extreme (long side can arm).
PR ~ 90–100: Potential bearish extreme (short side can arm).
Important: “Armed” ≠ “Enter.” A trigger still needs a micro BOS on a closed bar and spacing/cooldown to pass.
Repainting, confirmations, and HTF notes
By default, prints wait for the bar to close; this reduces repaint‑like effects.
Pivot SFPs only appear after the pivot confirms (after the chosen “right” bars).
PD/W levels come from the prior completed candles and do not change intraday.
If you enable confirmed HTF values, the HTF slope will not change until its higher‑timeframe bar completes (safer but slightly delayed).
Performance tips
If labels/zones clutter or the chart lags:
Turn ON Performance mode.
Hide FVG or the Trigger Zone.
Reduce badge history or turn badge history off.
If price scaling looks compressed:
Keep optional “score”/“PR” plots OFF (they overlay price and can affect scaling).
Alerts (neutral)
Structural Liquidity: LONG TRIGGER
Structural Liquidity: SHORT TRIGGER
These fire when a trigger condition is met on a confirmed bar (with defaults).
Limitations and risk
Not every sweep/extreme reverses; false triggers occur, especially on thin markets and low timeframes.
This indicator does not provide entries, exits, or position sizing—use your own plan and risk control.
Educational/informational only; no financial advice.
License and credits
© BullByte - MPL 2.0. Open‑source for learning and research.
Built from repeated observations of how liquidity runs, imbalance (FVG), and distance from “fair” (AVWAPs) combine, and how a small BOS often marks the moment structure actually shifts.

2CR(SP+FVG)2CR(SP+FVG) Indicator Introduction
2CR(SP+FVG) is a powerful technical analysis indicator that combines Swing Points (SP) and Fair Value Gaps (FVG) to provide traders with a comprehensive market structure analysis and precise trading signal identification system. This indicator helps traders identify high-probability trading opportunities by detecting key structural changes and price rejection patterns in the market. 2CR(SP+FVG) not only identifies important support and resistance areas but also detects price reactions to these areas, forming sequential trading signals such as CR, 2CR, CRS, and 2CRS.
Core Components
FVG (Fair Value Gap): Detects unfilled price gaps in the market that often become future support or resistance levels
SP (Swing Point Horizontal Lines): Identifies highs and lows across multiple timeframes, marking key changes in market structure
CR Module: Detects price rejection reactions after FVG or SP mitigation, forming CR (Change Rejection) and 2CR (Double Change Rejection) signals
CRS Module: Analyzes more complex price structure changes, forming CRS (Change Rejection Structure) and 2CRS (Double Change Rejection Structure) signals
Key Features
Multi-timeframe Analysis: Analyzes both current and higher timeframes simultaneously, providing a comprehensive market perspective
Automated Signal Detection: Automatically identifies and labels trading signals such as CR, 2CR, CRS, and 2CRS
Structure Mitigation Recognition: Detects when price mitigates (touches and crosses) FVG and SP levels
Double Confirmation System: Enhances signal reliability through sequential confirmation across two candles
Custom Alerts: Provides configurable alert system for all signal types
Adjustable Appearance: Users can customize colors and display options for all components
Debug Mode: Offers detailed debugging information to help users understand signal triggering logic
Signal Types
CR (Change Rejection): The initial rejection reaction after price touches an FVG or SP, indicating a potential market reversal
2CR (Double Change Rejection): Confirmation after a CR signal, typically indicating a stronger reversal possibility
CRS (Change Rejection Structure): More advanced structural rejection signal, requiring specific price action patterns
2CRS (Double Change Rejection Structure): Confirmation after a CRS signal, providing high-probability trading opportunities
Use Cases
Trend Reversal Identification: Use CR and 2CR signals to predict potential trend turning points
Pullback Trading: Enter trades when the main trend pulls back to key support/resistance levels
Structure Breakout Confirmation: Confirm the validity of market structure breakouts through CRS and 2CRS signals
Risk Management: Use SP and FVG levels to set stop-loss and take-profit locations
Multi-timeframe Strategy: Combine signals from current and higher timeframes to build a robust trading system
Key Level Identification: Quickly identify the most important support and resistance areas in the market
--------------------
Special Note: It is recommended to use this indicator together with the SP line and FVG MG indicators for a more intuitive observation of market order flow direction. By combining these three indicators, traders can obtain a more comprehensive view of market structure, accurately identify key support and resistance levels, and more precisely determine changes in market participant behavior patterns.
--------------------
使用场景
趋势反转识别: 利用CR和2CR信号预测趋势可能的转折点
回撤交易: 在主趋势回撤到关键支撑/阻力位时进场
结构突破确认: 通过CRS和2CRS信号确认市场结构突破的有效性
风险管理: 使用SP和FVG水平线设置止损和止盈位置
多周期策略: 结合当前和更高级别时间周期的信号,构建稳健的交易系统
关键水平识别: 快速识别市场中最重要的支撑和阻力区域
--------------------
特别说明:建议连同SP line与FVG MG指标一起使用,更直观地观察市场的订单流走向。通过组合这三个指标,交易者可以获得更全面的市场结构视图,准确识别关键支撑阻力位,并更精确地判断市场参与者的行为模式变化。
--------------------

Turtle Soup ICT Strategy [TradingFinder] FVG + CHoCH/CSD🔵 Introduction
The ICT Turtle Soup trading setup, designed in the ICT style, operates by hunting or sweeping liquidity zones to exploit false breakouts and failed breakouts in key liquidity Zones, such as recent highs, lows, or major support and resistance levels.
This setup identifies moments when the price breaches these liquidity zones, triggering stop orders placed (Stop Hunt) by other traders, and then quickly reverses direction. These movements are often associated with liquidity sweeps that create temporary market imbalances.
The reversal is typically confirmed by one of three structural shifts : a Market Structure Shift (MSS), a Change of Character (CHoCH), or a break of the Change in State of Delivery (CISD). Each of these structural shifts provides a reliable signal to interpret market intent and align trading decisions with the expected price movement. After the structural shift, the price frequently pullback to a Fair Value Gap (FVG), offering a precise entry point for trades.
By integrating key concepts such as liquidity, liquidity sweeps, stop order activation, structural shifts (MSS, CHoCH, CISD), and price imbalances, the ICT Turtle Soup setup enables traders to identify reversal points and key entry zones with high accuracy.
This strategy is highly versatile, making it applicable across markets such as forex, stocks, cryptocurrencies, and futures. It offers traders a robust and systematic approach to understanding price movements and optimizing their trading strategies
🟣 Bullish and Bearish Setups
Bullish Setup : The price first sweeps below a Sell-Side Liquidity (SSL) zone, then reverses upward after forming an MSS or CHoCH, and finally pulls back to an FVG, creating a buying opportunity.
Bearish Setup : The price first sweeps above a Buy-Side Liquidity (BSL) zone, then reverses downward after forming an MSS or CHoCH, and finally pulls back to an FVG, creating a selling opportunity.
🔵 How to Use
To effectively utilize the ICT Turtle Soup trading setup, begin by identifying key liquidity zones, such as recent highs, lows, or support and resistance levels, in higher timeframes.
Then, monitor lower timeframes for a Liquidity Sweep and confirmation of a Market Structure Shift (MSS) or Change of Character (CHoCH).
After the structural shift, the price typically pulls back to an FVG, offering an optimal trade entry point. Below, the bullish and bearish setups are explained in detail.
🟣 Bullish Turtle Soup Setup
Identify Sell-Side Liquidity (SSL) : In a higher timeframe (e.g., 1-hour or 4-hour), identify recent price lows or support levels that serve as SSL zones, typically the location of stop-loss orders for traders.
Observe a Liquidity Sweep : On a lower timeframe (e.g., 15-minute or 30-minute), the price must move below one of these liquidity zones and then reverse. This movement indicates a liquidity sweep.
Confirm Market Structure Shift : After the price reversal, look for a structural shift (MSS or CHoCH) indicated by the formation of a Higher Low (HL) and Higher High (HH).
Enter the Trade : Once the structural shift is confirmed, the price typically pulls back to an FVG. Enter a buy trade in this zone, set a stop-loss slightly below the recent low, and target Buy-Side Liquidity (BSL) in the higher timeframe for profit.
🟣 Bearish Turtle Soup Setup
Identify Buy-Side Liquidity (BSL) : In a higher timeframe, identify recent price highs or resistance levels that serve as BSL zones, typically the location of stop-loss orders for traders.
Observe a Liquidity Sweep : On a lower timeframe, the price must move above one of these liquidity zones and then reverse. This movement indicates a liquidity sweep.
Confirm Market Structure Shift : After the price reversal, look for a structural shift (MSS or CHoCH) indicated by the formation of a Lower High (LH) and Lower Low (LL).
Enter the Trade : Once the structural shift is confirmed, the price typically pulls back to an FVG. Enter a sell trade in this zone, set a stop-loss slightly above the recent high, and target Sell-Side Liquidity (SSL) in the higher timeframe for profit.
🔵 Settings
Higher TimeFrame Levels : This setting allows you to specify the higher timeframe (e.g., 1-hour, 4-hour, or daily) for identifying key liquidity zones.
Swing period : You can set the swing detection period.
Max Swing Back Method : It is in two modes "All" and "Custom". If it is in "All" mode, it will check all swings, and if it is in "Custom" mode, it will check the swings to the extent you determine.
Max Swing Back : You can set the number of swings that will go back for checking.
FVG Length : Default is 120 Bar.
MSS Length : Default is 80 Bar.
FVG Filter : This refines the number of identified FVG areas based on a specified algorithm to focus on higher quality signals and reduce noise.
Types of FVG filter s:
Very Aggressive Filter: Adds a condition where, for an upward FVG, the last candle's highest price must exceed the middle candle's highest price, and for a downward FVG, the last candle's lowest price must be lower than the middle candle's lowest price. This minimally filters out FVGs.
Aggressive Filter: Builds on the Very Aggressive mode by ensuring the middle candle is not too small, filtering out more FVGs.
Defensive Filter: Adds criteria regarding the size and structure of the middle candle, requiring it to have a substantial body and specific polarity conditions, filtering out a significant number of FVGs.
Very Defensive Filter: Further refines filtering by ensuring the first and third candles are not small-bodied doji candles, retaining only the highest quality signals.
In the indicator settings, you can customize the visibility of various elements, including MSS, FVG, and HTF Levels. Additionally, the color of each element can be adjusted to match your preferences. This feature allows traders to tailor the chart display to their specific needs, enhancing focus on the key data relevant to their strategy.
🔵 Conclusion
The ICT Turtle Soup trading setup is a powerful tool in the ICT style, enabling traders to exploit false breakouts in key liquidity zones. By combining concepts of liquidity, liquidity sweeps, market structure shifts (MSS and CHoCH), and pullbacks to FVG, this setup helps traders identify precise reversal points and execute trades with reduced risk and increased accuracy.
With applications across various markets, including forex, stocks, crypto, and futures, and its customizable indicator settings, the ICT Turtle Soup setup is ideal for both beginner and advanced traders. By accurately identifying liquidity zones in higher timeframes and confirming structure shifts in lower timeframes, this setup provides a reliable strategy for navigating volatile market conditions.
Ultimately, success with this setup requires consistent practice, precise market analysis, and proper risk management, empowering traders to make smarter decisions and achieve their trading goals.

ICTProTools | ICT Insight - Momentum Structures🚀 INTRODUCTION
The Momentum Structures Indicator builds upon the principles of ICT (Inner Circle Trader) and Smart Money Concepts (SMC) to give traders a clearer view of market dynamics. These methods reveal how institutional trading activity shapes price movements, particularly through different types of market liquidity.
The indicator is designed to provide traders with advanced insights into market dynamics by focusing on key price imbalances and higher-timeframe structures . By combining these elements, the indicator allows users to analyze price behavior across multiple timeframes, helping them anticipate potential liquidity pools and price reversals. The emphasis on price imbalances and liquidity zones makes it a versatile tool for both intraday and longer-term strategies, providing critical insights for understanding market cycles and potential turning points.
💎 FEATURES
Imbalance Bar Colors / Zones
Imbalances are fundamental components of the ICT methodology, highlighting areas where price accelerates, creating gaps that may indicate a lack of liquidity . These voids often point to potential reversal or continuation zones in the price action.
An imbalance typically arises when supply and demand are out of balance, resulting in a gap between price levels. Traders keep a close eye on these gaps, as they could present opportunities to enter trades when the price revisits them , as they suggest a strong institutional interest.
We can notice two types of imbalances… A Fair Value Gap (FVG) usually forms from three consecutive candles, defining the space between the wicks of the first and last candle. Conversely, a Volume Imbalance (VI) occurs when a gap appears between the opening and closing prices of two consecutive candles. When these imbalances align with FVGs, they offer a well-rounded framework for assessing market strength.
By analyzing both FVGs and VIs together, traders can gain valuable insight into potential price movements and better evaluate the likelihood of continuation or reversal.
This chart illustrates the Fair Value Gaps (FVG) and Volume Imbalances (VI) within the GBPUSD price action. The FVG Bar Color and FVG Zone represent the same Fair Value Gaps, and similarly, the VI Bar Color and VI Zone display the same Volume Imbalances. They highlight areas where rapid price movements have created gaps in the market. These gaps indicate potential zones for trade entries or exits as the price may return to fill them. As we can see on the chart, the major part of imbalances created has already been filled. They constitute really interesting Point of Interest (POI).
The 50% FVG line marks the midpoint of the gap, which is often considered an important level for price action. A clear example appears in the Bearish FVG on the top left, where price first filled it below the midline, creating a small reaction. The price then liquidated this "fake mitigation" by moving just above the midline before beginning its significant downward movement. This demonstrates the crucial role of imbalances and how precisely price interacts with them.
Traders can use this information to identify potential buying or selling opportunities based on the interaction of price with these gaps and volume imbalances, aiding in the development of their trading strategies.
PO3 Candles (Power of Three)
The Power of Three is a critical concept in the ICT methodology that analyzes Higher Timeframe (HTF) candles focusing on the opening price, high wick, low wick, and closing price. This framework helps traders understand the current market cycle, in three phases , and its trading implications.
Accumulation Phase: In this initial phase, the price consolidates around the opening price as the market gathers liquidity. This often signals that larger players are positioning for the next move.
Manipulation Phase: Represented by the candle wicks, this phase indicates the extreme points where liquidity grabs often occur. Observing these wicks helps traders identify the end of the accumulation phase and potential turning points.
Distribution Phase: The candle body reflects a decisive price movement in one direction , following accumulation and manipulation. Traders align with the direction of this phase to capture the “real candle move”.
Our indicator provides you with the valuable capability to integrate the True Day Range, as defined by ICT. This concept, rooted in institutional logic, defines a trading day as starting at 00:00 New York time. You can customize it to match your trading style and analysis needs.
You can also overlay imbalances (FVG and VI) directly onto PO3 Candles, seamlessly combining imbalance detection with high-timeframe price action. This approach gives you a sharper market perspective, uncovering potential turning points with greater clarity.
In summary, PO3 Candles help traders assess the market structure and identify cycle positions on HTF candles, enabling them to make more strategic trading decisions, which allows for better entry and exit timing, avoiding traps, and seizing the best opportunities to capture significant market moves.
This chart illustrates the application of the Power of Three concept to EURUSD price action, highlighting key phases of market behavior.
In this example, we observe the Daily candles, where a significant Bullish imbalance appears from previous days, forming a Fair Value Gap (FVG). Additionally, there’s a small Volume Imbalance (VI) at the candle's opening, signaling liquidity that the price needs to fill.
Now, focusing on the Weekly candle, we can clearly identify its phases. First, there's an accumulation phase around the opening price, which, as shown by the Daily candles, took some time to develop. Then, the manipulation phase occurs, signaled by the upper wick of the Weekly candle, which liquidates the previously created accumulation. It’s time to look for a potential selling position... Finally, the price falls, beginning to form its bearish body and completing the real move of the week.
This framework allows traders to better understand the market structure and make informed decisions based on the current cycle.
Standard Deviation (STD)
The Standard Deviation (STD) is a concept within the ICT methodology that focuses on identifying periods of consolidation within the market. Specifically, it examines the Central Bank Dealers Range (CBDR) , which occurs between 13:00 and 23:00 New York time. During this period, the market often exhibits consolidation , creating an environment where price action stabilizes before making significant moves.
This consolidation forms the basis of the Standard Deviation (STD) concept. This is based on the idea that the volatility observed during this consolidation phase can be used to anticipate future market volatility. Once this consolidation is identified, the STD framework duplicates the established range both above and below the consolidation area.
As price approaches these duplicated levels, it offers traders critical information on where to anticipate potential reactions. If the price nears the upper boundary of the consolidation, it suggests a potential reversal point, indicating an opportunity to consider selling. Conversely, if the price approaches the lower boundary, it may signal an opportunity to look for buying positions . This duplication could enable traders to determine potential high and low points for the trading day or week for example.
Finally, the Standard Deviation (STD) concept provides a valuable framework for identifying potential key reaction points in the market by leveraging consolidation within the CBDR. By duplicating these ranges, traders can anticipate significant price movements and refine their strategies.
This chart illustrates the Standard Deviation (STD) concept applied to EURUSD price action. The highlighted areas in blue indicate high duplications and low duplications derived from the consolidation identified during the Central Bank Dealing Range (CBDR), marked by the dark gray rectangle.
The high duplications represent potential resistance levels, suggesting areas where the price may encounter selling pressure, while the low duplications signify potential support levels, indicating where buying interest could emerge.
The annotations emphasize how price reacts at these duplicated levels, showing the critical role of the STD in determining where price movements may stall or reverse. In this example, the price responded perfectly to both an upward and a downward duplication, confirming that these levels could represent the day's high and low, an observation validated here. This highlights the precision of price movements, with the price stopping exactly at the full duplication levels (but we can not that the price could also have paused at the midline levels, indicated by the dashed gray lines).
This visualization helps traders anticipate potential reactions and align their strategies with market dynamics, ensuring informed decision-making based on established price behavior.
✨ SETTINGS
Imbalance Bar Colors / Zones: Choose to display FVGs, VIs, or both, with customizable color settings. Choose to extend zones or set them to be removed when mitigated.
PO3 Candles: Customize the PO3 Candles for different timeframes (Daily, Weekly, Monthly), including the calculation Mode (Classic or True Day Range) and timezone associated, and set your body, border, and wick preferred colors. The Imbalance Bar Color and FVG Zones can also be displayed on these HTF candles, as they are configured in their settings.
STD: Select the timeframe on which to base it and configure the number of duplications and midline settings. You can also define the time range and timezone related to consolidation detection, giving you control over when and where the STD should apply.
🎯 CONCLUSION
The Momentum Structures Indicator combines the core principles of ICT and Smart Money Concepts to provide traders with advanced tools for understanding market dynamics. By focusing on key elements like imbalances and liquidity zones, it offers a comprehensive framework for analyzing price behavior. This indicator empowers traders to identify key market phases, anticipate potential reversals, and refine their entry and exit points with precision. While its features provide a valuable edge, it’s essential to remember that none should be used on its own and many more factors go into being a profitable trader.
Breakaway Fair Value Gaps [LuxAlgo]The Breakaway Fair Value Gap (FVG) is a typical FVG located at a point where the price is breaking new Highs or Lows.
🔶 USAGE
In the screenshot above, the price range is visualized by Donchian Channels.
In theory, the Breakaway FVGs should generally be a good indication of market participation, showing favor in the FVG's breaking direction. This is a combination of buyers or sellers pushing markets quickly while already at the highest high or lowest low in recent history.
While this described reasoning seems conventional, looking into it inversely seems to reveal a more effective use of these formations.
When the price is pushed to the extremities of the current range, the price is already potentially off balance and over-extended. Then an FVG is created, extending the price further out of balance.
With this in consideration, After identifying a Breakaway FVG, we could logically look for a reversion to re-balance the gap.
However, it would be illogical to believe that the FVG will immediately mitigate after formation. Because of this, the dashboard display for this indicator shows the analysis for the mitigation likelihood and timeliness.
In the example above, the information in the dashboard would read as follows (Bearish example):
Out of 949 Bearish Breakaway FVGs, 80.19% are shown to be mitigated within 60 bars, with the average mitigation time being 13 bars.
The other 19.81% are not mitigated within 60 bars. This could mean the FVG was mitigated after 60 bars, or it was never mitigated.
The unmitigated FVGs within the analysis window will extend their mitigation level to the current bar. We can see the number of bars since the formation is represented to the right of the live mitigation level.
Utilizing the current distance readout helps to better judge the likelihood of a level being mitigated.
Additionally, when considering these mitigation levels as targets, an additional indicator or analysis can be used to identify specific entries, which would further aid in a system's reliability.
🔶 SETTINGS
Trend Length: Sets the (DC) Trend length to use for Identifying Breakaway FVGs.
Show Mitigation Levels: Optionally hide mitigation levels if you would prefer only to see the Breakaway FVGs.
Maximum Duration: Sets the analysis duration for FVGs, Past this length in bars, the FVG is counted as "Un-Mitigated".
Show Dashboard: Optionally hide the dashboard.
Use Median Duration: Display the Median of the Bar Length data set rather than the Average.

Inversion Fair Value Gaps [TradingFinder] IFVG ICT Signal| Alert🔵 Introduction
🟣 Inversion Fair Value Gap (IFVG)
An ICT Inversion Fair Value Gap, or reverse FVG, occurs when a fair value gap fails to hold its price, resulting in the price moving beyond and breaking the gap. This situation marks the initial change in price momentum.
Generally, prices respect fair value gaps and continue in their trend direction. However, when a fair value gap is breached, it transforms into an inversion fair value gap, signaling a potential short-term reversal or a subsequent change in direction.
🔵 How to Use
🟣 Identifying an Inversion Fair Value Gap
To spot an IFVG, you must first identify a fair value gap.
Inversion fair value gaps can be categorized into two types :
🟣 Bullish Inversion Fair Value Gap
A bullish IFVG occurs when a bearish fair value gap is invalidated by the price closing above it.
Steps to identify it :
Identify a bearish fair value gap.
When the price closes above this gap, it becomes a bullish inversion fair value gap.
This gap acts as a support level, pushing the price upwards and indicating a shift in momentum from sellers to buyers.
🟣 Bearish Inversion Fair Value Gap
A bearish IFVG happens when a bullish fair value gap fails, with the price closing below it.
Steps to identify it :
Identify a bullish fair value gap.
When the price closes below this gap, it becomes a bearish inversion fair value gap.
This gap acts as a resistance level, pushing the price downwards and indicating a shift in momentum from buyers to sellers.
🔵 Settings
🟣 Global Settings
Show All Inversion FVG: If disabled, only the most recent FVG will be displayed.
IFVG Validity Period (Bar): Determines the maximum duration (in number of candles) that the FVG and IFVG remain valid.Switching Colors Theme Mode: Includes three modes: "Off", "Light", and "Dark". "Light" mode adjusts colors for light mode use, "Dark" mode adjusts colors for dark mode use, and "Off" disables color adjustments.
🟣 Logic Settings
FVG Filter : This refines the number of identified FVG areas based on a specified algorithm to focus on higher quality signals and reduce noise.
Types of FVG filters :
Very Aggressive Filter : Adds a condition where, for an upward FVG, the last candle's highest price must exceed the middle candle's highest price, and for a downward FVG, the last candle's lowest price must be lower than the middle candle's lowest price. This minimally filters out FVGs.
Aggressive Filte r: Builds on the Very Aggressive mode by ensuring the middle candle is not too small, filtering out more FVGs.
Defensive Filter : Adds criteria regarding the size and structure of the middle candle, requiring it to have a substantial body and specific polarity conditions, filtering out a significant number of FVGs.
Very Defensive Filter : Further refines filtering by ensuring the first and third candles are not small-bodied doji candles, retaining only the highest quality signals.
Mitigation Level FVG and IFVG : Options include "Proximal", "Distal", or "50 % OB" modes, which you can choose based on your needs. The "50 % OB" line is the midpoint between distal and proximal.
🟣 Display Settings
Show Bullish IFVG : Toggles the display of demand-related boxes.
Show Bearish IFVG : Toggles the display of supply-related boxes.
🟣 Alert Settings
Alert Inversion FVG Mitigation : Enables alerts for Inversion FVG mitigation.
Message Frequency : Determines the frequency of alerts. Options include 'All' (every function call), 'Once Per Bar' (first call within the bar), and 'Once Per Bar Close' (final script execution of the real-time bar). Default is 'Once per Bar'.
Show Alert Time by Time Zone : Configures the time zone for alert messages. Default is 'UTC'.
Display More Info : Provides additional details in alert messages, including price range, date, hour, and minute. Set to 'Off' to exclude this information.

Inversion Fair Value Gaps (IFVG) [LuxAlgo]The Inversion Fair Value Gaps (IFVG) indicator is based on the inversion FVG concept by ICT and provides support and resistance zones based on mitigated Fair Value Gaps (FVGs).
🔶 USAGE
Once mitigation of an FVG occurs, we detect the zone as an "Inverted FVG". This would now be looked upon for potential support or resistance.
Mitigation occurs when the price closes above or below the FVG area in the opposite direction of its bias.
Inverted Bullish FVGs Turn into Potential Zones of Resistance.
Inverted Bearish FVGs Turn into Potential Zones of Support.
After the FVG has been mitigated, returning an inversion FVG, a signal is displayed each time the price retests an IFVG zone and breaks below or above (depending on the direction of the FVG).
Keep in mind how IFVGs are calculated and displayed. Once price mitigates an IFVG, all associated graphical elements such as areas, lines, and signals will be deleted.
This indicator is not meant to be just a 'signal indicator'. Backtesting historical signals is incorrect as it does not consider the mitigation of IFVGs, which is a standard method for trading IFVGs & various concepts by ICT.
The signals displayed are meant for real-time analysis of current bars for discretionary analysis. Current confirmed retests of unmitigated IFVGs are still displayed to show which IFVGS have had significant reactions.
🔶 SETTINGS
Show Last: Specifies the number of most recent FVG Inversions to display in Bullish/Bearish pairs, starting at the current and looking back. Max 100 Pairs.
Signal Preference: Allows the user to choose to send signals based on the (Wicks) or (Close) Prices. This can be changed based on user preference.
ATR Multiplier: Filters FVGs based on ATR Width, The script will only detect Inversions that are greater than the ATR * ATR Width.
🔶 ALERTS
This script includes alert options for all signals.
🔹 Bearish Signal
A bearish signal occurs when the price returns to a bearish inversion zone and rejects to the downside.
🔹 Bullish Signal
A bullish signal occurs when the price returns to a bullish inversion zone and bounces out of the top.
