Fair Value Gap DetectorHow this indicator works:
It detects two types of FVGs:
Bullish FVG: Occurs when the low of the current candle is higher than the high of the candle from 2 bars ago (creates an upward gap)
Bearish FVG: Occurs when the high of the current candle is lower than the low of the candle from 2 bars ago (creates a downward gap)
Features:
Allows users to toggle both bullish and bearish FVG detection independently
Customizable colors for both bullish (default green) and bearish (default red) FVGs
Visualizes FVGs using:
Boxes that highlight the gap area (with 80% transparency)
Labels that mark each FVG ("Bull FVG" or "Bear FVG")
Visual representation:
Bullish FVGs are marked with green boxes and downward-pointing labels
Bearish FVGs are marked with red boxes and upward-pointing labels
This indicator can be useful for :
Identifying potential areas where price might return to
Finding potential support and resistance zones
Understanding market structure and momentum shifts
Komut dosyalarını "fvg" için ara

Inversion Fair Value Gap Screener | Flux Charts💎 GENERAL OVERVIEW
Introducing our new Inverse Fair Value Gap Screener! This screener can provide information about the latest Inverse Fair Value Gaps in up to 5 tickers. You can also customize the algorithm that finds the Inverse Fair Value Gaps and the styling of the screener.
Features of the new Inverse Fair Value Gap (IFVG) Screener :
Find Latest Inverse Fair Value Gaps Across 5 Tickers
Shows Their Information Of :
Latest Status
Number Of Retests
Consumption Percent
Volume
Customizable Algorithm / Styling
📌 HOW DOES IT WORK ?
A Fair Value Gap generally occur when there is an imbalance in the market. They can be detected by specific formations within the chart. An Inverse Fair Value Gap is when a FVG becomes invalidated, thus reversing the direction of the FVG.
IFVGs get consumed when a Close / Wick enters the IFVG zone. Check this example:
This screener then finds Fair Value Gaps across 5 different tickers, and shows the latest information about them.
Status ->
Far -> The current price is far away from the IFVG.
Approaching ⬆️/⬇️ -> The current price is approaching the IFVG, and the direction it's approaching from.
Inside -> The price is currently inside the IFVG.
Retests -> Retest means the price tried to invalidate the IFVG, but failed to do so. Here you can see how many times the price retested the IFVG.
Consumed -> IFVGs get consumed when a Close / Wick enters the IFVG zone. For example, if the price hits the middle of the IFVG zone, the zone is considered 50% consumed.
Volume -> Volume of a IFVG is essentially the volume of the bar that broke the original FVG that formed it.
🚩UNIQUENESS
This screener can detect latest Inverse Fair Value Gaps and give information about them for up to 5 tickers. This saves the user time by showing them all in a dashboard at the same time. The screener also uniquely shows information about the number of retests and the consumed percent of the IFVG, as well as it's volume. We believe that this extra information will help you spot reliable IFVGs easier.
⚙️SETTINGS
1. Tickers
You can set up to 5 tickers for the screener to scan Fair Value Gaps here. You can also enable / disable them and set their individual timeframes.
2. General Configuration
FVG Zone Invalidation -> Select between Wick & Close price for FVG Zone Invalidation.
IFVG Zone Invalidation -> Select between Wick & Close price for IFVG Zone Invalidation. This setting also switches the type for IFVG consumption.
Zone Filtering -> With "Average Range" selected, algorithm will find FVG zones in comparison with average range of last bars in the chart. With the "Volume Threshold" option, you may select a Volume Threshold % to spot FVGs with a larger total volume than average.
FVG Detection -> With the "Same Type" option, all 3 bars that formed the FVG should be the same type. (Bullish / Bearish). If the "All" option is selected, bar types may vary between Bullish / Bearish.
Detection Sensitivity -> You may select between Low, Normal or High FVG detection sensitivity. This will essentially determine the size of the spotted FVGs, with lower sensitivities resulting in spotting bigger FVGs, and higher sensitivities resulting in spotting all sizes of FVGs.

perfect timing//@version=6
indicator("perfect timing", overlay=true, max_boxes_count=500, max_labels_count=500, max_lines_count=500)
// ============================
// Réglages généraux
// ============================
string TZ = input.string("Europe/Paris", "Fuseau horaire", options= )
bool showAsia = input.bool(true, "Afficher box Asie")
bool showLond = input.bool(true, "Afficher box Londres")
bool showNY = input.bool(true, "Afficher box New York")
bool showDots = input.bool(true, "Afficher points horaires")
// Mode épuré (FVG + points horaires uniquement)
bool pureMode = input.bool(false, "Mode épuré (FVG + points horaires uniquement)")
// ============================
// Bannière top-centre (personnalisable)
// ============================
bool showBanner = input.bool(true, "Afficher bannière")
string bannerTitle = input.string("CLOWN FX", "Texte ligne 1")
string bannerSubtitle = input.string("PATIENCE | DISCIPLINE | RESPECT PLAN", "Texte ligne 2")
color bannerTextColor = input.color(color.white, "Couleur texte")
string titleSizeSel = input.string("huge", "Taille ligne 1", options= )
string subSizeSel = input.string("large", "Taille ligne 2", options= )
bool showBannerBg = input.bool(false, "Afficher fond bannière")
color bannerBgColor = input.color(color.new(color.gray, 85), "Couleur fond bannière")
color bannerBg = showBannerBg ? bannerBgColor : color.new(color.black, 100)
bool tS = titleSizeSel == "small", tN = titleSizeSel == "normal", tL = titleSizeSel == "large", tH = titleSizeSel == "huge"
bool sS = subSizeSel == "small", sN = subSizeSel == "normal", sL = subSizeSel == "large", sH = subSizeSel == "huge"
var table banner = na
bool bannerOn = showBanner and not pureMode
if bannerOn
if na(banner)
banner := table.new(position.top_center, 1, 2)
else
if not na(banner)
table.delete(banner)
banner := na
if bannerOn and not na(banner) and barstate.islast
if tH
table.cell(banner, 0, 0, bannerTitle, text_color=bannerTextColor, bgcolor=bannerBg, text_halign=text.align_center, text_size=size.huge)
if tL
table.cell(banner, 0, 0, bannerTitle, text_color=bannerTextColor, bgcolor=bannerBg, text_halign=text.align_center, text_size=size.large)
if tN
table.cell(banner, 0, 0, bannerTitle, text_color=bannerTextColor, bgcolor=bannerBg, text_halign=text.align_center, text_size=size.normal)
if tS
table.cell(banner, 0, 0, bannerTitle, text_color=bannerTextColor, bgcolor=bannerBg, text_halign=text.align_center, text_size=size.small)
if sH
table.cell(banner, 0, 1, bannerSubtitle, text_color=bannerTextColor, bgcolor=bannerBg, text_halign=text.align_center, text_size=size.huge)
if sL
table.cell(banner, 0, 1, bannerSubtitle, text_color=bannerTextColor, bgcolor=bannerBg, text_halign=text.align_center, text_size=size.large)
if sN
table.cell(banner, 0, 1, bannerSubtitle, text_color=bannerTextColor, bgcolor=bannerBg, text_halign=text.align_center, text_size=size.normal)
if sS
table.cell(banner, 0, 1, bannerSubtitle, text_color=bannerTextColor, bgcolor=bannerBg, text_halign=text.align_center, text_size=size.small)
// ============================
// Points horaires
// ============================
int secs = timeframe.in_seconds()
bool tfBlackOk = secs == 60 or secs == 180 or secs == 300 or secs == 900 or secs == 1800
bool tfRedBlueOk = tfBlackOk or secs == 3600
int hr = hour(time, TZ)
int mn = minute(time, TZ)
bool hitBlack = tfBlackOk and ((hr == 10 and mn == 30) or (hr == 12 and mn == 30))
bool hitRed = tfRedBlueOk and (mn == 0 and (hr == 2 or hr == 9 or hr == 14))
bool hitBlue = tfRedBlueOk and (mn == 0 and (hr == 16 or hr == 20))
bool isBear = close < open
float nudge = input.float(0.25, "Décalage (en ticks) pour les points", minval=0.0, step=0.05) * syminfo.mintick
float yBody = isBear ? open + nudge : open - nudge
bool effShowDots = pureMode ? true : showDots
bool effShowAsia = pureMode ? false : showAsia
bool effShowLond = pureMode ? false : showLond
bool effShowNY = pureMode ? false : showNY
plotshape(effShowDots and hitBlack ? yBody : na, title="10:30 & 12:30 (TZ)", location=location.absolute, style=shape.circle, size=size.tiny, color=color.new(color.black, 0))
plotshape(effShowDots and hitRed ? yBody : na, title="2:00, 9:00, 14:00 (TZ)", location=location.absolute, style=shape.circle, size=size.tiny, color=color.new(color.red, 0))
plotshape(effShowDots and hitBlue ? yBody : na, title="16:00, 20:00 (TZ)", location=location.absolute, style=shape.circle, size=size.tiny, color=color.new(color.blue, 0))
// ============================
// Sessions (TZ choisi)
// ============================
int yTZ = year(time, TZ)
int mTZ = month(time, TZ)
int dTZ = dayofmonth(time, TZ)
// Asie 01:00–06:00
int asiaStart = timestamp(TZ, yTZ, mTZ, dTZ, 1, 0)
int asiaEnd = timestamp(TZ, yTZ, mTZ, dTZ, 6, 0)
bool inAsia = time >= asiaStart and time <= asiaEnd
bool startAsia = inAsia and not inAsia
bool endAsia = not inAsia and inAsia
var box asiaBox = na
var float asiaHi = na
var float asiaLo = na
if not effShowAsia and not na(asiaBox)
box.delete(asiaBox)
asiaBox := na
asiaHi := na
asiaLo := na
if effShowAsia
if startAsia
asiaHi := high
asiaLo := low
asiaBox := box.new(left=bar_index, top=asiaHi, right=bar_index, bottom=asiaLo, xloc=xloc.bar_index, bgcolor=color.new(color.black, 95), border_color=color.new(color.black, 85), border_width=1)
if inAsia and not na(asiaBox)
asiaHi := math.max(asiaHi, high)
asiaLo := math.min(asiaLo, low)
box.set_right(asiaBox, bar_index)
box.set_top(asiaBox, asiaHi)
box.set_bottom(asiaBox, asiaLo)
if endAsia and not na(asiaBox)
asiaBox := na
asiaHi := na
asiaLo := na
// Londres 08:00–11:00
int londStart = timestamp(TZ, yTZ, mTZ, dTZ, 8, 0)
int londEnd = timestamp(TZ, yTZ, mTZ, dTZ, 11, 0)
bool inLond = time >= londStart and time <= londEnd
bool startLond = inLond and not inLond
bool endLond = not inLond and inLond
var box londBox = na
var float londHi = na
var float londLo = na
if not effShowLond and not na(londBox)
box.delete(londBox)
londBox := na
londHi := na
londLo := na
if effShowLond
if startLond
londHi := high
londLo := low
londBox := box.new(left=bar_index, top=londHi, right=bar_index, bottom=londLo, xloc=xloc.bar_index, bgcolor=color.new(color.orange, 90), border_color=color.new(color.orange, 85), border_width=1)
if inLond and not na(londBox)
londHi := math.max(londHi, high)
londLo := math.min(londLo, low)
box.set_right(londBox, bar_index)
box.set_top(londBox, londHi)
box.set_bottom(londBox, londLo)
if endLond and not na(londBox)
londBox := na
londHi := na
londLo := na
// New York 13:00–16:00
int nyStart = timestamp(TZ, yTZ, mTZ, dTZ, 13, 0)
int nyEnd = timestamp(TZ, yTZ, mTZ, dTZ, 16, 0)
bool inNY = time >= nyStart and time <= nyEnd
bool startNY = inNY and not inNY
bool endNY = not inNY and inNY
var box nyBox = na
var float nyHi = na
var float nyLo = na
if not effShowNY and not na(nyBox)
box.delete(nyBox)
nyBox := na
nyHi := na
nyLo := na
if effShowNY
if startNY
nyHi := high
nyLo := low
nyBox := box.new(left=bar_index, top=nyHi, right=bar_index, bottom=nyLo, xloc=xloc.bar_index, bgcolor=color.new(color.green, 90), border_color=color.new(color.green, 85), border_width=1)
if inNY and not na(nyBox)
nyHi := math.max(nyHi, high)
nyLo := math.min(nyLo, low)
box.set_right(nyBox, bar_index)
box.set_top(nyBox, nyHi)
box.set_bottom(nyBox, nyLo)
if endNY and not na(nyBox)
nyBox := na
nyHi := na
nyLo := na
// ============================
// Midnight Open (NY optionnel)
// ============================
bool useNYMidnight = input.bool(false, "Midnight Open calé sur New York (00:00 NY)")
int midWidth = input.int(1, "Épaisseur Midnight Open", minval=1, maxval=4)
int midAlpha = input.int(15, "Transparence Midnight Open (0 opaque, 100 invisible)", minval=0, maxval=100)
color midBase = input.color(color.rgb(64, 64, 64), "Couleur Midnight Open (base)")
color midColor = color.new(midBase, midAlpha)
int yNY = year(time, "America/New_York")
int mNY = month(time, "America/New_York")
int dNY = dayofmonth(time, "America/New_York")
int midStart = timestamp(TZ, yTZ, mTZ, dTZ, 6, 0) // 6:00 Paris
if useNYMidnight
midStart := timestamp("America/New_York", yNY, mNY, dNY, 0, 0)
int midCut = timestamp(TZ, yTZ, mTZ, dTZ, 13, 0)
bool startMid = time >= midStart and nz(time , 0) < midStart
bool endMid = time > midCut and nz(time , 0) <= midCut
var line midLine = na
var float midPrice = na
if pureMode and not na(midLine)
line.delete(midLine)
midLine := na
midPrice := na
if not pureMode
if startMid
midPrice := open
midLine := line.new(bar_index, midPrice, bar_index, midPrice, xloc=xloc.bar_index, extend=extend.none, color=midColor, width=midWidth)
if not na(midLine)
if time <= midCut
line.set_x2(midLine, bar_index)
line.set_y1(midLine, midPrice)
line.set_y2(midLine, midPrice)
if endMid
line.set_extend(midLine, extend.none)
midLine := na
midPrice := na
// ============================
// FVG (haussier BLEU / baissier ROUGE)
// ============================
bool showFVG = input.bool(true, "Afficher FVG")
color fvgBullColor = input.color(color.new(color.rgb(0, 102, 255), 80), "Couleur FVG haussier (bleu)")
color fvgBearColor = input.color(color.new(color.red, 80), "Couleur FVG baissier (rouge)")
int fvgExtendBars = input.int(0, "Extension FVG (barres)", minval=0, maxval=500)
bool fvgUseMinWidth = input.bool(false, "Filtre largeur minimale")
string fvgMethod = input.string("Points", "Méthode largeur", options= )
float fvgMinWidth = input.float(0.0, "Largeur mini (selon méthode)", minval=0.0, step=0.1)
int fvgATRlen = input.int(200, "ATR pour filtre (si ATR)", minval=1)
bool fvgShowMidline = input.bool(true, "Tracer médiane FVG")
int fvgLineWidth = input.int(1, "Épaisseur médiane", minval=1, maxval=3)
color fvgBullLineCol = input.color(color.rgb(0, 102, 255), "Couleur médiane haussière (bleu)")
color fvgBearLineCol = input.color(color.red, "Couleur médiane baissière (rouge)")
bool effShowFVG = pureMode ? true : showFVG
float atrFVG = ta.atr(fvgATRlen)
int n = bar_index
fvgWidthOK(top, btm) =>
float dist = top - btm
if not fvgUseMinWidth
true
else
if fvgMethod == "Points"
dist > fvgMinWidth
else if fvgMethod == "%"
btm != 0 and dist / btm * 100 > fvgMinWidth
else
dist > atrFVG * fvgMinWidth
// Bullish FVG: low > high
float bullTop = low
float bullBtm = high
bool bullCond = effShowFVG and not na(bullBtm) and bullTop > bullBtm and fvgWidthOK(bullTop, bullBtm)
// Bearish FVG: high < low
float bearTop = low
float bearBtm = high
bool bearCond = effShowFVG and not na(bearTop) and bearBtm < bearTop and fvgWidthOK(bearTop, bearBtm)
if bullCond
box.new(n-2, bullTop, n + fvgExtendBars, bullBtm, border_color=na, bgcolor=fvgBullColor)
if fvgShowMidline
float midB = math.avg(bullTop, bullBtm)
line.new(n-2, midB, n + fvgExtendBars, midB, color=fvgBullLineCol, width=fvgLineWidth)
if bearCond
box.new(n-2, bearTop, n + fvgExtendBars, bearBtm, border_color=na, bgcolor=fvgBearColor)
if fvgShowMidline
float midS = math.avg(bearTop, bearBtm)
line.new(n-2, midS, n + fvgExtendBars, midS, color=fvgBearLineCol, width=fvgLineWidth)
// ============================
// Sticky Notes (fond BLANC + texte NOIR, table dynamique)
// ============================
bool showNotes = input.bool(true, "Afficher Sticky Notes")
string notesPosSel = input.string("Top Right", "Position Notes", options= )
string notesTitle = input.string("Notes", "Nom du panneau")
string iconChecked = input.string("✅", "Icône coché")
string iconEmpty = input.string("⬜", "Icône vide")
// Par défaut: noir sur blanc
color noteClrTitle = input.color(color.black, "Couleur titre (Notes)")
color noteClrText = input.color(color.black, "Couleur texte")
color noteClrBg = input.color(color.white, "Couleur fond")
color noteClrGreen = input.color(#4caf50, "Couleur validé")
color noteClrDue = input.color(#ff5252, "Couleur en retard")
groupNote(id) => "Note " + str.tostring(id)
// Note 1
bool n_on_1 = input.bool(true, "Activer", group=groupNote(1), inline="n1a")
string n_t1 = input.string("1st Note", "", group=groupNote(1), inline="n1a")
bool n_d1 = input.bool(true, "Done", group=groupNote(1), inline="n1a")
string n_c1 = input.text_area("This is my first note", "", group=groupNote(1))
bool n_h1 = input.bool(false, "Avec échéance", group=groupNote(1), inline="n1b")
int n_dt1 = input.time(timestamp("31 Dec 2024 00:00"), "Due", group=groupNote(1), inline="n1b")
// Note 2
bool n_on_2 = input.bool(true, "Activer", group=groupNote(2), inline="n2a")
string n_t2 = input.string("2nd Task", "", group=groupNote(2), inline="n2a")
bool n_d2 = input.bool(false, "Done", group=groupNote(2), inline="n2a")
string n_c2 = input.text_area("Serious task with due date.", "", group=groupNote(2))
bool n_h2 = input.bool(true, "Avec échéance", group=groupNote(2), inline="n2b")
int n_dt2 = input.time(timestamp("31 Dec 2028 00:00"), "Due", group=groupNote(2), inline="n2b")
// Note 3
bool n_on_3 = input.bool(true, "Activer", group=groupNote(3), inline="n3a")
string n_t3 = input.string("Forgot something", "", group=groupNote(3), inline="n3a")
bool n_d3 = input.bool(false, "Done", group=groupNote(3), inline="n3a")
string n_c3 = input.text_area("I forgot something... again.", "", group=groupNote(3))
bool n_h3 = input.bool(true, "Avec échéance", group=groupNote(3), inline="n3b")
int n_dt3 = input.time(timestamp("31 Jan 2024 00:00"), "Due", group=groupNote(3), inline="n3b")
// Note 4
bool n_on_4 = input.bool(false, "Activer", group=groupNote(4), inline="n4a")
string n_t4 = input.string("4th Note", "", group=groupNote(4), inline="n4a")
bool n_d4 = input.bool(false, "Done", group=groupNote(4), inline="n4a")
string n_c4 = input.text_area("", "", group=groupNote(4))
bool n_h4 = input.bool(false, "Avec échéance", group=groupNote(4), inline="n4b")
int n_dt4 = input.time(timestamp("31 Dec 2024 00:00"), "Due", group=groupNote(4), inline="n4b")
// Note 5
bool n_on_5 = input.bool(true, "Activer", group=groupNote(5), inline="n5a")
string n_t5 = input.string("5th Note", "", group=groupNote(5), inline="n5a")
bool n_d5 = input.bool(false, "Done", group=groupNote(5), inline="n5a")
string n_c5 = input.text_area("Skipped the 4th note because I can!", "", group=groupNote(5))
bool n_h5 = input.bool(false, "Avec échéance", group=groupNote(5), inline="n5b")
int n_dt5 = input.time(timestamp("31 Dec 2024 00:00"), "Due", group=groupNote(5), inline="n5b")
// Note 6
bool n_on_6 = input.bool(true, "Activer", group=groupNote(6), inline="n6a")
string n_t6 = input.string("Let's meeek money!", "", group=groupNote(6), inline="n6a")
bool n_d6 = input.bool(true, "Done", group=groupNote(6), inline="n6a")
string n_c6 = input.text_area("Done already? Coffee time.", "", group=groupNote(6))
bool n_h6 = input.bool(false, "Avec échéance", group=groupNote(6), inline="n6b")
int n_dt6 = input.time(timestamp("31 Dec 2024 00:00"), "Due", group=groupNote(6), inline="n6b")
// Tableaux typés
var bool NS_on = array.new_bool(6)
var string NS_tt = array.new_string(6)
var bool NS_dn = array.new_bool(6)
var string NS_cm = array.new_string(6)
var bool NS_hd = array.new_bool(6)
var int NS_dt = array.new_int(6)
array.set(NS_on, 0, n_on_1), array.set(NS_on, 1, n_on_2), array.set(NS_on, 2, n_on_3), array.set(NS_on, 3, n_on_4), array.set(NS_on, 4, n_on_5), array.set(NS_on, 5, n_on_6)
array.set(NS_tt, 0, n_t1 ), array.set(NS_tt, 1, n_t2 ), array.set(NS_tt, 2, n_t3 ), array.set(NS_tt, 3, n_t4 ), array.set(NS_tt, 4, n_t5 ), array.set(NS_tt, 5, n_t6 )
array.set(NS_dn, 0, n_d1 ), array.set(NS_dn, 1, n_d2 ), array.set(NS_dn, 2, n_d3 ), array.set(NS_dn, 3, n_d4 ), array.set(NS_dn, 4, n_d5 ), array.set(NS_dn, 5, n_d6 )
array.set(NS_cm, 0, n_c1 ), array.set(NS_cm, 1, n_c2 ), array.set(NS_cm, 2, n_c3 ), array.set(NS_cm, 3, n_c4 ), array.set(NS_cm, 4, n_c5 ), array.set(NS_cm, 5, n_c6 )
array.set(NS_hd, 0, n_h1 ), array.set(NS_hd, 1, n_h2 ), array.set(NS_hd, 2, n_h3 ), array.set(NS_hd, 3, n_h4 ), array.set(NS_hd, 4, n_h5 ), array.set(NS_hd, 5, n_h6 )
array.set(NS_dt, 0, n_dt1 ), array.set(NS_dt, 1, n_dt2 ), array.set(NS_dt, 2, n_dt3 ), array.set(NS_dt, 3, n_dt4 ), array.set(NS_dt, 4, n_dt5 ), array.set(NS_dt, 5, n_dt6 )
// Position
getNotesPos(s) =>
s == "Top Left" ? position.top_left :
s == "Top Center" ? position.top_center :
s == "Top Right" ? position.top_right :
s == "Middle Left" ? position.middle_left :
s == "Middle Center" ? position.middle_center :
s == "Middle Right" ? position.middle_right :
s == "Bottom Left" ? position.bottom_left :
s == "Bottom Center" ? position.bottom_center : position.bottom_right
// Table dynamique (zéro zone blanche quand des notes sont OFF)
int NOTES_COLS = 3
var table notesTbl = na
bool notesOn = showNotes and not pureMode
rowsNeeded() =>
int r = 0
r += 1 // titre "Notes"
r += 1 // séparateur top
for i = 0 to 5
if array.get(NS_on, i)
r += 1 // ligne icône + titre
if array.get(NS_hd, i)
r += 1 // ligne date/compte à rebours
r += 1 // ligne commentaire
r += 1 // séparateur
r
if notesOn and barstate.islast
int NOTES_ROWS = math.max(rowsNeeded(), 2)
if not na(notesTbl)
table.delete(notesTbl)
notesTbl := table.new(getNotesPos(notesPosSel), NOTES_COLS, NOTES_ROWS)
int row = 0
// En-tête
table.cell(notesTbl, 0, row, notesTitle, text_size=size.large, text_color=noteClrTitle, bgcolor=noteClrBg, text_halign=text.align_left)
table.merge_cells(notesTbl, 0, row, 2, row)
row += 1
table.cell(notesTbl, 0, row, "", bgcolor=color.new(color.gray, 85), height=0.1)
table.merge_cells(notesTbl, 0, row, 2, row)
row += 1
// Corps
for i = 0 to 5
if not array.get(NS_on, i)
continue
bool done = array.get(NS_dn, i)
bool hasD = array.get(NS_hd, i)
int due = array.get(NS_dt, i)
string tit = array.get(NS_tt, i)
string com = array.get(NS_cm, i)
table.cell(notesTbl, 0, row, done ? iconChecked : iconEmpty, text_color=done ? noteClrGreen : noteClrDue, text_size=size.normal, bgcolor=noteClrBg)
table.cell(notesTbl, 1, row, tit, text_color=noteClrTitle, text_size=size.large, text_halign=text.align_left, bgcolor=noteClrBg)
table.merge_cells(notesTbl, 1, row, 2, row)
row += 1
if hasD
bool is_due = timenow >= due and not done
color clr = is_due ? noteClrDue : done ? noteClrGreen : noteClrText
string txt_due = is_due ? "Overdue!" : done ? "" : str.format("{0} days left", math.floor((due - timenow) / 8.64e7))
table.cell(notesTbl, 1, row, str.format_time(due, "yyyy-MM-dd"), text_color=clr, text_size=size.small, text_halign=text.align_left, bgcolor=noteClrBg)
table.cell(notesTbl, 2, row, txt_due, text_color=clr, text_size=size.small, text_halign=text.align_center, bgcolor=noteClrBg)
row += 1
table.cell(notesTbl, 0, row, com, text_color=noteClrText, text_size=size.normal, text_halign=text.align_left, bgcolor=noteClrBg)
table.merge_cells(notesTbl, 0, row, 2, row)
row += 1
table.cell(notesTbl, 0, row, "", bgcolor=color.new(color.gray, 85), height=0.1)
table.merge_cells(notesTbl, 0, row, 2, row)
row += 1
else if not notesOn and not na(notesTbl)
table.delete(notesTbl)
notesTbl := na

MirPapa_Library_ICTLibrary "MirPapa_Library_ICT"
GetHTFoffsetToLTFoffset(_offset, _chartTf, _htfTf)
GetHTFoffsetToLTFoffset
@description Adjust an HTF offset to an LTF offset by calculating the ratio of timeframes.
Parameters:
_offset (int) : int The HTF bar offset (0 means current HTF bar).
_chartTf (string) : string The current chart’s timeframe (e.g., "5", "15", "1D").
_htfTf (string) : string The High Time Frame string (e.g., "60", "1D").
@return int The corresponding LTF bar index. Returns 0 if the result is negative.
IsConditionState(_type, _isBull, _level, _open, _close, _open1, _close1, _low1, _low2, _low3, _low4, _high1, _high2, _high3, _high4)
IsConditionState
@description Evaluate a condition state based on type for COB, FVG, or FOB.
Overloaded: first signature handles COB, second handles FVG/FOB.
Parameters:
_type (string) : string Condition type ("cob", "fvg", "fob").
_isBull (bool) : bool Direction flag: true for bullish, false for bearish.
_level (int) : int Swing level (only used for COB).
_open (float) : float Current bar open price (only for COB).
_close (float) : float Current bar close price (only for COB).
_open1 (float) : float Previous bar open price (only for COB).
_close1 (float) : float Previous bar close price (only for COB).
_low1 (float) : float Low 1 bar ago (only for COB).
_low2 (float) : float Low 2 bars ago (only for COB).
_low3 (float) : float Low 3 bars ago (only for COB).
_low4 (float) : float Low 4 bars ago (only for COB).
_high1 (float) : float High 1 bar ago (only for COB).
_high2 (float) : float High 2 bars ago (only for COB).
_high3 (float) : float High 3 bars ago (only for COB).
_high4 (float) : float High 4 bars ago (only for COB).
@return bool True if the specified condition is met, false otherwise.
IsConditionState(_type, _isBull, _pricePrev, _priceNow)
IsConditionState
@description Evaluate FVG or FOB condition based on price movement.
Parameters:
_type (string) : string Condition type ("fvg", "fob").
_isBull (bool) : bool Direction flag: true for bullish, false for bearish.
_pricePrev (float) : float Previous price (for FVG/FOB).
_priceNow (float) : float Current price (for FVG/FOB).
@return bool True if the specified condition is met, false otherwise.
IsSwingHighLow(_isBull, _level, _open, _close, _open1, _close1, _low1, _low2, _low3, _low4, _high1, _high2, _high3, _high4)
IsSwingHighLow
@description Public wrapper for isSwingHighLow.
Parameters:
_isBull (bool) : bool Direction flag: true for bullish, false for bearish.
_level (int) : int Swing level (1 or 2).
_open (float) : float Current bar open price.
_close (float) : float Current bar close price.
_open1 (float) : float Previous bar open price.
_close1 (float) : float Previous bar close price.
_low1 (float) : float Low 1 bar ago.
_low2 (float) : float Low 2 bars ago.
_low3 (float) : float Low 3 bars ago.
_low4 (float) : float Low 4 bars ago.
_high1 (float) : float High 1 bar ago.
_high2 (float) : float High 2 bars ago.
_high3 (float) : float High 3 bars ago.
_high4 (float) : float High 4 bars ago.
@return bool True if swing condition is met, false otherwise.
AddBox(_left, _right, _top, _bot, _xloc, _colorBG, _colorBD)
AddBox
@description Draw a rectangular box on the chart with specified coordinates and colors.
Parameters:
_left (int) : int Left bar index for the box.
_right (int) : int Right bar index for the box.
_top (float) : float Top price coordinate for the box.
_bot (float) : float Bottom price coordinate for the box.
_xloc (string) : string X-axis location type (e.g., xloc.bar_index).
_colorBG (color) : color Background color for the box.
_colorBD (color) : color Border color for the box.
@return box Returns the created box object.
Addline(_x, _y, _xloc, _color, _width)
Addline
@description Draw a vertical or horizontal line at specified coordinates.
Parameters:
_x (int) : int X-coordinate for start (bar index).
_y (int) : float Y-coordinate for start (price).
_xloc (string) : string X-axis location type (e.g., xloc.bar_index).
_color (color) : color Line color.
_width (int) : int Line width.
@return line Returns the created line object.
Addline(_x, _y, _xloc, _color, _width)
Parameters:
_x (int)
_y (float)
_xloc (string)
_color (color)
_width (int)
Addline(_x1, _y1, _x2, _y2, _xloc, _color, _width)
Parameters:
_x1 (int)
_y1 (int)
_x2 (int)
_y2 (int)
_xloc (string)
_color (color)
_width (int)
Addline(_x1, _y1, _x2, _y2, _xloc, _color, _width)
Parameters:
_x1 (int)
_y1 (int)
_x2 (int)
_y2 (float)
_xloc (string)
_color (color)
_width (int)
Addline(_x1, _y1, _x2, _y2, _xloc, _color, _width)
Parameters:
_x1 (int)
_y1 (float)
_x2 (int)
_y2 (int)
_xloc (string)
_color (color)
_width (int)
Addline(_x1, _y1, _x2, _y2, _xloc, _color, _width)
Parameters:
_x1 (int)
_y1 (float)
_x2 (int)
_y2 (float)
_xloc (string)
_color (color)
_width (int)
AddlineMid(_type, _left, _right, _top, _bot, _xloc, _color, _width)
AddlineMid
@description Draw a midline between top and bottom for FVG or FOB types.
Parameters:
_type (string) : string Type identifier: "fvg" or "fob".
_left (int) : int Left bar index for midline start.
_right (int) : int Right bar index for midline end.
_top (float) : float Top price of the region.
_bot (float) : float Bottom price of the region.
_xloc (string) : string X-axis location type (e.g., xloc.bar_index).
_color (color) : color Line color.
_width (int) : int Line width.
@return line or na Returns the created line or na if type is not recognized.
GetHtfFromLabel(_label)
GetHtfFromLabel
@description Convert a Korean HTF label into a Pine Script timeframe string via handler library.
Parameters:
_label (string) : string The Korean label (e.g., "5분", "1시간").
@return string Returns the corresponding Pine Script timeframe (e.g., "5", "60").
IsChartTFcomparisonHTF(_chartTf, _htfTf)
IsChartTFcomparisonHTF
@description Determine whether a given HTF is greater than or equal to the current chart timeframe.
Parameters:
_chartTf (string) : string Current chart timeframe (e.g., "5", "15", "1D").
_htfTf (string) : string HTF timeframe (e.g., "60", "1D").
@return bool True if HTF ≥ chartTF, false otherwise.
CreateBoxData(_type, _isBull, _useLine, _top, _bot, _xloc, _colorBG, _colorBD, _offset, _htfTf, htfBarIdx, _basePoint)
CreateBoxData
@description Create and draw a box and optional midline for given type and parameters. Returns success flag and BoxData.
Parameters:
_type (string) : string Type identifier: "fvg", "fob", "cob", or "sweep".
_isBull (bool) : bool Direction flag: true for bullish, false for bearish.
_useLine (bool) : bool Whether to draw a midline inside the box.
_top (float) : float Top price of the box region.
_bot (float) : float Bottom price of the box region.
_xloc (string) : string X-axis location type (e.g., xloc.bar_index).
_colorBG (color) : color Background color for the box.
_colorBD (color) : color Border color for the box.
_offset (int) : int HTF bar offset (0 means current HTF bar).
_htfTf (string) : string HTF timeframe string (e.g., "60", "1D").
htfBarIdx (int) : int HTF bar_index (passed from HTF request).
_basePoint (float) : float Base point for breakout checks.
@return tuple(bool, BoxData) Returns a boolean indicating success and the created BoxData struct.
ProcessBoxDatas(_datas, _useMidLine, _closeCount, _colorClose)
ProcessBoxDatas
@description Process an array of BoxData structs: extend, record volume, update stage, and finalize boxes.
Parameters:
_datas (array) : array Array of BoxData objects to process.
_useMidLine (bool) : bool Whether to update the midline endpoint.
_closeCount (int) : int Number of touches required to close the box.
_colorClose (color) : color Color to apply when a box closes.
@return void No return value; updates are in-place.
BoxData
Fields:
_isActive (series bool)
_isBull (series bool)
_box (series box)
_line (series line)
_basePoint (series float)
_boxTop (series float)
_boxBot (series float)
_stage (series int)
_isStay (series bool)
_volBuy (series float)
_volSell (series float)
_result (series string)
LineData
Fields:
_isActive (series bool)
_isBull (series bool)
_line (series line)
_basePoint (series float)
_stage (series int)
_isStay (series bool)
_result (series string)

ICT iFVG Detector and Alert [by ote618]Description
This script detects ICT - fair value gaps (FVG) formed by price gaps between Candle 1 and Candle 3, then monitors the next 5 candles for an inverse fair value gap (iFVG).
What It Detects
Bullish FVG: When Candle 1 high is below Candle 3 low (BISI)
Bearish FVG: When Candle 1 low is above Candle 3 high (SIBI)
Once an FVG is detected, the script checks the next 5 candles:
A Bullish FVG becomes a Bearish IFVG if price closes below Candle 1 high
A Bearish FVG becomes a Bullish IFVG if price closes above Candle 1 low
Only the first bar that validates the FVG triggers the transition to an IFVG.
Visual Output
A shaded rectangle is plotted to mark the original FVG zone (from Candle 1 to Candle 3)
Color-coded:
Red for Bearish IFVG (validated Bullish IG)
Green for Bullish IFVG (validated Bearish IG)
The rectangle extends from Candle 1 to the validating bar
Alerts
You can receive alerts when an FVG becomes an IFVG:
Configurable to fire only on selected timeframes (1m, 5m, 15m, 60m)
Alerts include the direction and the chart timeframe
Settings
Enable Alerts For Timeframe: Choose which timeframe(s) trigger alerts
This tool helps traders identify inverse FVGs (iFVG), a useful ICT concept.

Smart Stop-Loss (SSL)Smart Stop-Loss (SSL) Indicator
Overview
The Smart Stop-Loss (SSL) indicator is an advanced risk management tool designed to help traders set dynamic stop-loss levels based on market structure, volatility, and momentum. Unlike traditional fixed stop-loss methods, SSL adapts to changing market conditions, helping to avoid premature exits while protecting capital during true reversals.
Key Features
1. Volatility-Based Adjustments
- Uses Average True Range (ATR) to measure market volatility
- Automatically widens stop-loss during volatile periods and tightens during calm markets
- Customizable ATR multiplier (default: 1.5x) to adjust sensitivity
2. Market Structure Integration
- Identifies significant swing highs and lows to establish support/resistance levels
- Places stop-loss levels beyond these structural points to avoid common stop hunts
3. Fair Value Gap (FVG) Detection
- Identifies imbalances in order flow that often lead to strong directional moves
- Bullish FVG: A gap up where the current high is below previous low
- Bearish FVG: A gap down where the current low is above previous high
4. Smart Stop-Loss Tightening
- Automatically tightens stop-loss when FVGs are mitigated (filled)
- Uses RSI as a momentum filter to prevent premature adjustments
- Creates a trailing effect that locks in profits as trades move favorably
How to Use
For Long Positions:
1. **Entry**: Look for bullish FVG formations (green step line appears)
2. **Stop-Loss Placement**: Set your stop at or slightly below the green step line
3. **Stop Adjustment**: When price closes above the FVG zone and RSI > 50, the stop will automatically tighten
4. **Exit**: Exit the position when price closes below the green line or when your profit target is reached
For Short Positions:
1. **Entry**: Look for bearish FVG formations (red step line appears)
2. **Stop-Loss Placement**: Set your stop at or slightly above the red step line
3. **Stop Adjustment**: When price closes below the FVG zone and RSI < 50, the stop will automatically tighten
4. **Exit**: Exit the position when price closes above the red line or when your profit target is reached
Real-World Examples
Example 1: Trend Continuation
In an uptrend, when a bullish FVG appears, it often indicates institutional buying pressure. The SSL will place a stop below the swing low with an ATR buffer. As price continues upward and mitigates the FVG, the SSL tightens to protect profits while allowing the trend to continue.
Example 2: Avoiding Premature Exits
During normal market fluctuations, traditional fixed stops might get triggered too early. The SSL's adaptive nature accounts for volatility, keeping you in profitable trades longer by positioning stops beyond noise levels.
Example 3: Protecting Against Reversals
When a true reversal occurs, the momentum filter (RSI) will confirm the change in direction, allowing the SSL to maintain wider protection rather than prematurely tightening in a false move.
Tips for Best Results
1. **Timeframe Selection**: Works best on 1H, 4H and daily charts where market structure is more reliable
2. **Combine with Trend Analysis**: Use in conjunction with trend identification tools
3. **ATR Adjustment**: Increase the ATR multiplier for more volatile instruments
4. **Alert Setup**: Configure the built-in alerts to notify you when stop levels are breached
5. **Visual Confirmation**: The labels show exact stop values to help with order placement
Disclaimer
This indicator is provided for informational and educational purposes only. While it uses advanced techniques to determine potential stop-loss levels, no indicator can predict market movements with certainty. Always manage your risk appropriately and never risk more than you can afford to lose. Past performance is not indicative of future results. The developer of this indicator accepts no liability for trading losses incurred from its use. Always test thoroughly on demo accounts before using in live trading.

cd_mtg_CxThis indicator is designed to show discount / premium zones and price gaps (fvg) on the screen within a rule.
Overview:
As it is known, the price continues its movement with swings and uses some zones to continue or reverse its movement. Commonly used of these zones are named by different traders such as supply / demand, order block, suport/ resistance zone. And again, many traders prefer to be involved in the entry when the price determined with the help of market structure reaches the premium / discount zones.
Expectation from the indicator and how it works:
Identify areas where the price is likely to react.
Zones to be determined for this purpose:
1- Discount / premium zones
2- Mitigation zones with price retesting
3- Price gaps (FVG's)
How is it determined?
1- Tracks the price in the higher timeframe it is alignment with, when the price violates the previous candle in the new candle (high/low), the previous candle's zones between top/bottom - middle levels.
high - middle => premium zone
low - middle => discount zone
and displays it on the screen.
2- Mitigation zones: When the price retests the discount/premium zones, those zones appear on the screen by extending to the last bar and are named as mitigation zones in the indicator.
3- Price gaps (FVG's): It is shown on the screen with known rules and higher time frame option.
Zones where the price does not respect are deleted from the display.
Settings:
- HTF for mitigation zones : Alignment high time frame selection
- HTF for FVG zones : Alignment high time frame selection
- Show HTF boxes : Show / hide
- Show Mitigation zones : Show / hide
- Show Discount/Premium zones: Show / hide
- Show FVG zones : Show / hide
And colors….
Screenshots and example :
The 15m chart is open on the screen and I select the alignment time zone H4. I select the higher time zone H1 in FVGs.
Screenshot with Show HTF boxes and Show FVG zones selected:
With show discount / premium zones selected :
With show mitigation zones selected :
Final Word : When the price comes to our zone, we take action together with other confirmations.
Our expectation from the zones is to send the price back to the region it came from.
If it is not successful, we should plan a reverse transaction.
Cheerful trades...
-- Türkçe Açıklama
Bu indikatör, bir kural dahilinde ucuzluk / pahalılık bölgelerini ve fiyat boşluklarını (fvg) ekranda göstermek ve traderlara en uygun yerde işlem fırsatı sunmak üzere tasarlanmıştır.
Genel Bakış :
Bilindiği gibi fiyat hareketine salınımlarla devam eder ve hareketine devam etmek ya da tersine dönmek için bazı bölgeleri kullanır. Bu bölgelerin yaygın şekilde kullanılanları supply / demand, order block , support /resistance zone gibi farklı ekollerce adlandırılmıştır. Ve yine birçok trader market yapısı yardımla belirlediği fiyatın ucuzluk / pahalılık bölgelerine gelmesiyle işleme dahil olmayı tercih eder.
İndikatörden beklenti ve nasıl çalışır:
Beklenti; Fiyatın tepki alması muhtemel bölgeleri belirlemesidir.
Bu amaçla belirleyeceği bölgeler:
1- Ucuzluk / pahalılık bölgeleri
2- Fiyatın tekrar test etmesiyle “mitigasyon bölgeleri/mitige”
3- Fiyat boşlukları (FVG ler)
Nasıl belirler ?
1- Fiyatı uyumlu olduğu üst zaman diliminde takip eder, fiyat yeni mumda bir önceki mumu ihlal ettiğinde (high/low), önceki mumun tepe/dip - orta seviyeleri arasında kalan bölgeleri
high - middle => premium zone
low - middle => discount zone
olarak belirler ve ekranda gösterir.
2- Mitigasyon bölgesi: Fiyat ucuzluk/ pahalılık bölgeleri yeniden test ettiğinde, o bölgeler son bara uzatılarak ekranda görünür ve indikatörde ismi “mitigation zone” olarak geçer.
3- Fiyat boşlukları (FVG) : Bilinen kurallarla ve üst zaman dilimi seçeneğiyle ekranda gösterilir.
Fiyatın saygı göstermediği bölgeler ekrandan silinir.
Ayarlar:
- HTF for mitigation zones : Uyumlu üst zaman dilimi seçimi
- HTF for FVG zones : Uyumlu üst zaman dilimi seçimi
Gösterim ve renk seçenekleri.
Ekran görüntüleri ve örnek : (İngilizce kısımda)
Son söz : Fiyat bölgemize geldiğinde diğer konfirmelerle birlikte işlem alıyoruz.
Bölgelerden beklentimiz fiyatı geldiği bölgeye tekrar göndermesidir.
Eğer başarılı olamazsa tersi yönde işlem planlamalıyız.
Neşeli tradeler...

Flux Charts - PAT Automation💎 GENERAL OVERVIEW
The PAT Automation is a powerful and versatile tool designed to help traders rigorously test their trading strategies against historical market data. With an array of advanced settings, traders can fine-tune their strategies, assess performance, and identify key improvements before deploying in live trading environments. This backtester offers a wide range of configurable settings, explained within this write-up.
Features of the PAT Automation:
Step By Step : Configure your strategy step by step, which will allow you to have OR & AND logic in your strategies.
Highly Configurable : Offers multiple parameters for fine-tuning trade entry and exit conditions.
Multi-Timeframe Analysis : Allows traders to analyze multiple timeframes simultaneously for enhanced accuracy.
Provides advanced stop-loss, take-profit, and break-even settings.
Incorporates volume-based conditions, liquidity grabs , order blocks , market structures and fair value gaps for refined strategy execution.
🚩 UNIQUENESS
The PAT Automation stands out from conventional backtesting tools due to its unparalleled flexibility, precision, and advanced trading logic integration. Key factors that make it unique include:
✅ Comprehensive Strategy Customization – Unlike traditional backtesters that offer basic entry and exit conditions, PAT Automation provides a highly detailed parameter set, allowing traders to fine-tune their strategies with precision.
✅ Multi-Timeframe Price Action Features – This is the first-ever tool that allows traders to backtest price action with multi-timeframe features such as Fair Value Gaps (FVGs), Inversion Fair Value Gaps (IFVGs), Order Blocks & Breaker Blocks.
✅ Customizable Take-Profit Conditions – Offers various methods to set take-profit exits, including using core features from price action, and fixed exits like ATR, % change or price change, enabling traders to tailor their exit strategies to specific market behaviors.
✅ Customizable Stop-Loss Conditions – Provides several ways to set up stop losses, including using concepts from price action and trailing stops or fixed exits like ATR, % change or price change, allowing for dynamic risk management tailored to individual strategies.
✅ Integration of External Indicators – Allows the inclusion of other indicators or data sources from TradingView for creating strategy conditions, enabling traders to enhance their strategies with additional insights and data points.
By integrating these advanced features, PAT Automation ensures that traders can rigorously test and optimize their strategies with great accuracy and efficiency.
📌 HOW DOES IT WORK?
The first setting you will want to set it the pyramiding setting. This setting controls the number of simultaneous trades in the same direction allowed in the strategy. For example, if you set it to 1, only one trade can be active in any time, and the second trade will not be entered unless the first one is exited. If it is set to 2, the script will handle both of them at the same time. Note that you should enter the same value to this pyramiding setting, and the pyramiding setting in the "Properties" tab of the script for this to work.
For deep backtesting, you can set "Max Distance To Last Bar" to "Unlimited". If you encounter any memory issues, try decreasing this setting to a lower value.
You can enable and set a backtesting window that will limit the entries to between the start date & end date.
Then, you can enter your desired settings to Price Action features like FVGs, IFVGs, Order Blocks, Breaker Blocks, Liquidity Grabs, Market Structures, EQH & EQL and Volume Imbalances. You can also enable and set up to 3 timeframes, which you can use later on when customizing your strategies enter / exit conditions.
Entry Conditions
From the "Long Conditions" or the "Short Conditions" groups, you can set your position entry conditions. For settings like "initial capital" or "order size", you can open the "Properties" tab, where these are handled.
The PAT Automation can use the following conditions for entry conditions :
1. Order Block (OB)
Detection: Triggered when an Order Block forms or is detected
Retest: Triggered when price retests an Order Block. A retest is confirmed when a candle enters an Order Block and closes outside of it.
Retracement: Triggered when price touches an Order Block
Break: Triggered when an Order Block is invalidated by candle close or wick, depending on the user's input.
2. Breaker Block (BB)
Detection: Triggered when a Breaker Block forms or is detected
Retest: Triggered when price retests a Breaker Block. A retest is confirmed when a candle enters a Breaker Block and closes outside of it.
Retracement: Triggered when price touches a Breaker Block
Break: Triggered when a Breaker Block is invalidated by candle close or wick, depending on the user's input.
3. Fair Value Gap (FVG)
Detection: Triggered when an FVG forms or is detected
Retest: Triggered when price retests an FVG. A retest is confirmed when a candle enters an FVG and closes outside of it.
Retracement: Triggered when price touches an FVG
Break: Triggered when an FVG is invalidated by candle close or wick, depending on the user's input.
4. Inversion Fair Value Gap (IFVG)
Detection: Triggered when an IFVG forms or is detected
Retest: Triggered when price retests an IFVG. A retest is confirmed when a candle enters an IFVG and closes outside of it.
Retracement: Triggered when price touches an IFVG
Break: Triggered when an IFVG is invalidated by candle close or wick, depending on the user's input.
5. Break of Structure (BOS)
Detection: Triggered when a BOS forms or is detected
6. Change of Character (CHoCH)
Detection: Triggered when a CHoCH forms or is detected
7. Change of Character Plus (CHoCH+)
Detection: Triggered when a CHoCH+ forms or is detected
8. Volume Imbalance (VI)
Detection: Triggered when a Volume Imbalance forms or is detected
9. Equal High (EQH)
Detection: Triggered when an EQH is detected
10. Equal Low (EQL)
Detection: Triggered when an EQL is detected
11. Buyside Liquidity Grab
Detection: Triggered when a liquidity grab occurs at Buyside Liquidity (BSL).
12. Sellside Liquidity Grab
Detection: Triggered when a liquidity grab occurs at Sellside Liquidity (SSL).
🕒 TIMEFRAME CONDITIONS
The PAT Automation supports Multi-Timeframe (MTF) features, just like the Price Action Toolkit. When setting an entry condition, you can also choose the timeframe.
To set up MTF conditions, navigate to the 'Timeframes' section in the settings, select your desired timeframes, and enable them. You can choose up to three timeframes.
Once you've selected your timeframes, you can use them in your strategy. When setting long and short entry / exit conditions, you can choose from Timeframe 1, Timeframe 2, or Timeframe 3.
External Conditions
Users can use external indicators on the chart to set entry conditions.
The second dropdown in the external condition settings allows you to choose a conditional operator to compare external outputs. Available options include:
Less Than or Equal To: <=
Less Than: <
Equal To: =
Greater Than: >
Greater Than or Equal To: >=
The position entry conditions work like this ;
Each side has 5 Price Action conditions and 1 Source condition. Each condition can be enabled or disabled using the checkbox on the left side.
For Price Action Conditions, you can set a direction: "Any", "Bullish" or "Bearish".
Then a Price Action Feature, like "FVG" or "Order Block".
The last part of our constructed condition is the alert type, which you can select between "Detection", "Retest", "Retracement" or "Break".
Now you should have a constructed condition, which should look like "Bullish Order Block Retest".
You can select which timeframe should this condition work on from Timeframe 1, 2 or 3. If you select "Any Timeframe", the condition will work for all timeframes.
Lastly select the step of this condition from 1 to 6.
The Source Condition
The last condition on each side is a source condition that is different from the others. Using this condition, you can create your own logic using other indicators' outputs on your chart. For example, suppose that you have an EMA indicator in your chart. You can have the source condition to something like "EMA > high".
The Step System
Each condition has a step number, and conditions are in topological order based on them.
The conditions are executed step by step. This means the condition with step 2 cannot be executed before the condition with step 1 is executed.
Conditions with the same step numbers have "OR" logic. This means that if you have 2 conditions with step 3, the condition with step 4 can trigger after only one of the step 3 conditions is executed.
➕ OTHER ENTRY FEATURES
The PAT Automation allows traders to choose when to execute trades and when not to execute trades.
1. Only Take Trades
This setting lets users specify the time period when their strategy can open or execute trades.
2. Don't Take Trades
This setting lets users specify time periods when their strategy can't open or execute trades.
↩️ EXIT CONDITIONS
1. Exit on Opposite Signal
When enabled, a long position will close when short entry conditions are met, and a short position will close when long entry conditions are met.
2. Exit on Session End
When enabled, positions will be closed at the end of the trading session.
📈 TAKE PROFIT CONDITIONS
There are several methods available for setting take profit exits and conditions.
1. Entry Condition TP
Users can use entry conditions as triggers for take-profit exits. This setting can be found under the long and short exit conditions.
2. Fixed TP
Users can set a fixed TP for exits. This setting can be found under the long and short exit conditions. Users can choose between the following:
Price: This method triggers a TP exit when price reaches a specified level. For example, if you set the Price TP to 10 and buy NASDAQ:TSLA at $190, the trade will automatically exit when the price reaches $200 ($190 + $10).
Ticks: This method triggers a TP exit when price moves a specified number of ticks.
Percentage (%): This method triggers a TP exit when price moves a specified percentage.
ATR: This method triggers a TP exit based on a specified multiple of the Average True Range (ATR).
📉 STOP LOSS CONDITIONS
There are several methods available for setting stop-loss exits and conditions.
1. Entry Condition SL
Users can use entry conditions as triggers for stop-loss exits. This setting can be found under the long and short exit conditions.
2. Fixed SL
Users can set a fixed SL for exits. This setting can be found under the long and short exit conditions. Users can choose between the following:
Price: This method triggers a SL exit when price reaches a specified level. For example, if you set the Price SL to 10 and buy NASDAQ:TSLA at $200, the trade will automatically exit when the price reaches $190 ($200 - $10).
Ticks: This method triggers a SL exit when price moves a specified number of ticks.
Percentage (%): This method triggers a SL exit when price moves a specified percentage.
ATR: This method triggers a SL exit based on a specified multiple of the Average True Range (ATR).
3. Trailing Stop
An explanation & example for the trailing stop feature is present on the write-up within the next section.
Exit conditions have the same logic of constructing conditions like the entry ones. You can construct a Take-Profit Condition & a Stop-Loss Condition. Note that the Take-Profit condition will only work if the position is in profit, regardless of if it's triggered or not. The same applies for the Stop-Loss condition, meaning that it will only work if the position is in loss.
You can also set a Fixed TP & Fixed SL based on the price movement after the position is entered. You have options like "Price", "Ticks", "%", or "Average True Range". For example, you can set a Fixed TP like "5%", and the position will be entered once it moves 5% up in a long position.
Trailing Stop
For the Fixed SL, you also have a "Trailing" stop option, which you can set it's activation level as well. The Trailing stop activation level and it's value are expressed in ticks. Check this scenerio for an example :
We have a ticker with a tick value of $1. Our Trailing Stop is set to 10 ticks and activation level is set to 30 ticks.
We buy 1 contract when the price is $100.
When the price becomes $110, we are in $10 (10 ticks) profit and the trailing stop is now activated.
The current price our stop's on is $110 - $30 (30 ticks), which is the level of $80.
The trailing stop will only move if the price moves up the highest high the price has been after we entered the position.
Let's suppose that price moves up $40 right after our trailing stop is activated. The price will now be $150, and our trailing stop will sit on $150 - $30 (30 ticks) = $120.
If the price is down the $120 level, our stop loss will be triggered.
There is also a "Hard SL" option designed for a backup stop-loss when trailing stops are enabled. You can enable & set this option and if the price goes down before our trailing stop even activates, the position will be exited.
You can also move stop-loss to the break-even (entry price of the position) after a certain profit is achieved using the last setting of the exit conditions. Note that for this to work, you will need to have a Fixed SL set-up.
➕ OTHER EXIT FEATURES
1. Move Stop Loss to Breakeven
This setting allows the strategy to automatically move the SL to Breakeven (BE) when the position is in profit by a certain amount. Users can choose between the following:
Price: This method moves the SL to BE when price reaches a specified level.
Ticks: This method moves the SL to BE when price moves a specified number of ticks.
Percentage (%): This method moves the SL to BE when price moves a specified percentage.
ATR: This method moves the SL to BE when price moves a specified multiple of the Average True Range (ATR).
Example Entry Scenario
To give an example , check this scenario; out conditions are :
LONG CONDITIONS
Bullish Order Block Detection, Step 1
Bullish CHoCH Detection, Step 2
Bullish Volume Imbalance Detection, Step 2
Bullish IFVG Retest, Step 3
First, the strategy needs to detect a Bullish Order Block in order to start working.
After it's detected, now it's looking for either a CHoCH, or a Volume Imbalance to proceed to the next step, the reason for this is that they both have the same step number.
After one of them is detected, the strategy will consistently check all IFVGs for a retest. If the retest occurs, a long position will be entered.
⏰ ALERTS
This indicator uses TradingView's strategy alert system. All entries and exits will be sent as an alert if configured. It's possible to further customize these alerts to your liking. For more information check TradingView's strategy alert customization page: www.tradingview.com
⚙️ SETTINGS
1. Backtesting Settings
Pyramiding: Controls the number of simultaneous trades allowed in the strategy. This setting must have the same value that is entered on the script's properties tab on the settings pane.
Max Distance to Last Bar: Determines the depth of historical data used to prevent memory overload.
Enable Custom Backtesting Period: Restricts backtesting to a specific date range.
Start & End Time Configuration: Define precise start and end dates for historical analysis.
2. Fair Value Gaps Settings
Zone Invalidation: Select between "Wick" and "Close" invalidation.
Filtering: Choose between "Average Range" and "Volume Threshold".
FVG Sensitivity: Ranges from Extreme to Low to detect FVGs with varying strictness.
Allow Gaps: Enables analysis on tickers that have different open-close price gaps.
3. Inversion Fair Value Gaps Settings
Zone Invalidation: Choose between "Wick" and "Close".
4. Order Block Settings
Swing Length: Adjusts the minimum number of bars required for OB formation.
Zone Invalidation Method: Select between "Wick" and "Close".
5. Breaker Block Settings
Zone Invalidation: Set invalidation method as "Wick" or "Close".
6. Liquidity Grabs Settings
Pivot Length: Adjusts the number of bars used to detect liquidity grabs.
Wick-Body Ratio: Defines the proportion of wick-to-body size for liquidity grab detection.
7. Multi-Timeframe Analysis
Enable Up to Three Timeframes: Select and analyze trades across multiple timeframes.
8. Market Structures
Swing Length: Defines the number of bars required for structure shifts.
Includes BOS, CHoCH, CHoCH+ Detection.
9. Equal Highs & Lows
ATR Multiplier: Defines the sensitivity of equal highs/lows detection.
10. Volume Imbalances
Gap Size Sensitivity: Ranges from "Ultra" to "Low".
Disable Overnight Gaps: Filters out volume imbalances occurring due to overnight gaps.
11. Entry Conditions for Long & Short Trades
Multiple Conditions (1-6): Configure up to six independent conditions per trade direction.
Condition Types: Options include Detection, Retest, Retracement, and Break.
Timeframe Specification: Choose between "Any Timeframe", "Timeframe 1", "Timeframe 2", or "Timeframe 3".
Trade Execution Filters: Restrict trades within specific trading sessions.
12. Exit Conditions for Long & Short Trades
Exit on Opposite Signal: Automatically exit trades upon opposite trade conditions.
Exit on Session End: Closes all positions at the end of the trading session.
Multiple Take-Profit (TP) and Stop-Loss (SL) Configurations:
TP/SL based on % move, ATR, Ticks, or Fixed Price.
Hard SL option for additional risk control.
Move SL to BE (Break Even) after a certain profit threshold.

ICT HTF Liquidity Levels /w Alert [MsF]Japanese below / 日本語説明は英文の後にあります。
-------------------------
*This indicator is based on sbtnc's "HTF Liquidity Levels". It's a very cool indicator. thank you.
It has 3 functions: visualization of HTF liquidity (with alert), candle color change when displacement occurs, and MSB (market structure break) line display.
=== Function description ===
1. HTF liquidity (with alert)
Lines visualize the liquidity pools on the HTF bars. Alerts can be set for each TF's line.
Once the price reaches the line, the line is repaint.
To put it plainly, the old line disappears and a new line appears. The line that disappeared remains as a purged line. (It is also possible to hide the purged line with a parameter)
The alert will be triggered at the moment the line disappears. An alert will be issued when you touch the HTF's liquid pools where the loss is accumulated, so you can notice the stop hunting with the alert.
This alert is an original feature of this indicator.
The timeframe of the HTF can't modify. You can get Monthly, weekly, daily and H1 and H4.
Each timeframe displays the 3 most recent lines. By narrowing it down to 3, it is devised to make it easier to see visually. (This indicator original)
2. Displacement
Change the color display of the candlesticks when a bullish candle stick or bearish candle stick is attached. Furthermore, by enabling the "Require FVG" option, you can easily discover the FVG (Fair Value Gap). It is a very useful function for ICT trading.
3. MSB (market structure break)
Displays High/Low lines for the period specified by the parameter. It is useful for discovering BoS & CHoCH/MSS, which are important in ICT trading.
=== Parameter description ===
- HTF LIQUIDITY
- Daily … Daily line display settings (color, line width)
- Weekly … Weekly line display settings (color, line width)
- Monthly … Monthly line display settings (color, line width)
- INTRADAY LIQUIDITY
- 1H … 1H line display settings (color, line width)
- 4H … 4H line display settings (color, line width)
- PURGED LIQUIDITY … Display setting of the line once the candle reaches
- Show Purge Daily … Daily purged line display/non-display setting
- Show Purge Weekly … Weekly purged line display/non-display setting
- Show Purge Monthly … Monthly purged line display/non-display setting
- Show Purge 1H … 1H purged line display/non-display setting
- Show Purge 4H … 4H purged line display/non-display setting
- MARKET STRUCTURE BREAK - MBS
- Loopback … Period for searching High/Low
- DISPLACEMENT FOR FVG
- Require FVG … Draw only when FVG occurs
- Displacement Type … Displacement from open to close? or from high to low?
- Displacement Length … Period over which to calculate the standard deviation
- Displacement Strength … The larger the number, the stronger the displacement detected
-------------------------
このインジケータはsbtncさんの"HTF Liquidity Levels"をベースに作成しています。
上位足流動性の可視化(アラート付き)、変位発生時のローソク色変更、MSB(market structure break)ライン表示の3つの機能を有します。
<機能説明>
■上位足流動性の可視化
上位足の流動性の吹き溜まり(ストップが溜まっているところ)をラインで可視化します。ラインにはアラートを設定することが可能です。
一度価格がラインに到達するとそのラインは再描画されます。
平たく言うと、今までのラインが消えて新しいラインが出現する。という事です。
消えたラインはpurgeラインとして残ります。(パラメータでpurgeラインを非表示にすることも可能です)
アラートはラインが消える瞬間に発報します。上位足の損切り溜まってるところにタッチするとアラートを発報するので、アラートにてストップ狩りに気づくことができます。
このアラート発報については本インジケータオリジナルの機能となります。
表示可能な上位足のタイムフレームは固定です。月足、週足、日足およびH1とH4を表示することができます。
各タイムフレーム、直近から3つのラインを表示します。3つに絞ることで視覚的に見やすく工夫しています。(本インジケータオリジナル)
■変位発生時のローソク色変更
大きな陽線、陰線を付けた場合に、そのローソク足をカラー表示を変更します。
さらに"Require FVG"オプションを有効にすることで、FVG(Fair Value Gap)を容易に発見することができます。ICTトレードにを行うにあたり大変有用な機能となっています。
■MSB(market structure break)ライン表示
パラメータで指定した期間のHigh/Lowをライン表示します。ICTトレードで重要視しているBoS & CHoCH/MSSの発見に役立ちます。
<パラメータ説明>
- HTF LIQUIDITY
- Daily … 日足ライン表示設定(色、線幅)
- Weekly … 週足ライン表示設定(色、線幅)
- Monthly … 月足ライン表示設定(色、線幅)
- INTRADAY LIQUIDITY
- 1H … 1時間足ライン表示設定(色、線幅)
- 4H … 4時間足ライン表示設定(色、線幅)
- PURGED LIQUIDITY … 一度到達したラインの表示設定
- Show Purge Daily … 日足ライン表示/非表示設定
- Show Purge Weekly … 週足ライン表示/非表示設定
- Show Purge Monthly … 月足ライン表示/非表示設定
- Show Purge 1H … 1時間足ライン表示/非表示設定
- Show Purge 4H … 4時間足ライン表示/非表示設定
- MARKET STRUCTURE BREAK - MBS
- Loopback … High/Lowを探索する期間
- DISPLACEMENT FOR FVG
- Require FVG … FVG発生時のみ描画する
- Displacement Type … openからcloseまでの変位か?highからlowまでの変位か?
- Displacement Length … 標準偏差を計算する期間
- Displacement Strength … 変位の強さ(数字が大きいほど強い変位を検出)

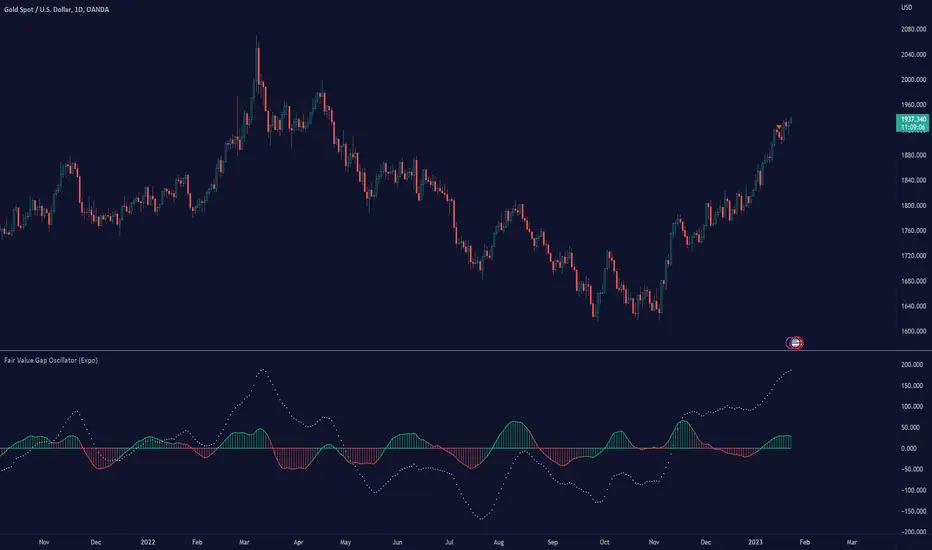
Fair Value Gap Oscillator (Expo)█ Overview
The Fair Value Gap Oscillator (Expo) is an indicator based on the concept of Fair Value Gaps. It is a momentum indicator that helps traders identify mispricings in the market over time. The indicator also incorporates volume and volatility to increase its accuracy further. The indicator can be used in both trending and range-bound markets.
FVG occurs when there is an insufficient amount of buyers and sellers in the market for a particular asset. This can cause a sudden and large gap in the asset price, creating an imbalance in the price. This gap can be large enough to prevent traders from entering the market to take advantage of the price discrepancy. This, in turn, leads to a lack of liquidity and further price volatility.
█ How is the Fair Value Gap Oscialltor calculated?
The Fair Value Gap Oscillator is calculated by using historical Fair Value Gapa, volume, and volatility to determine if the market is trading at a discount or premium relative to its historical fair value. It is based on the idea that prices move in fair value cycles and that by looking at the oscillations of FVG data over time, traders can get a deeper insight into how imbalances impact the price over time.
█ Oscillator Trading
Oscillators are technical indicators that are used to measure momentum within a given market. These indicators measure the speed and magnitude of price movements. Traders use oscillators to identify potential entry and exit points in the market. They may look for overbought and oversold conditions, or they may look for divergence between the price of an asset and its oscillator. When these signals are identified, traders can then enter or exit positions accordingly.
█ How to use
It is a momentum indicator that helps traders identify mispricings in the market over time. In addition, the FVG Oscialltor can be used to identify overbought and oversold conditions in the market, as well as trends and leading trend changes.
Trending Indicator
The Fair Value Gap Oscillator can also be used to identify trends in the market. By tracking the FVG over time, investors can identify whether the market is trending up or down.
Leading Indicator
This indicator can be used to identify leading changes in the market’s momentum and price action. It will indicate beforehand when the momentum decreases and a potential trend change is about to come.
Divergences
Leading Indicators are great for identifying divergences. This Fair Value Gap Oscillator is a powerful yet simple tool to spot divergences in the market.
It is important to remember that the Fair Value Gap Oscillator is just one tool in your investment toolbox. It should be used in conjunction with other smart money concept indicators to identify excellent trading opportunities.
█ Indicator Features
Trend FVG
A Trend FVG feature is added to help Trend Traders get a long-term overview of the FVG trend. This feature can be used for the leading FVG calculation to get a predictive FVG trend.
Leading FVG Calculation
The leading calculation makes the Fair Value Gap oscillator sensitive to fair value changes and becomes more leading.
Trend Line
The Trend line feature is a combination of the leading and the long-term trend that can be used as trend confirmation.
-----------------
Disclaimer
The information contained in my Scripts/Indicators/Ideas/Algos/Systems does not constitute financial advice or a solicitation to buy or sell any securities of any type. I will not accept liability for any loss or damage, including without limitation any loss of profit, which may arise directly or indirectly from the use of or reliance on such information.
All investments involve risk, and the past performance of a security, industry, sector, market, financial product, trading strategy, backtest, or individual's trading does not guarantee future results or returns. Investors are fully responsible for any investment decisions they make. Such decisions should be based solely on an evaluation of their financial circumstances, investment objectives, risk tolerance, and liquidity needs.
My Scripts/Indicators/Ideas/Algos/Systems are only for educational purposes!
Institutional Footprint Marker (MTF) 3.0Institutional Footprint Marker (MTF) 3.0
Indicator Description & Overview
1. Understanding Institutional Buying (IB) and Institutional Selling (IS)
• Concepts:
o Institutional Buying (IB):
Large-scale buying by institutions (e.g., banks, hedge funds, proprietary firms).
Accumulates positions at discounted prices during consolidation or base zones.
Precedes a bullish impulsive move to avoid alerting retail traders.
o Institutional Selling (IS):
Institutions offload holdings at premium prices after price stability (e.g., range or base).
Followed by a bearish impulsive move as they distribute to retail buyers.
• Purpose:
o Identify smart money footprints to align trades with institutional intent.
o Detect zones where institutions accumulate (IB) or distribute (IS) for high-probability setups.
________________________________________
2. SMC + IB/IS: Use & Benefits
• Overview:
o Combines Smart Money Concepts (SMC) with IB/IS zones to track institutional activity.
o Uses SMC signals like Break of Structure (BOS), Change of Character (CHoCH), and liquidity sweeps.
• Benefits:
o Align with Smart Money: Detects institutional accumulation (IB) or distribution (IS) via structure breaks and liquidity traps.
o Refined Entries/Exits: Confirms zone validity using BOS/CHoCH for precise trade timing.
o Filters Fadeouts: Liquidity sweeps validate genuine moves, reducing false signals.
o Higher Accuracy: Combining structure shifts with zone re-entries improves trade precision.
________________________________________
3. Institutional Buying & Selling with SMC: Core Features
• Indicator Overview:
o An advanced price-action-based indicator that identifies IB/IS zones with precision.
o Integrates SMC signals, price structure shifts, and premium/discount logic.
• Key Features:
o IB/IS Zone Achievement Logic:
Tracks price reactions to confirm institutional intent.
Reduces false signals by validating zone quality.
o Auto Fibonacci Mapping:
Plots premium and discount zones based on swing structure.
Identifies optimal entry points within IB/IS zones.
o Zone Visualization:
Displays color-coded, labeled boxes for IB/IS zones.
Ensures clarity in multi-timeframe environments.
o SMC + Zone Combo:
Combines trend logic with zone re-tests for precise reversal/continuation setups.
o Smart Filter Mechanism:
Filters low-quality zones using volume, fakeouts, and structural context.
• Purpose:
o Provides a complete institutional-level toolkit for traders to align with smart money and capture high-probability opportunities.
________________________________________
4. How It Works: Zone Pattern Detection
• Patterns Tracked:
o IBC (Institutional Buy Continue):
Strong bullish impulsive move → brief consolidation → continued bullish trend.
Represents an Institutional Demand Zone.
o IBR (Institutional Buy Reversal):
Bearish move → consolidation base → sharp bullish reversal.
Represents a Reversal Demand Zone.
o ISC (Institutional Sell Continue):
Bearish impulsive move → brief consolidation → continued bearish momentum.
Represents an Institutional Supply Zone.
o ISR (Institutional Sell Reversal):
Bullish move → consolidation → strong bearish reversal.
Represents a Reversal Supply Zone.
• Detection Logic:
o Uses candle formation, strength, volume, and structure logic to identify patterns.
o Pinpoints institutional intent for continuation or reversal setups.
________________________________________
5. Detailed Features of the Indicator
5.1 Trading Mode Logic
• Modes: Manual, Aggressive, Conservative
• Functionality:
o Dynamically adjusts filters (volume multipliers, candle patterns, zone quality) based on mode.
o Conservative Mode: Stricter filters for high-probability setups.
o Aggressive Mode: Looser filters for faster entries.
o Manual Mode: Customizable settings for flexibility.
• Parameters Adjusted:
o Candle body-to-range ratio.
o Volume multipliers.
o SMA-based filters.
• Benefits:
o Eliminates manual tweaking for different trading styles (scalping, swing, investing).
o Avoids overfitting and ensures trades align with smart money interest.
5.2 Base Candle Grouping and Validation
• Feature:
o Accumulates multiple base candles (1–3 or 1–5) before an explosive move.
• Benefit:
o Confirms zone strength by ensuring zones are based on actual accumulation/consolidation, not single weak candles.
5.3 Explosive Candle & Volume Filter
• Feature:
o Identifies explosive breakout candles using:
Candle body-to-range ratio.
ATR-based size threshold.
Above-average volume.
• Benefit:
o Filters out fake breakouts and weak moves for reliable zones.
5.4 Zone Drawing Engine (HTF & LTF)
• Feature:
o Draws colored zones with:
Boxes with borders.
Extension to the right.
Adjustable marking (Wick-to-Wick or Body-to-Wick).
• Benefit:
o Provides visual clarity to spot institutional action instantly.
5.5 Multi-Timeframe Data Management
• Feature:
o Pulls OHLC and volume data from higher timeframes (HTF) and lower timeframes (LTF).
• Benefit:
o Enhances zone accuracy by aligning with broader market context.
5.6 Candle Coloring for Visual Context
• Feature:
o Colors candles based on type:
Bullish Explosive: Green.
Bearish Explosive: Red.
Boring/Base: Blue.
• Benefit:
o Offers visual cues for momentum vs. accumulation phases.
5.7 Auto Entry/SL/TP Plotting with R:R
• Feature:
o Displays:
Entry line with price.
Stop Loss (below/above zone).
Target based on Risk: Reward ratio.
o Extras:
ITM strike price calculation.
Optional % gain/loss label.
• Benefit:
o Enables instant trade planning for options, futures, or intraday setups.
5.8 Zone Achievement & Mitigation Tracking
• Feature:
o Detects price revisits or zone breaks.
o Automatically removes mitigated zones.
• Benefit:
o Keeps charts clean and prevents overtrading invalid zones.
5.9 Premium–Discount Analysis Tools
• Feature:
o Divides zone height into three bands:
Discount: Bottom (buy low).
No-trade Zone: Middle.
Premium: Top (sell high).
• Benefit:
o Refines entry selection for optimal value within zones.
5.10 Label, Border, and Style Controls
• Feature:
o Customizable options for:
Border width, box color, text size.
Toggle labels on/off.
Proximal/distal labeling.
• Benefit:
o Offers UI flexibility for professional or minimalist setups.
________________________________________
6. SMC – CHoCH and BOS Detection Module
• Purpose:
o Detects Change of Character (CHoCH) and Break of Structure (BOS) using swing highs/lows.
o Marks validated institutional demand/supply zones.
• Features:
o Swing High/Low Detection:
Identifies swing points (highest high/lowest low over past candles).
Establishes reference points for structural breaks.
o CHoCH Logic:
Bullish CHoCH: Price breaks above last swing high.
Bearish CHoCH: Price breaks below last swing low.
Signals potential market reversal.
o BOS Logic:
Bullish BOS: Price breaks previous max in an uptrend.
Bearish BOS: Price breaks previous min in a downtrend.
Validates trend continuation for trend-following entries.
o Zone Achievement Marker:
Marks validated IB/IS zones with symbols (e.g., Diamond, Circle) at the Proximal Line.
Indicates high-conviction trade levels.
• Benefits:
o Confirms institutional zones with market structure.
o Enhances trade precision with reversal/continuation signals.
________________________________________
7. Institutional Premium & Discount Detection Module
• Purpose:
o Identifies candles with significant institutional activity using volume spikes, candle body-to-range ratios, and wick analysis.
• Core Logic:
o Detects candles with:
Strong body (large close–open).
Minimal wick interference.
Volume significantly above average.
o Labels candles:
S: Significant volume spikes.
X: Extreme volume spikes.
I: Institutional footprint entries.
X (Low Volume): Volume absorption candles.
• Input Configuration:
o Candle Strength Inputs: Number of candles for volume average (default: 20).
o Volume Multipliers:
Significant: 2.5× average.
Extreme: 3.5× average.
Institutional: 3.5× average.
• Benefits:
o Highlights high-interest institutional candles.
o Differentiates regular activity from aggressive entry points.
________________________________________
8. Smart Money Concept – Structure + FVG + Premium/Discount Zones
• Integrated Features:
o Structure Break Detection (CHoCH/BOS):
Detects highs/lows using user-defined lookback.
Labels as B (Break) or C (Change) for continuation or reversal.
o Fair Value Gap (FVG) Detection:
Identifies bullish/bearish FVGs with auto-mitigation logic.
Marks inefficiency zones for potential smart money re-entries.
o Current Market Structure Display:
Draws real-time high/low structural levels for support/resistance.
o Auto Fibonacci Levels:
Plots customizable levels (e.g., 1.0, 0.78, 0.71, 0.5, 0.0).
Highlights premium (expensive) and discount (cheap) zones.
o Premium/Discount Zone Signals:
Confirms touches at key levels (e.g., 0.71) with FVG and volume validation.
Marks high-probability zones with B (Buy) or S (Sell) labels.
• Benefits:
o Combines volume, structure, and inefficiency logic for high-probability setups.
o Reduces false signals and aids in precise entry/exit planning.
________________________________________
9. Institutional Order Blocks + Fair Value Gaps (FVG)
• Input Settings:
o Toggles for plotting Order Blocks (OB), FVG, and Pivots.
o OB detection modes: Wick-to-Wick, Body-to-Wick, 1–3 candle groups.
o Customizable colors, transparency, and labels.
• OB Detection Logic:
o Bullish OB:
Strong bullish candle + valid OB structure + FVG + volume/delta confirmation.
o Bearish OB:
Same logic in bearish direction.
o OB Types:
OB+/OB-: Significant volume.
OB++/OB--: Extreme volume.
• OB Plotting & Mitigation:
o Plots zones with clear visuals.
o Recolors mitigated OBs and marks with arrows (▼ for Bull OB, ▲ for Bear OB).
• FVG Detection:
o Identifies regular and structure-breaking FVGs.
o Plots as shaded zones with borders.
• Benefits:
o Detects institutional footprints with volume-delta confluence.
o Clearly shows price inefficiencies targeted by smart money.
________________________________________
10. Inside Candle Detection
• Settings:
o Enable Inside Candle Detection: Turns on/off inside candle logic.
o Enable Bar Coloring: Highlights inside candles with a selected color.
o Bar Color: Customizes color for consolidation candles.
• Benefits:
o Visually identifies consolidation zones for breakout setups.
o Enhances clarity in spotting institutional accumulation/distribution.
________________________________________
11. Trend Meter Logic
• Purpose:
o Displays a multi-timeframe trend summary in the top-right corner with arrow symbols.
• Features:
o Enable/Disable: Toggles the trend meter panel.
o Timeframe Selection: Customizable TFs (e.g., Daily, Weekly, Monthly).
o Moving Average Logic: Uses SMA to compare price:
Price > MA → Bullish (▲ green).
Price < MA → Bearish (▼ red).
o Output Display: Table with "Trend" label in green (bullish) or red (bearish).
• Benefits:
o Compact and non-intrusive trend overview.
o Assesses trend alignment across timeframes for better trade decisions.
________________________________________
12. 3-in-1 Colored SMA/EMA
• Features:
o Visibility Controls: Toggle three MAs (short-term, mid-term, long-term).
o Color-Coding:
MA1: Blue (default).
MA2: Gray (default).
MA3: Green (rising), Red (falling).
o Crossover Markers:
MA1 crosses MA2 → Green (+) for bullish, Red (+) for bearish.
• Benefits:
o Customizable and minimalistic trend visualization.
o Highlights momentum shifts for entry/exit triggers.
________________________________________
13. Higher Timeframe Projection Candles View
• Features:
o Projects HTF candles (e.g., Weekly/Monthly) as boxes on LTF charts.
o Supports dual timeframes (e.g., 1W and 1M).
o Smart Shifting: Auto-shifts past candles for new HTF rendering.
o Table Display: Shows status/errors for invalid TF combinations.
o Location Controls: Adjusts gap between TF1 and TF2 for clarity.
• Benefits:
o Aligns micro and macro trends for institutional range analysis.
o Visualizes HTF support/resistance and liquidity zones.
________________________________________
14. No Gaps Candle (Invisible Gap Fill)
• Features:
o Detects bullish/bearish gaps (open vs. close ).
o Filters gaps by minimum % size (default: 3%).
o Fills gaps with transparent candles or colored boxes (Green: bullish, Red: bearish).
o Adjustable opacity and color controls.
• Benefits:
o Smooths chart visuals by filling gaps.
o Tracks liquidity voids for institutional insights.
15. Summary: Why This Indicator is Powerful (Simplified & Deepened)
The IB/IS + SMC Indicator is a game-changer for traders because it combines powerful tools to track smart money (institutional activity) and make trading decisions easier, more accurate, and adaptable to any trading style. Here’s why it stands out, explained simply and deeply:
• Multi-Timeframe Pattern Logic: Understands Institutional Moves Across Charts
o The indicator analyzes price action on multiple timeframes (e.g., 1-minute, 1-hour, daily) to spot where big players like banks and hedge funds are buying (IB) or selling (IS).
o By combining higher timeframe (HTF) context (big-picture trends) with lower timeframe (LTF) precision (entry points), it ensures you’re trading in line with the market’s true direction.
o Why It Matters: This prevents you from being tricked by short-term price noise and aligns your trades with the institutional intent, increasing your win rate.
• Auto Entry, Stop Loss, and Target Planning: Trade Without Guesswork
o The indicator automatically plots entry points, stop losses (SL), and take-profit (TP) levels based on IB/IS zones and Risk:Reward ratios.
o It also shows percentage gain/loss and calculates in-the-money (ITM) strike prices for options or futures trading.
o Why It Matters: You don’t need to manually calculate or draw levels, saving time and reducing errors. It’s like having a pro trader’s blueprint for every trade.
• Mitigation Control: Clean Charts, Focused Trading
o Once a zone is revisited or broken (mitigated), the indicator removes it from the chart to avoid clutter.
o This ensures you only focus on valid, active zones where institutions are still likely to act.
o Why It Matters: A clean chart prevents confusion and stops you from trading outdated or low-probability setups, keeping your strategy sharp.
• Mode-Based Settings: Fits Any Trading Style
o Offers three modes—Conservative, Aggressive, and Manual—to match your trading style (scalping, swing trading, or long-term investing).
o Conservative Mode: Stricter filters for high-confidence trades.
o Aggressive Mode: Faster signals for quick scalping.
o Manual Mode: Lets you customize settings for full control.
o Why It Matters: Whether you’re a fast-paced day trader or a patient investor, the indicator adapts to your needs, making it versatile and user-friendly.
• No Repainting Logic: Trustworthy Signals for Live Trading
o The indicator’s signals don’t change after they appear (no repainting), ensuring reliability in real-time trading.
o It uses real-time data like volume, candle strength, and structure to confirm signals, avoiding false or misleading setups.
o Why It Matters: You can trust the signals to make confident decisions, especially in fast-moving markets, without worrying about the indicator “cheating” by redrawing past signals.
• Combined Power of Tools: A Complete Institutional Trading Toolkit
o The indicator integrates institutional volume analysis (tracking big money moves), market structure detection (CHoCH, BOS), Fair Value Gaps (FVG) (price inefficiencies), premium/discount zones (best entry prices), and mitigation tracking (zone validity).
o Together, these tools create a holistic system that mimics how institutions trade, giving you an edge over retail traders.
o Why It Matters: Instead of juggling multiple indicators, you get one powerful tool that combines everything needed to spot high-probability trades, plan entries/exits, and stay aligned with smart money.
________________________________________
Overall Advantage (Simplified & Deep)
This indicator is like having a smart money GPS for trading. It doesn’t just show you where institutions are buying or selling—it gives you the exact tools to trade alongside them with confidence. By combining multi-timeframe analysis, automatic trade planning, clean chart management, flexible settings, and reliable signals, it simplifies complex institutional strategies into an easy-to-use, all-in-one system. Whether you’re a beginner or a pro, this indicator helps you trade smarter, avoid traps, and capture high-probability opportunities with precision.
Disclaimer:
This indicator is for informational and analytical purposes only and does not provide trade recommendations or financial advice. Trading involves significant risks, and users should conduct their own research, consider their risk tolerance, and consult a financial advisor before making trading decisions. The indicator’s signals are based on historical and real-time data, and past performance does not guarantee future results.
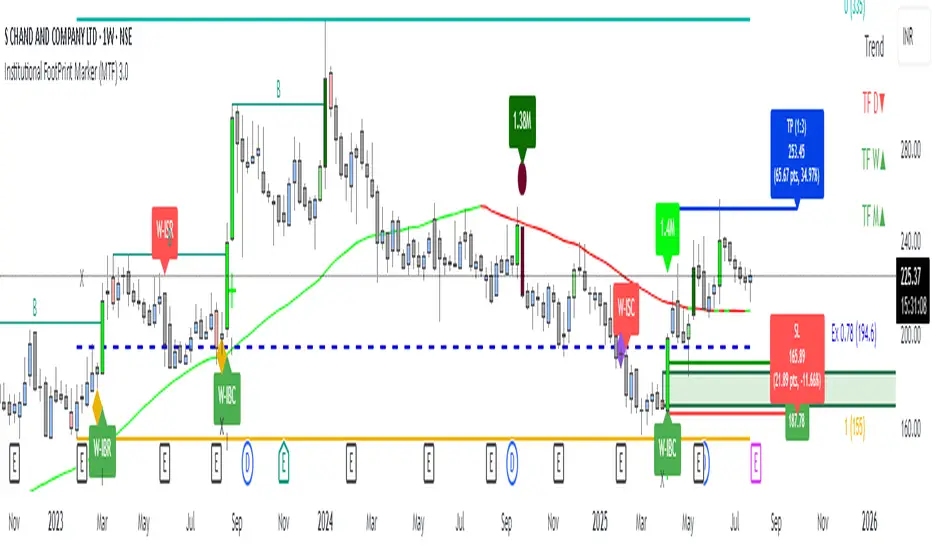
Mech Model - monkertrades x {DeadCatCode}Mech Model - Multi-Timeframe ICT Liquidity & iFVG Trading System
Detailed Methodology & Underlying Concepts
This indicator automates the Inner Circle Trader (ICT) methodology by identifying institutional order flow through liquidity sweeps and inverse Fair Value Gap (iFVG) formations across multiple timeframes.
Core Logic & Calculations
1. Liquidity Level Identification The script tracks four key liquidity pools:
NY session dynamic LQ detection everytime it sweeps high/low Calculates high/low from 18:00-09:30 EST
Session Extremes: Monitors Asia (20:00-23:00), London (02:00-05:00) session highs/lows
Previous Day Levels: Requests PDH/PDL using request.security() with daily timeframe
Dynamic Updates: Liquidity levels update in real-time when swept during NY session
2. Market Structure Analysis
Uses pivot points logic to understand HH.HL parameters
Classifies pivots as Higher Highs (HH), Higher Lows (HL), Lower Highs (LH), Lower Lows (LL)
Stores last 50 pivots for reference in custom PivotPoint type arrays, background calculations to identfy price legs after sweep
3. Fair Value Gap Detection
Bullish FVG: When low > high (gap between candles)
Bearish FVG: When high < low
Stores FVG data including top, bottom, direction, and bar index
Tracks "wicking" - when price touches but doesn't close through FVG
4. Price Leg Formation (Key Innovation) When liquidity is swept:
Bull Leg: Forms after low sweep, connects previous swing high to sweep point
Bear Leg: Forms after high sweep, connects previous swing low to sweep point
Leg remains "active" and extends with continued liquidity breaks
5. iFVG Signal Generation The signal fires when:
An active price leg exists (post-liquidity sweep)
An FVG within the leg range gets "closed through" (not just wicked)
This creates an inverse FVG (iFVG) - the key entry signal
Signal direction matches leg type (bull leg + bull iFVG = buy signal)
6. Multi-Timeframe Synchronization
Uses request.security() to run detection logic on 1m, 2m, 3m, 4m, 5m
All signals display on 1-minute chart via status table
How Traders Use This
Setup Phase: Script identifies when price sweeps overnight/session liquidity
Confirmation: Waits for FVG within the "price leg" to be violated
Entry Signal: iFVG formation provides precise entry point
Target: Typically the next unmitigated FVG on 5-minute timeframe
Key Parameters Users Can Adjust
Session times for different market hours
Visual elements (colors, transparency, line styles)
Timeframe selection (enable/disable 1m-5m)
Wick grace period (0-100 bars)
Signal display mode (triangles vs horizontal lines)
This script essentially automates the manual process ICT traders use to identify institutional footprints through liquidity raids and subsequent rebalancing via FVG mitigation.
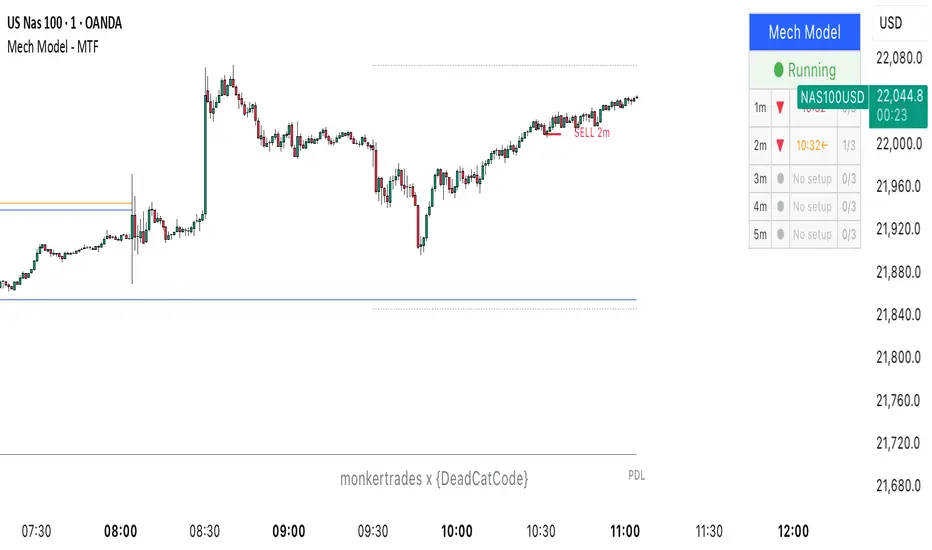
[TehThomas] - Fair Value GapsThis script is designed to automatically detect and visualize Fair Value Gaps (FVGs) on your chart in a clean, intuitive, and highly responsive way. It’s built with active traders in mind, offering both dynamic updates and customization options that help you stay focused on price action without being distracted by outdated or irrelevant information.
What Are Fair Value Gaps?
Fair Value Gaps are areas on a chart where there’s an inefficiency in price, typically formed when price moves aggressively in one direction, leaving a gap between the wicks of consecutive candles. These gaps represent imbalanced price action where not all buy or sell orders were efficiently matched. As a result, they often become magnet zones where price returns later to "fill" the imbalance before continuing in its intended direction. Many traders use them as points of interest for entries, re-entries, or anticipating reversals and consolidations.
This concept is frequently used in Smart Money and ICT-based trading models, where understanding how price seeks efficiency is crucial to anticipating future moves. When combined with concepts like liquidity, displacement, and market structure, FVGs become powerful tools for technical decision-making.
Script Features & Functionality
1. Live Updating Gaps (Dynamic Shrinking)
One of the core features of this script is its ability to track and dynamically shrink Fair Value Gaps as price trades into them. Instead of leaving a static zone on your chart, the gap will adjust in real-time, reflecting the portion that has been filled. This gives you a much more accurate picture of remaining imbalance and avoids misleading zones.
2. Automatic Cleanup After Fill
Once price fully fills an FVG, the script automatically removes it from the chart. This helps keep your workspace clean and focused only on relevant price zones. There’s no need to manually manage your gaps, everything is handled behind the scenes to reduce clutter and distraction.
3. Static Mode Option
While dynamic updating is the default, some traders may prefer to keep the original size of the gap visible even after partial fills. For that reason, the script includes a toggle to switch from live-updating (shrinking) mode to static mode. In static mode, FVGs stay fixed from the moment they are drawn, giving you a more traditional visual reference point.
4. Multi-Timeframe Support (MTF)
You can now view higher timeframe FVGs, such as those from the 1H or 4H chart, while analyzing lower timeframes like the 5-minute. This allows you to see key imbalances from broader market context without having to flip between charts. FVGs from higher timeframes will be drawn distinctly so you can differentiate them at a glance.
5. Cleaner Visualization
The script is designed with clarity in mind. All drawings are streamlined, and filled gaps are removed to maintain a minimal, distraction-free chart. This makes it easier to combine this tool with other indicators or price-action-based strategies without overloading your workspace.
6. Suitable for All Market Types
This script can be used on any asset that displays candlestick-based price action — including crypto, forex, indices, and stocks. Whether you're scalping low-timeframe setups or swing trading with a higher timeframe bias, FVGs remain a useful concept and this script adapts to your trading style.
Use Case Examples
On a 5-minute chart, display 1-hour FVGs to catch major imbalance zones during intraday trading.
Combine the FVGs with liquidity levels and inducement patterns to build ICT-style trade setups.
Use live-updating gaps to monitor in-progress fills and evaluate whether a zone still holds validity.
Set the script to static mode to perform backtesting or visual replay with historical setups.
Final Notes
Fair Value Gaps are not a standalone trading signal, but when used with market structure, liquidity, displacement, and order flow concepts, they provide high-probability trade locations that align with institutional-style trading models. This script simplifies the visualization of those zones so you can react faster, stay focused on clean setups, and eliminate unnecessary distractions.
Whether you’re trading high volatility breakouts or patiently waiting for retracements into unfilled imbalances, this tool is designed to support your edge with precision and flexibility.

SMC+The "SMC+" indicator is a comprehensive tool designed to overlay key Smart Money Concepts (SMC) levels, support/resistance zones, order blocks (OB), fair value gaps (FVG), and trap detection on your TradingView chart. It aims to assist traders in identifying potential areas of interest based on price action, swing structures, and volume dynamics across multiple timeframes. This indicator is fully customizable, allowing users to adjust lookback periods, colors, opacity, and sensitivity to suit their trading style.
Key Components and Functionality
1. Key Levels (Support and Resistance)
This section plots horizontal lines representing support and resistance levels based on highs and lows over three distinct lookback periods, plus daily nearest levels.
Short-Term Lookback Period (Default: 20 bars)
Plots the highest high (short_high) and lowest low (short_low) over the specified period.
Visualized as dotted lines with customizable colors (Short-Term Resistance Color, Short-Term Support Color) and opacity (Short-Term Resistance Opacity, Short-Term Support Opacity).
Adjustment Tip: Increase the lookback (e.g., to 30-50) for less frequent but stronger levels on higher timeframes, or decrease (e.g., to 10-15) for scalping on lower timeframes.
Long-Term Lookback Period (Default: 50 bars)
Plots broader support (long_low) and resistance (long_high) levels using a solid line style.
Customizable via Long-Term Resistance Color, Long-Term Support Color, and their respective opacity settings.
Adjustment Tip: Extend to 100-200 bars for swing trading or major trend analysis on daily/weekly charts.
Extra-Long Lookback Period (Default: 100 bars)
Identifies significant historical highs (extra_long_high) and lows (extra_long_low) with dashed lines.
Configurable with Extra-Long Resistance Color, Extra-Long Support Color, and opacity settings.
Adjustment Tip: Use 200-500 bars for monthly charts to capture macro-level key zones.
Daily Nearest Resistance and Support Levels
Dynamically calculates the nearest resistance (daily_res_level) and support (daily_sup_level) based on the current day’s price action relative to historical highs and lows.
Displayed with Daily Resistance Color and Daily Support Color (with opacity options).
Adjustment Tip: Works best on intraday charts (e.g., 15m, 1h) to track daily pivots; combine with volume profile for confirmation.
How It Works: These levels update dynamically as new highs/lows form, providing a visual guide to potential reversal or breakout zones.
2. SMC Inputs (Smart Money Concepts)
This section identifies swing structures, order blocks, fair value gaps, and entry signals based on SMC principles.
SMC Swing Lookback Period (Default: 12 bars)
Defines the period for detecting swing highs (smc_swing_high) and lows (smc_swing_low).
Adjustment Tip: Increase to 20-30 for smoother swings on higher timeframes; reduce to 5-10 for faster signals on lower timeframes.
Minimum Swing Size (%) (Default: 0.5%)
Filters out minor price movements to focus on significant swings.
Adjustment Tip: Raise to 1-2% for volatile markets (e.g., crypto) to avoid noise; lower to 0.2-0.3% for forex pairs with tight ranges.
Order Block Sensitivity (Default: 1.0)
Scales the size of detected order blocks (OBs) for bullish reversal (smc_ob_bull), bearish reversal (smc_ob_bear), and continuation (smc_cont_ob).
Visuals include customizable colors, opacity, border thickness, and blinking effects (e.g., SMC Bullish Reversal OB Color, SMC Bearish Reversal OB Blink Thickness).
Adjustment Tip: Increase to 1.5-2.0 for wider OBs in choppy markets; keep at 1.0 for precision in trending conditions.
Minimum FVG Size (%) (Default: 0.3%)
Sets the minimum gap size for Fair Value Gaps (fvg_high, fvg_low), displayed as boxes with Fair Value Gap Color and FVG Opacity.
Adjustment Tip: Increase to 0.5-1% for larger, more reliable gaps; decrease to 0.1-0.2% for scalping smaller inefficiencies.
How It Works:
Bullish Reversal OB: Detects a bearish candle followed by a bullish break, marking a potential demand zone.
Bearish Reversal OB: Identifies a bullish candle followed by a bearish break, marking a supply zone.
Continuation OB: Spots strong bullish momentum after a prior high, indicating a continuation zone.
FVG: Highlights bullish gaps where price may retrace to fill.
Entry Signals: Plots triangles (SMC Long Entry) when price retests an OB with a liquidity sweep or break of structure (BOS).
3. Trap Inputs
This section detects potential bull and bear traps based on price action, volume, and key level rejections.
Min Down Move for Bear Trap (%) (Default: 1.0%)
Sets the minimum drop required after a bearish OB to qualify as a trap.
Visualized with Bear Trap Color, Bear Trap Opacity, and blinking borders.
Adjustment Tip: Increase to 2-3% for stronger traps in trending markets; lower to 0.5% for ranging conditions.
Min Up Move for Bull Trap (%) (Default: 1.0%)
Sets the minimum rise required after a bullish OB to flag a trap.
Customizable with Bull Trap Color, Bull Trap Border Thickness, etc.
Adjustment Tip: Adjust similarly to bear traps based on market volatility.
Volume Lookback for Traps (Default: 5 bars)
Compares current volume to a moving average (avg_volume) to filter low-volume traps.
Adjustment Tip: Increase to 10-20 for confirmation on higher timeframes; reduce to 3 for intraday sensitivity.
How It Works:
Bear Trap: Triggers when price drops significantly after a bearish OB but reverses up with low volume or support rejection.
Bull Trap: Activates when price rises after a bullish OB but fails with low volume or resistance rejection.
Boxes highlight trap zones, resetting when price breaks out.
4. Visual Customization
Line Width (Default: 2)
Adjusts thickness of support/resistance lines.
Tip: Increase to 3-4 for visibility on cluttered charts.
Blink On (Default: Close)
Sets whether OB/FVG borders blink based on Open or Close price interaction.
Tip: Use "Open" for intraday precision; "Close" for confirmed reactions.
Colors and Opacity: Each element (OBs, FVGs, traps, key levels) has customizable colors, opacity (0-100), border thickness (1-5 or 1-7), and blink effects for dynamic visualization.
How to Use SMC+
Setup: Apply the indicator to any chart and adjust inputs based on your timeframe and market.
Key Levels: Watch for price reactions at short, long, extra-long, or daily levels for potential reversals or breakouts.
SMC Signals: Look for entry signals (triangles) near OBs or FVGs, confirmed by liquidity sweeps or BOS.
Traps: Avoid false breakouts by monitoring trap boxes, especially near key levels with low volume.
Notes:
This indicator is a visual aid and does not guarantee trading success. Combine it with other analysis tools and risk management strategies.
Performance may vary across markets and timeframes; test settings thoroughly before use.
For optimal results, experiment with lookback periods and sensitivity settings to match your trading style.
The default settings are optimal for 1 minute and 10 second time frames for small cap low float stocks.
Continuation OB are Blue.
Bullish Reversal OB color is Green
Bearish Reversal OB color is Red
FVG color is purple
Bear Trap OB is red with a green border and often appears with a Bearish Reversal OB signaling caution to a short position.
Bull trap OB is green with a Red border signaling caution to a long position.
All active OB area are highlighted and solid in color while other non active OB area are dimmed.
My personal favorite setups are when we have an active bullish reversal with an active FVG along with an active Continuation OB.
Another personal favorite is the Bearish reversal OB signaling an end to a recent uptrend.
The Trap OB detection are also a unique and Original helpful source of information.
The OB have a white boarder by default that are colored black giving a simulated blinking effect when price is acting in that zone.
The Trap OB border are colored with respect to direction of intended trap, all of which can be customized to personal style.
All vaild OB zones are shown compact in size ,a unique and original view until its no longer valid.

Force Volume GradientThis Pine Script is a technical indicator designed for trading platforms, specifically TradingView. It plots the Force Volume Gradient (FVG) and generates buy/sell signals based on the crossover of the FVG line and a signal line.
Key Components:
Force Index: Calculates the exponential moving average (EMA) of the product of the close price and volume.
Force Volume Gradient (FVG): Calculates the EMA of the Force Index.
Signal Line: A simple moving average (SMA) of the FVG.
Buy/Sell Signals: Generated when the FVG line crosses above/below the signal line.
How it Works:
The script calculates the Force Index, which measures the amount of energy or "force" behind price movements.
The FVG is then calculated by applying an EMA to the Force Index, smoothing out the values.
The signal line is a SMA of the FVG, providing a benchmark for buy/sell signals.
When the FVG line crosses above the signal line, a buy signal is generated. Conversely, when the FVG line crosses below the signal line, a sell signal is generated.
Trading Strategy:
This script can be used as a momentum indicator to identify potential buying or selling opportunities. Traders can use the buy/sell signals as entry/exit points, or combine the FVG with other indicators to create a more comprehensive trading strategy.
Customization:
Users can adjust the input parameters, such as the length of the Force Index and signal line, to suit their individual trading preferences.

Price Action Analyst [OmegaTools]Price Action Analyst (PAA) is an advanced trading tool designed to assist traders in identifying key price action structures such as order blocks, market structure shifts, liquidity grabs, and imbalances. With its fully customizable settings, the script offers both novice and experienced traders insights into potential market movements by visually highlighting premium/discount zones, breakout signals, and significant price levels.
This script utilizes complex logic to determine significant price action patterns and provides dynamic tools to spot strong market trends, liquidity pools, and imbalances across different timeframes. It also integrates an internal backtesting function to evaluate win rates based on price interactions with supply and demand zones.
The script combines multiple analysis techniques, including market structure shifts, order block detection, fair value gaps (FVG), and ICT bias detection, to provide a comprehensive and holistic market view.
Key Features:
Order Block Detection: Automatically detects order blocks based on price action and strength analysis, highlighting potential support/resistance zones.
Market Structure Analysis: Tracks internal and external market structure changes with gradient color-coded visuals.
Liquidity Grabs & Breakouts: Detects potential liquidity grab and breakout areas with volume confirmation.
Fair Value Gaps (FVG): Identifies bullish and bearish FVGs based on historical price action and threshold calculations.
ICT Bias: Integrates ICT bias analysis, dynamically adjusting based on higher-timeframe analysis.
Supply and Demand Zones: Highlights supply and demand zones using customizable colors and thresholds, adjusting dynamically based on market conditions.
Trend Lines: Automatically draws trend lines based on significant price pivots, extending them dynamically over time.
Backtesting: Internal backtesting engine to calculate the win rate of signals generated within supply and demand zones.
Percentile-Based Pricing: Plots key percentile price levels to visualize premium, fair, and discount pricing zones.
High Customizability: Offers extensive user input options for adjusting zone detection, color schemes, and structure analysis.
User Guide:
Order Blocks: Order blocks are significant support or resistance zones where strong buyers or sellers previously entered the market. These zones are detected based on pivot points and engulfing price action. The strength of each block is determined by momentum, volume, and liquidity confirmations.
Demand Zones: Displayed in shades of blue based on their strength. The darker the color, the stronger the zone.
Supply Zones: Displayed in shades of red based on their strength. These zones highlight potential resistance areas.
The zones will dynamically extend as long as they remain valid. Users can set a maximum number of order blocks to be displayed.
Market Structure: Market structure is classified into internal and external shifts. A bullish or bearish market structure break (MSB) occurs when the price moves past a previous high or low. This script tracks these breaks and plots them using a gradient color scheme:
Internal Structure: Short-term market structure, highlighting smaller movements.
External Structure: Long-term market shifts, typically more significant.
Users can choose how they want the structure to be visualized through the "Market Structure" setting, choosing from different visual methods.
Liquidity Grabs: The script identifies liquidity grabs (false breakouts designed to trap traders) by monitoring price action around highs and lows of previous bars. These are represented by diamond shapes:
Liquidity Buy: Displayed below bars when a liquidity grab occurs near a low.
Liquidity Sell: Displayed above bars when a liquidity grab occurs near a high.
Breakouts: Breakouts are detected based on strong price momentum beyond key levels:
Breakout Buy: Triggered when the price closes above the highest point of the past 20 bars with confirmation from volume and range expansion.
Breakout Sell: Triggered when the price closes below the lowest point of the past 20 bars, again with volume and range confirmation.
Fair Value Gaps (FVG): Fair value gaps (FVGs) are periods where the price moves too quickly, leaving an unbalanced market condition. The script identifies these gaps:
Bullish FVG: When there is a gap between the low of two previous bars and the high of a recent bar.
Bearish FVG: When a gap occurs between the high of two previous bars and the low of the recent bar.
FVGs are color-coded and can be filtered by their size to focus on more significant gaps.
ICT Bias: The script integrates the ICT methodology by offering an auto-calculated higher-timeframe bias:
Long Bias: Suggests the market is in an uptrend based on higher timeframe analysis.
Short Bias: Indicates a downtrend.
Neutral Bias: Suggests no clear directional bias.
Trend Lines: Automatic trend lines are drawn based on significant pivot highs and lows. These lines will dynamically adjust based on price movement. Users can control the number of trend lines displayed and extend them over time to track developing trends.
Percentile Pricing: The script also plots the 25th percentile (discount zone), 75th percentile (premium zone), and a fair value price. This helps identify whether the current price is overbought (premium) or oversold (discount).
Customization:
Zone Strength Filter: Users can set a minimum strength threshold for order blocks to be displayed.
Color Customization: Users can choose colors for demand and supply zones, market structure, breakouts, and FVGs.
Dynamic Zone Management: The script allows zones to be deleted after a certain number of bars or dynamically adjusts zones based on recent price action.
Max Zone Count: Limits the number of supply and demand zones shown on the chart to maintain clarity.
Backtesting & Win Rate: The script includes a backtesting engine to calculate the percentage of respect on the interaction between price and demand/supply zones. Results are displayed in a table at the bottom of the chart, showing the percentage rating for both long and short zones. Please note that this is not a win rate of a simulated strategy, it simply is a measure to understand if the current assets tends to respect more supply or demand zones.
How to Use:
Load the script onto your chart. The default settings are optimized for identifying key price action zones and structure on intraday charts of liquid assets.
Customize the settings according to your strategy. For example, adjust the "Max Orderblocks" and "Strength Filter" to focus on more significant price action areas.
Monitor the liquidity grabs, breakouts, and FVGs for potential trade opportunities.
Use the bias and market structure analysis to align your trades with the prevailing market trend.
Refer to the backtesting win rates to evaluate the effectiveness of the zones in your trading.
Terms & Conditions:
By using this script, you agree to the following terms:
Educational Purposes Only: This script is provided for informational and educational purposes and does not constitute financial advice. Use at your own risk.
No Warranty: The script is provided "as-is" without any guarantees or warranties regarding its accuracy or completeness. The creator is not responsible for any losses incurred from the use of this tool.
Open-Source License: This script is open-source and may be modified or redistributed in accordance with the TradingView open-source license. Proper credit to the original creator, OmegaTools, must be maintained in any derivative works.

CRT overlay 2Overview
The "CRT overlay 2" is designed to plot key levels and detect market patterns based on the 4-hour candle around a specific start time (5AM). It incorporates elements like the high, low, and 50% level of a key 4-hour candle, and also tracks Fair Value Gaps (FVGs) to help identify potential price imbalances in the market. The indicator is primarily based on Candle Range Theory (CRT), which focuses on the significance of price movements within key candles and their relation to future market activity.
How the Script is Made
Key Components:
4-hour CRT Candle: The script identifies a specific 4-hour candle using a customizable start time (by default, it’s set to the 5 AM candle).
High, Low, and Midline Levels: For this selected 4-hour candle, the script calculates and draws the high, low, and 50% midpoint. These levels are used as reference points for further analysis.
Fair Value Gaps (FVGs): The script detects price gaps between candles (where the third candle does not fully overlap the first), which can act as areas of potential support or resistance. The user can toggle the plotting of midlines for these gaps.
Time Restrictions: The script limits its key functionalities (e.g., detecting highs, lows, and gaps) to a specific time window, between the target hour and the end hour (e.g., 5 AM to 10 AM).
Extensions and Visibility:
The plotted high, low, and midlines of the 4-hour candle extend a certain number of bars forward for visibility.
These lines stop extending after the end of the defined session (e.g., after 10 AM).
Wick Length Calculation:
The script calculates the length of a candle's wick as a percentage of the total range of the candle, which may provide insights into market rejections or momentum shifts.
Fair Value Gap (FVG) Detection:
The script detects both bullish and bearish FVGs based on a 3-candle pattern, plotting the gaps with customizable colors. The FVGs are then drawn on the chart for visual guidance.
Midlines of these gaps can also be drawn, and outdated or filled FVGs are removed after a set number of bars or if they are filled by price action.
How to Use It
Indicator Setup:
After adding the indicator to your chart, you will be able to customize settings for your desired timezone and the target 4-hour candle. By default, the script is set to the 5 AM candle, but this can be changed to any hour depending on your analysis needs.
The "CRT Candle Start" and "CRT Candle End" allow you to define the time range when the high, low, and midlines will be plotted and tracked.
Key Levels:
The script draws white lines for the high and low of the selected 4-hour candle, along with a green dashed line for the 50% mid-level. These lines serve as significant support and resistance levels.
During the defined session (e.g., 5 AM to 10 AM), these lines will actively extend and be visible on your chart.
After the session ends, these lines stop extending but remain on the chart for reference.
Fair Value Gaps (FVGs):
The script automatically identifies gaps between candles and plots them on the chart with colored boxes (green for bullish gaps, orange for bearish gaps). These areas can serve as potential reversal or continuation zones.
You can choose whether or not to plot a dashed line at the 50% mark of these FVGs. This midline can be important for targeting partial fills or retracements.
Sweep Alerts and Higher Highs/Lower Lows:
The script monitors price action to detect when the market forms the very first higher high or lower low within the high and low range of the 4-hour candle. When a higher high or lower low is detected, the script plots a yellow label on the chart to mark the event and triggers an alert.
These events can indicate potential sweep patterns or liquidity grabs.
FVG Removal:
The script includes a feature to automatically remove FVGs when they are filled by price action or after they become too old (based on a user-defined number of bars). This helps keep the chart clean for further analysis without clutter from outdated information.
Practical Application
Intraday Traders: The script helps traders focus on specific time windows (like 5 AM to 10 AM) and provides key reference levels (high, low, midline) that can guide trading decisions. Breaks and retests of these levels are common trading strategies.
Market Reversal and Continuation: The detection of Fair Value Gaps and higher highs/lower lows within the defined range can be useful for identifying potential reversal points or continuation signals in the market.
Candle Range Theory (CRT): The script is rooted in CRT, which emphasizes the importance of high and low levels of key candles for future price action. This theory is often used by traders looking to identify support/resistance zones or liquidity grabs in the market.
In summary, CRT overlay 2 is designed for precision trading around key timeframes, focusing on levels from the 4-hour candle and incorporating Fair Value Gaps for potential trade entries or exits. Its customizable inputs make it flexible for various strategies, and its focus on time-based levels is aligned with concepts in intraday trading and market structure analysis.

Fair Value Gaps
Introducing the Fair Value Gaps (FVG) Indicator by OmegaTools, a distinctive and analytical tool designed for TradingView. This script meticulously identifies and visualizes fair value gaps within the market, offering traders a nuanced understanding of potential price movement areas that are not immediately apparent through traditional analysis.
Concept and Methodology:
Fair Value Gaps are identified as areas on a chart where the price has skipped over, leaving a 'gap' that has not been filled. These gaps often occur due to sudden market movements triggered by news events, changes in market sentiment, or large orders that move the price significantly. The FVG Indicator detects these gaps by analyzing price action and identifying discrepancies between high and low prices over a specified period. This approach is rooted in the belief that markets tend to return to these unfilled spaces, providing potential opportunities for traders.
How It Works:
The indicator scans the chart for gaps between the high of one session and the low of the next (or vice versa), marking these gaps visually for easy identification.
Users can customize the lookback period to adjust the sensitivity of the indicator to recent versus historical data.
The FVG Indicator employs color-coding to distinguish between bullish and bearish gaps, allowing traders to quickly gauge market sentiment around these gaps.
Using the FVG Indicator:
Apply the indicator to any chart on TradingView and adjust the input settings, including the extension of FVGs and aesthetic preferences like color, to suit your analysis style.
Use the visual cues provided by the FVG Indicator to identify potential areas where the market may move to fill the gaps.
Combine the insights from the FVG Indicator with other technical analysis tools or fundamental analysis to validate potential trading opportunities.
Originality and Usefulness:
The FVG Indicator stands out due to its focused approach to identifying and visualizing fair value gaps, a concept that is often overlooked in conventional market analysis. By providing a clear visual representation of these gaps, the indicator adds depth to market analysis, aiding in the identification of potential price reversal zones or continuation signals.
Disclaimer and Responsible Use:
The financial markets are complex and unpredictable. The FVG Indicator is designed to offer analytical insights and should be used as part of a comprehensive trading strategy. It does not guarantee profits or predict market movements with absolute certainty. Traders are encouraged to use this tool judiciously, alongside proper risk management practices. Remember, past performance does not guarantee future results, and trading involves risks, including the potential loss of investment.
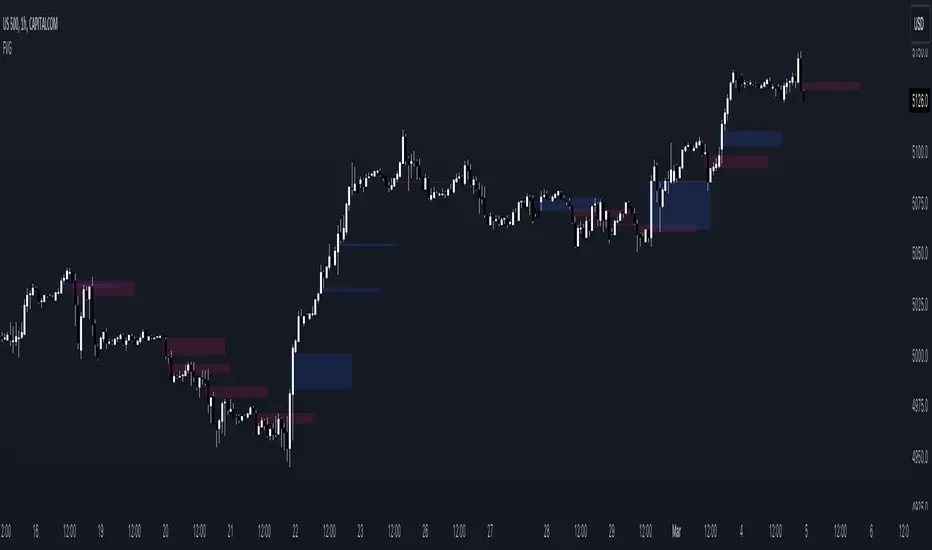
MTF Market Structure - SMC IndicatorsThe Multi Timeframe Market Structure helps understand and identify bullish or bearish Market Structure by highlighting “KEY” Highs and Lows. It also identifies changes in market direction by identifying a “Shift in Market Structure” (See Point 2 below) or “Break in Market Structure” (See Point 3 Below).
What are Key Highs and Lows?
Not every high or low is a “Key” high or low. “Key” highs and lows are specific highs and lows that form the structure of the market and have significance in understanding the current trend in the market (see point 1 below).
The indicator identifies these “Key” highs and lows on multiple time frames, allowing the trader to keep a perspective of the Market Structure with multiple timeframes simultaneously (see point 5 below).
The key highs and lows identified by the indicator are as follows:
Key Lows : Identify significant Swing Lows, Short-term lows “STL”, Intermediate-Term Lows “ITL”, and Long-Term Lows “LTL”.
Key Highs : Identify significant Swing Highs, Short-term highs “STH”, Intermediate-Term Highs “ITH”, and Long-Term Highs “LTH”.
Significant Swing High : This is a price swing with one lower candle to the right and one lower candle to the left of it.
Significant Swing Low : This is a price swing with one higher candle to the right and one higher candle to the left of it.
Short-Term High “STH” is a price swing with one lower Significant Swing High to the right and one lower Significant Swing High to the left of it.
Short-Term Low “STL” is a price swing with one higher Significant Swing Low to the right and one higher Significant Swing Low to the left of it.
Intermediate-Term High “ITH” is a price swing with one lower STH to the right and one lower STH to the left of it.
Intermediate-Term Low “ITL” is a price swing with one higher STL to the right and one higher STL to the left of it.
Long-Term High “LTH” is a price swing with one lower ITH to the right and one lower ITH to the left of it.
Long-Term Low “ITL” is a price swing with one higher ITL to the right and one higher ITL to the left of it.
By identifying key highs and lows using the Market Structure Indicator, it can be used in multiple ways by using those reference points as follows:
1. Identifying Market Trends by Connecting Key Highs and Lows.
Bullish trend identification is when the indicator is making higher ITLs and ITHs.
Bearish Trend identification when the indicator is making lower ITLs and ITHs.
PS: it’s essential to understand the underlying market trend on multiple timeframes to use the next features correctly. Always use the Shifts and Breaks in Market Structures in line with the 1H or higher timeframes Market Trend for higher probability trade opportunities. This is because, generally, higher timeframes have more importance than lower timeframes.
2. Shift In Market Structure - SMS for Entries
A Shift in Market Structure “SMS” identifies potential reversal in short-term market trend relative to the timeframe where the SMS is identified.
This occurs after a run of any Significant Swing High or Low and then reversing, creating a Fair Value Gap “FVG”.
There can be Bullish and Bearish Market Structure Shifts.
When a Bullish Shift in Market Structure occurs, the indicator identifies an opportunity for the price to change from Bearish to Bullish, as seen in the image below.
When a Bearish Shift in Market Structure occurs, the indicator identifies an opportunity for the price to change from Bullish to Bearish.
3. Break In Market Structure - BMS for Entries
A Break in Market Structure “BMS” has a similar function to the Shift in Market Structure “SMS”; however, when it occurs, it identifies a potential longer-term trend reversal (compared to the SMS) relative to the timeframe where the BMS is identified.
Unlike “SMS”, the BMS occurs after a run only after a run on Key Highs or Lows.
Similar to the SMS, there can be Bullish and Bearish Breaks in Market Structure.
When a Bullish Break in Market Structure occurs, the indicator identifies an opportunity for a longer-term trend change from Bearish to Bullish, as seen in the image below.
The FVG must occur in the lower 50% of the impulse price leg (at Discount).
When a Bearish Break in Market Structure occurs, the indicator identifies an opportunity for a longer-term trend change from Bullish to Bearish.
The FVG must occur in the upper 50% of the impulse price leg (at Premium).
4. Inversion Break and Shift in Market Structure for Early Entries
Inversion “BMS” and “SMS” are similar to the normal SMS and BMS, but they occur:
Bullish: When the FVG of the Bearish BMS/SMS forms in the lower 50% of the impulse price leg (at Discount).
We use the FVG that forms from the Bearish SMS/BMS as an inversion FVG for potential entry after market trend change from Bearish to Bullish.
Bearish: When the FVG of the Bullish BMS/SMS forms in the upper 50% of the impulse price leg (at Premium).
We use the FVG that forms from the Bullish SMS/BMS as an inversion FVG for potential entry after market trend change from Bullish to Bearish.
5. Multi Time Frame analysis
The indicator allows multiple timeframe perspectives to be considered when using it.
The key Highs and Lows have significance not only on the current timeframe they are identified but also on lower or higher timeframes simultaneously.
This is because a ITL/ITH on the 1H means
It’s a LTL/LTH on one or more timeframes lower (15Min, 5M, and 1Min).
And at the same time, it’s a STL/STH on one timeframe higher (4H)
Also, it’s a Significant Low/High (marked with a dot) on two timeframes higher (Daily).
The same logic applies to all other Key Highs and Lows.
Another example is a Significant Low/High (swing marked with a dot below or above it) on the current timeframe (1D) means it’s a STL/STH on one timeframe lower (4H) and an ITL/ITH on two timeframes lower (1H) and a LTH/LTH on three timeframes lower or more (15M, 5M, 1Min, 30 Seconds, etc…).
This Multi-time frame analysis is a great way to help traders understand Market Structure and Market trend on multiple timeframes simultaneously, and it also assists in Top-down analysis.
PS: Note that this multi-timeframe analysis approach and logic can be applied to any timeframe and for any type of trading (swing trading, day trading, scalping, or short-term trading) because the price is fractal.
For example, if a trader is a swing trader, then it’s best to identify trader opportunities on the 1H or higher; however, lower timeframes Market Structure can still be used to help the traders refine their entries and target key highs and lows in the opposite direction.
If a trader is a day trader or a scalper, the trader could use Market Structure on 15M or lower to identify trader opportunities and target key highs and lows in the opposite direction.
6. Setting Targets
The indicator can also be used to identify potential targets after the SMS or BMS occurs. Targets can be chosen above Key Highs or Lows depending on the trade objective and timeframe where the trade idea is identified.
Bonus Features
Highlight Market Structure Trend
This feature is an excellent backtesting visual tool to look at changes in market trends highlighted in colours. These changes are based on the Shift or Break in of Market Structure depending on the selection option.
When "Shift/Break" in Market Structure" is selected, a Bullish trend is highlighted in blue when a Bullish Shift/Break in Market Structure Occurs and in Red when a Bearish Shift/Break in Market Structure Occurs.
Notifications
Sends notifications when there is a Shift or Break in Market Structure on the current timeframe of choice.

TrendFriendOverview
TrendFriend (TF) combines various technical analysis components, including trend calculations, moving averages, RSI signals, and Fair Value Gaps (FVG) detection to determine trend reversal and continuation points. The FVG feature identifies potential consolidation periods and displays mitigation levels.
Features
Trend Analysis: Utilizes short and long-term Running Moving Averages (RMA) to identify trends.
Average True Range (ATR): Plots ATR to depict market volatility.
RSI Signals: Calculates RSI and provides buy/sell signals based on RSI conditions.
Fair Value Gaps (FVG): Detects FVG patterns and offers options for customization, including dynamic FVG, mitigation levels, and auto threshold.
Usage
Buy Signals: Generated based on pullback conditions, contra-buy signals, and crossovers of specified moving averages.
Sell Signals: Generated based on pullback conditions, contra-sell signals, and crossunders of specified moving averages.
Visualization: FVG areas are visually represented on the chart, and unmitigated levels can be displayed.
Configuration
Adjustable parameters for trend periods, ATR length, RSI settings, FVG threshold, and display preferences.
Dynamic FVG detection and mitigation level visualization can be enabled/disabled.
Usage Example
Trend Analysis: Identify trends with short and long-term moving averages.
RSI Signals: Interpret RSI signals for potential reversals.
FVG Detection: Visualize Fair Value Gaps and mitigation levels on the chart.
Buy/Sell Signals: Receive alerts for buy/sell signals based on specified conditions.
Disclaimer
This Pine Script code is subject to the terms of the Mozilla Public License 2.0. Use this code at your own risk, and always conduct additional analysis before making trading decisions.
Author
Author: devoperator84
License: Mozilla Public License 2.0
Liquidity Engulfing & Displacement [MsF]Japanese below / 日本語説明は英文の後にあります。
-------------------------
*This indicator is based on upslidedown's "Liquidity Engulfing Candles ". It's a very cool indicator. thank you.
It has 2 functions: show the Liquidity Engulfing on HTF and candle color change when displacement occurs.
=== Function description ===
1. Liquidity Engulfing on HTF
This indicator gives Liquidity Engulfing signals not only for the current candle, but also for H4 and H1 on HTF.
You can use that a bullish engulfing on H1 is a BOS on m5 and on H4 is a BOS on m15. It uses the theory of stop hunt from ICT.
Also, It's possible to fire alert.
2. Displacement
Change the color display of the candlesticks when a bullish candleStick or bearish candleStick is attached. Furthermore, by enabling the "Require FVG" option, you can easily discover the FVG (Fair Value Gap). It is a very useful function for ICT trading.
When H1 candle takes liquidity from one side and moves with an explosive move to the other side of the previous candle (displacement), it creates break of market structure on M5. Entry on discount FVG or OTE with stop loss at or below the stop hunt wick.
=== Parameter description ===
- Liquidity engulfing candles(LEC) SETTING
- Show H1 LEC … Whether to show LEC for H1
- Show H4 LEC … Whether to show LEC for H4
- Show Current LEC … Whether to show LEC for current timeframe
- Apply Stop Hunt Wick Filter … Require candle wick into prior candle retracement zone
- Apply Close Filter … Require LL/HH on candle in order to print a valid engulfing signal
- DISPLACEMENT SETTING
- Require FVG … Draw only when FVG occurs
- Displacement Type … Displacement from open to close? or from high to low?
- Displacement Length … Period over which to calculate the standard deviation
- Displacement Strength … The larger the number, the stronger the displacement detected
-------------------------
2つの機能があります: 上位足のLiquidity engulfing(流動性獲得)を表示することと、大きな変位が発生したときにローソク足の色を変更することです。
=== 機能説明 ===
1. 上位足のLiquidity engulfing
このインジケーターは、現在のローソク足だけでなく、上位足の H4 および H1 に対してもLiquidity engulfingシグナルを提供します。
H1はm5、H4はm15での使用を推奨します。これはICTのストップハント理論を活用しています。また、アラートを発することも可能です。
2. 変位(DISPLACEMENT)
大きな陽線、陰線を付けた場合に、そのローソク足をカラー表示を変更します。
さらに"Require FVG"オプションを有効にすることで、FVG(Fair Value Gap)を容易に発見することができます。ICTトレードにを行うにあたり大変有用な機能となっています。
=== パラメータの説明 ===
- Liquidity engulfing candles(LEC) SETTING
- Show H1 LEC … H1のLECを表示するかどうか
- Show H4 LEC … H4のLECを表示するかどうか
- Show Current LEC … 現在の期間の LEC を表示するかどうか
- Apply Stop Hunt Wick Filter … ハラミ足、もしくは包み足になっている場合のみに検知させる
- Apply Close Filter … 1つ前のローソクよりも終値で超えていた場合のみに検知させる
- DISPLACEMENT SETTING
- Require FVG … FVG発生時のみ描画する
- Displacement Type … openからcloseまでの変位か?highからlowまでの変位か?
- Displacement Length … 標準偏差を計算する期間
- Displacement Strength … 変位の強さ(数字が大きいほど強い変位を検出)

ICT Concepts [LuxAlgo]The ICT Concepts indicator regroups core concepts highlighted by trader and educator "The Inner Circle Trader" (ICT) into an all-in-one toolkit. Features include Market Structure (MSS & BOS), Order Blocks, Imbalances, Buyside/Sellside Liquidity, Displacements, ICT Killzones, and New Week/Day Opening Gaps.
🔶 SETTINGS
🔹 Mode
When Present is selected, only data of the latest 500 bars are used/visualized, except for NWOG/NDOG
🔹 Market Structure
Enable/disable Market Structure.
Length: will set the lookback period/sensitivity.
In Present Mode only the latest Market Structure trend will be shown, while in Historical Mode, previous trends will be shown as well:
You can toggle MSS/BOS separately and change the colors:
🔹 Displacement
Enable/disable Displacement.
🔹 Volume Imbalance
Enable/disable Volume Imbalance.
# Visible VI's: sets the amount of visible Volume Imbalances (max 100), color setting is placed at the side.
🔹 Order Blocks
Enable/disable Order Blocks.
Swing Lookback: Lookback period used for the detection of the swing points used to create order blocks.
Show Last Bullish OB: Number of the most recent bullish order/breaker blocks to display on the chart.
Show Last Bearish OB: Number of the most recent bearish order/breaker blocks to display on the chart.
Color settings.
Show Historical Polarity Changes: Allows users to see labels indicating where a swing high/low previously occurred within a breaker block.
Use Candle Body: Allows users to use candle bodies as order block areas instead of the full candle range.
Change in Order Blocks style:
🔹 Liquidity
Enable/disable Liquidity.
Margin: sets the sensitivity, 2 points are fairly equal when:
'point 1' < 'point 2' + (10 bar Average True Range / (10 / margin)) and
'point 1' > 'point 2' - (10 bar Average True Range / (10 / margin))
# Visible Liq. boxes: sets the amount of visible Liquidity boxes (max 50), this amount is for Sellside and Buyside boxes separately.
Colour settings.
Change in Liquidity style:
🔹 Fair Value Gaps
Enable/disable FVG's.
Balance Price Range: this is the overlap of latest bullish and bearish Fair Value Gaps.
By disabling Balance Price Range only FVGs will be shown.
Options: Choose whether you wish to see FVG or Implied Fair Value Gaps (this will impact Balance Price Range as well)
# Visible FVG's: sets the amount of visible FVG's (max 20, in the same direction).
Color settings.
Change in FVG style:
🔹 NWOG/NDOG
Enable/disable NWOG; color settings; amount of NWOG shown (max 50).
Enable/disable NDOG ; color settings; amount of NDOG shown (max 50).
🔹 Fibonacci
This tool connects the 2 most recent bullish/bearish (if applicable) features of your choice, provided they are enabled.
3 examples (FVG, BPR, OB):
Extend lines -> Enabled (example OB):
🔹 Killzones
Enable/disable all or the ones you need.
Time settings are coded in the corresponding time zones.
🔶 USAGE
By default, the indicator displays each feature relevant to the most recent price variations in order to avoid clutter on the chart & to provide a very similar experience to how a user would contruct ICT Concepts by hand.
Users can use the historical mode in the settings to see historical market structure/imbalances. The ICT Concepts indicator has various use cases, below we outline many examples of how a trader could find usage of the features together.
In the above image we can see price took out Sellside liquidity, filled two bearish FVGs, a market structure shift, which then led to a clean retest of a bullish FVG as a clean setup to target the order block above.
Price then fills the OB which creates a breaker level as seen in yellow.
Broken OBs can be useful for a trader using the ICT Concepts indicator as it marks a level where orders have now been filled, indicating a solidified level that has proved itself as an area of liquidity. In the image above we can see a trade setup using a broken bearish OB as a potential entry level.
We can see the New Week Opening Gap (NWOG) above was an optimal level to target considering price may tend to fill / react off of these levels according to ICT.
In the next image above, we have another example of various use cases where the ICT Concepts indicator hypothetically allow traders to find key levels & find optimal entry points using market structure.
In the image above we can see a bearish Market Structure Shift (MSS) is confirmed, indicating a potential trade setup for targeting the Balanced Price Range imbalance (BPR) below with a stop loss above the buyside liquidity.
Although what we are demonstrating here is a hindsight example, it shows the potential usage this toolkit gives you for creating trading plans based on ICT Concepts.
Same chart but playing out the history further we can see directly after price came down to the Sellside liquidity & swept below it...
Then by enabling IFVGs in the settings, we can see the IFVG retests alongside the Sellside & Buyside liquidity acting in confluence.
Which allows us to see a great bullish structure in the market with various key levels for potential entries.
Here we can see a potential bullish setup as price has taken out a previous Sellside liquidity zone and is now retesting a NWOG + Volume Imbalance.
Users also have the option to display Fibonacci retracements based on market structure, order blocks, and imbalance areas, which can help place limit/stop orders more effectively as well as finding optimal points of interest beyond what the primary ICT Concepts features can generate for a trader.
In the above image we can see the Fibonacci extension was selected to be based on the NWOG giving us some upside levels above the buyside liquidity.
🔶 DETAILS
Each feature within the ICT Concepts indicator is described in the sub sections below.
🔹 Market Structure
Market structure labels are constructed from price breaking a prior swing point. This allows a user to determine the current market trend based on the price action.
There are two types of Market Structure labels included:
Market Structure Shift (MSS)
Break Of Structure (BOS)
A MSS occurs when price breaks a swing low in an uptrend or a swing high in a downtrend, highlighting a potential reversal. This is often labeled as "CHoCH", but ICT specifies it as MSS.
On the other hand, BOS labels occur when price breaks a swing high in an uptrend or a swing low in a downtrend. The occurrence of these particular swing points is caused by retracements (inducements) that highlights liquidity hunting in lower timeframes.
🔹 Order Blocks
More significant market participants (institutions) with the ability of placing large orders in the market will generally place a sequence of individual trades spread out in time. This is referred as executing what is called a "meta-order".
Order blocks highlight the area where potential meta-orders are executed. Bullish order blocks are located near local bottoms in an uptrend while bearish order blocks are located near local tops in a downtrend.
When price mitigates (breaks out) an order block, a breaker block is confirmed. We can eventually expect price to trade back to this breaker block offering a new trade opportunity.
🔹 Buyside & Sellside Liquidity
Buyside / Sellside liquidity levels highlight price levels where market participants might place limit/stop orders.
Buyside liquidity levels will regroup the stoploss orders of short traders as well as limit orders of long traders, while Sellside liquidity levels will regroup the stoploss orders of long traders as well as limit orders of short traders.
These levels can play different roles. More informed market participants might view these levels as source of liquidity, and once liquidity over a specific level is reduced it will be found in another area.
🔹 Imbalances
Imbalances highlight disparities between the bid/ask, these can also be defined as inefficiencies, which would suggest that not all available information is reflected by the price and would as such provide potential trading opportunities.
It is common for price to "rebalance" and seek to come back to a previous imbalance area.
ICT highlights multiple imbalance formations:
Fair Value Gaps: A three candle formation where the candle shadows adjacent to the central candle do not overlap, this highlights a gap area.
Implied Fair Value Gaps: Unlike the fair value gap the implied fair value gap has candle shadows adjacent to the central candle overlapping. The gap area is constructed from the average between the respective shadow and the nearest extremity of their candle body.
Balanced Price Range: Balanced price ranges occur when a fair value gap overlaps a previous fair value gap, with the overlapping area resulting in the imbalance area.
Volume Imbalance: Volume imbalances highlight gaps between the opening price and closing price with existing trading activity (the low/high overlap the previous high/low).
Opening Gap: Unlike volume imbalances opening gaps highlight areas with no trading activity. The low/high does not reach previous high/low, highlighting a "void" area.
🔹 Displacement
Displacements are scenarios where price forms successive candles of the same sentiment (bullish/bearish) with large bodies and short shadows.
These can more technically be identified by positive auto correlation (a close to open change is more likely to be followed by a change of the same sign) as well as volatility clustering (large changes are followed by large changes).
Displacements can be the cause for the formation of imbalances as well as market structure, these can be caused by the full execution of a meta order.
🔹 Kill Zones
Killzones represent different time intervals that aims at offering optimal trade entries. Killzones include:
- New York Killzone (7:9 ET)
- London Open Killzone (2:5 ET)
- London Close Killzone (10:12 ET)
- Asian Killzone (20:00 ET)
🔶 Conclusion & Supplementary Material
This script aims to emulate how a trader would draw each of the covered features on their chart in the most precise representation to how it's actually taught by ICT directly.
There are many parallels between ICT Concepts and Smart Money Concepts that we released in 2022 which has a more general & simpler usage:
ICT Concepts, however, is more specifically aligned toward the community's interpretation of how to analyze price 'based on ICT', rather than displaying features to have a more classic interpretation for a technical analyst.

[ACR+]©AudenFXHTF ACR Pattern Detection
Detects ACR Sweep (Advanced Candle Reaction) with C1–C5 labeling, complete with sweep line, mid-line, and projection to LTF.
Dynamic Equilibrium Zones
Zones automatically appear according to the ACR phase (C2→C3, C3→C4, C4→C5). Previous zones are cleared, only the active phase zone remains visible.
Change in State of Delivery (CISD)
Highlights supply–demand structure shifts with confirmation lines (Bullish / Bearish / Neutral).
Liquidity Sweep (LTF)
Detects high/low sweeps on LTF, marking liquidity trap momentum.
Fair Value Gap (FVG)
Automatically detects FVGs based on ACR bias. FVG boxes are auto-deleted once mitigated.
Double Sweep Quality Filter
Evaluates pattern quality (Single vs Double Sweep) and flags setups with lower reliability.
Glassmorphism UI
Modern, mobile-friendly status table displaying ACR direction, quality, zone phase, and CISD in real time.
Alert System (Compact & Discord Webhook)
Ready-to-use alerts for personal trading or direct integration with Discord servers.
📈 How to Use
Select your main trading timeframe (M1, M5, H1, etc.).
Let the indicator auto-select the HTF (or set manually).
Wait for a valid ACR Sweep (C1–C2).
Monitor the zone phase (C2→C3, C3→C4, etc.).
Confirm with CISD & Liquidity Sweep.
Enter/re-enter in the zone or FVG aligned with the ACR bias.
🎯 Who Is It For?
Scalpers who need multi-timeframe confirmation.
Intraday traders aiming for precision entries.
Swing traders seeking clear HTF bias.
Prop firm traders focused on risk & consistency.
⚠️ Disclaimer
This indicator is not a standalone buy/sell signal. Always use with proper risk management. Past performance does not guarantee future results.
AudenFX mempersembahkan indikator premium untuk trader profesional yang ingin membaca struktur pasar dengan pendekatan ICT (Inner Circle Trader) yang lebih sistematis, modern, dan mudah dipahami.
🔑 Fitur Utama:
HTF ACR Pattern Detection
Mendeteksi ACR Sweep (Advanced Candle Reaction) dengan labeling C1–C5, lengkap dengan sweep line, mid-line, dan proyeksi ke LTF.
Dynamic Equilibrium Zones
Zona otomatis muncul sesuai fase ACR (C2→C3, C3→C4, C4→C5). Zona lama akan hilang, hanya fase aktif yang tampil.
Change in State of Delivery (CISD)
Menggambarkan perubahan struktur supply–demand dengan garis konfirmasi (Bullish/Bearish/Neutral).
Liquidity Sweep (LTF)
Deteksi sweep high/low pada LTF, menandai momentum jebakan likuiditas.
Fair Value Gap (FVG)
Deteksi otomatis FVG berbasis bias ACR. Kotak FVG akan auto-delete saat mitigasi.
Double Sweep Quality Filter
Menilai kualitas pola (Single/Double Sweep), memberi tanda peringatan jika kualitas setup lebih rendah.
Glassmorphism UI
Status table modern & mobile-friendly: menampilkan arah ACR, kualitas, fase zona, dan CISD secara real-time.
Alert System (Compact & Discord Webhook)
Siap pakai untuk alert personal atau integrasi langsung ke server Discord komunitas.
📈 Cara Pakai:
Pilih timeframe utama Anda (M1, M5, H1, dst.).
Biarkan indikator auto memilih HTF (atau set manual).
Tunggu ACR Sweep valid (C1–C2).
Perhatikan zona fase (C2→C3, C3→C4, dst.).
Konfirmasi dengan CISD & Liquidity Sweep.
Entry/re-entry di zona atau FVG yang selaras dengan bias ACR.
🎯 Untuk Siapa?
Scalper yang butuh konfirmasi multi-timeframe.
Intraday trader yang mengincar precision entry.
Swing trader yang ingin membaca bias HTF dengan jelas.
Trader prop firm yang fokus ke risk & consistency.
⚠️ Disclaimer
Indikator ini bukan sinyal trading. Gunakan bersama manajemen risiko yang baik. Hasil masa lalu tidak menjamin hasil di masa depan.
➡️ Info lebih lengkap: audenfx.com
