Custom Range Zones with EMA Alerts [wjdtks255]📊 Adaptive Target Tracker
English Version
Indicator Description
The Adaptive Target Tracker is a trend-following indicator that integrates moving averages with an adaptive Average True Range (ATR) calculation to detect market trends with dynamic sensitivity. It clearly plots entry lines, multiple profit targets (T1, T2, T3), and stop-loss levels directly on the chart, providing traders with a vivid visualization of potential trade setups.
This indicator dynamically adapts to market volatility, effectively distinguishing between upward (long) and downward (short) trends. It reflects these states using distinct colored lines and labels, facilitating precise trade management and clear interpretation of market direction.
🔍 How It Works
Trend Detection: The indicator generates smoothed price bands by dynamically adding or subtracting the ATR from the moving average of both high and low prices.
Entry Signal: A long position is signaled when the closing price moves above the adaptive upper band. Conversely, a short position is indicated when the closing price drops below the adaptive lower band.
Visual Elements: For comprehensive guidance, the entry price, a clear stop-loss line (marked in red), and three progressively spaced profit target lines (depicted in blue) are all plotted directly on the chart.
Confirmation & Alerts: Entry signals are enhanced with visual arrows and corresponding labels: a green indicator for long entries and an orange one for short entries. These elements are designed to help pinpoint optimal trading opportunities.
Real-Time Update: The indicator's lines and labels continuously update and advance with the prevailing price action. Upon reaching a target level, a distinctive check mark appears, providing real-time feedback on trade progression.
💡 Trading Method
Entry: Initiate a long trade when the price closes above the adaptive upper band, signaled by a green entry line and label. For short trades, enter when the price closes below the adaptive lower band, indicated by an orange entry line and label.
Profit Targets: Utilize the three predefined target levels (T1, T2, T3) as strategic points for incremental profit-taking. These targets are intelligently calculated based on the entry price and ATR, ensuring they are dynamically adapted to current market volatility.
Stop Loss: Establish your stop loss at the red line. This line represents a calculated risk threshold, positioned below the entry for long trades and above it for short trades, to protect capital.
Management: Actively monitor the chart for the achievement of target levels, which are marked with a check symbol. Adjust your position exposure as needed to secure profits and effectively mitigate risk.
Customization: The indicator offers flexibility through adjustable parameters such as the trend window length and ATR offset. These can be fine-tuned to align with your individual trading style and preferred timeframes.
Summary
The Adaptive Target Tracker is an ideal tool for traders who value clear, visual trade signals combined with sophisticated multi-level exit strategies and volatility-adapted risk management. It excels at filtering out market noise, allowing traders to concentrate on significant trend movements. Furthermore, it provides practical, adaptive entry, target, and stop-loss functionalities applicable across a wide array of timeframes and asset classes.
"alert" için komut dosyalarını ara

Awesome SuperTrend Zone Dynamic Alerts// created by © OmegaTools, upgrade to v6 and alert condition added
//@version=6
Awesome SuperTrend Zone Alerts with dynamic alerts

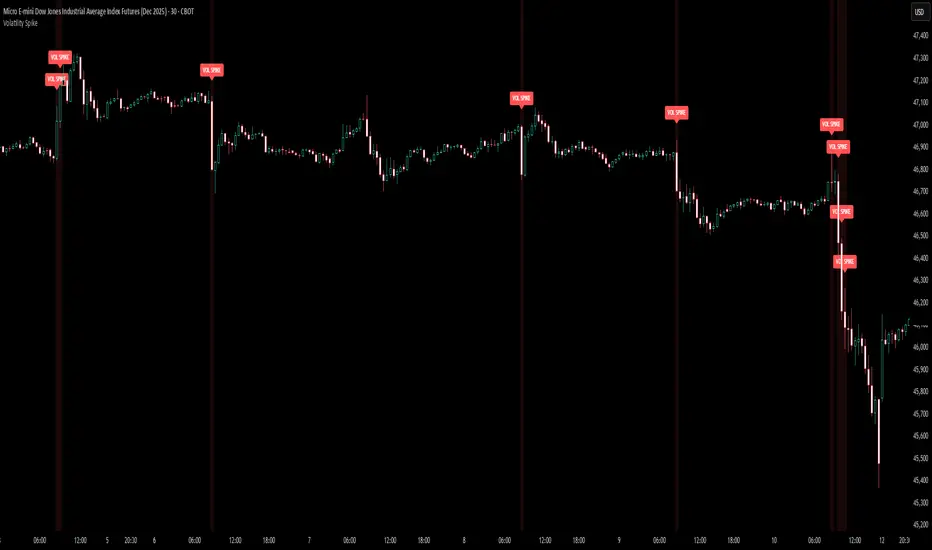
Volatility Spike AlertsVolatility Spike Alerts can be configured to alert on a manually set multiple of volatility or dynamically. Volatility is calculated off a customizable True Range and alerts upon bar close.
QT Insights [Pro +]: PSP + TPD Alerts | [cephxs]This indicator's primary function is to highlight chart candlestick divergence with candle closes.
*A full list of the Supported Correlated Asset Pairings (CAPs) will be linked at the bottom.
There are two primary operating modes
PSP Only
All precision candles
There is a tooltip describing what each operating mode does in the indicator settings
Asset Selection
The indicator handles asset selection for divergences automatically for a large variety of asset(s) classes automatically and is ready for use Out of the Box with Major Assets like:
CME_MINI:NQ1! , CME_MINI:ES1! , CBOT_MINI:YM1!
It also works with non-futures for indices (CFD), for best functionality with no stress, we only have support for the following brokers. CAPITALCOM, VANTAGE, OANDA
It works with Forex, Crypto and Energies, also works with Metals.
The default pairings are determined by the active chart
i.e CME_MINI:NQ1! will pair with Asset 2 as CME_MINI:ES1! and Asset 3 as CBOT_MINI:YM1!
Alerts
This version has alerts, I will create a tutorial for that. You can use the alerts by adding alerts and selecting the indicator from the "Contdition" Dropdown in the Alert Creation Pop-up
Customizations
The indicator is fully customizable in the Styles tab under the settings
Play around with it and determine what works best with your aesthetic, it comes out of the box with a lot of clutter and as you can see in the showcase image, it's clean and functional, just how I like it.
*Supported CAPs
CFD
Forex:
EURUSD / GBPUSD (FOREXCOM Only)
Indices:
NAS100 / SPX500 / US 30 (CAPITALCOM / Vantage / Oanda Only)
Metals:
XAUUSD / XAGUSD
Futures
Indices:
NQ / MNQ , ES / MES , YM / MYM
Metals:
GC / MGC , SI / SIL
Crypto
BTCUSD / ETHUSD, this will work for any asset with "BTC" or "ETH" in the asset name
Note: There is support for Micro contracts automatically
Subsequent Updates Will be posted, Stay tuned.
Note: I wrote this description on the fly so there might be flaws, Regardless, made with ❤️ by cephxs

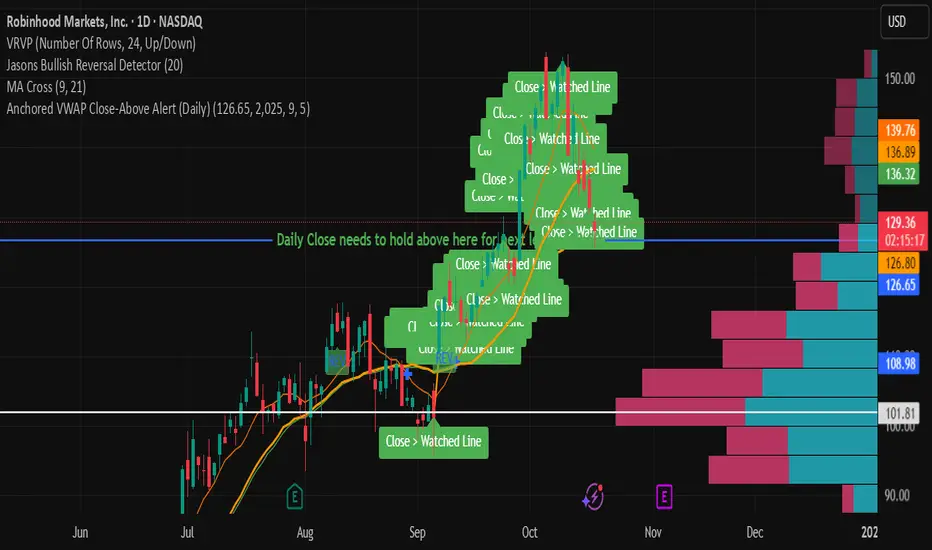
Anchored VWAP Close-Above Alert (Daily)This indicator is a daily anchored VWAP (Volume-Weighted Average Price) tracker that alerts you when price closes above a key pivot line you’ve defined — either dynamically (anchored VWAP from a date like 9/5) or statically (a fixed level like 126.65).
Here’s how each piece works:
1. The anchor date
You give it a date — say September 5, 2025. The script starts calculating VWAP from that day forward. That line represents the average price buyers and sellers have transacted at since that anchor. It’s a kind of “fair-value line” for that period.
2. The logic
Every bar after that date, it adds up (price × volume) and divides by total volume — giving a running VWAP from that starting point. You can instead lock it to a flat number (like 126.65) if you don’t want it recalculating.
3. The alert trigger
Once per day — when the daily candle closes — it checks:
“Did price close above my watched line?”
If yes, it fires an alert (and can draw a label) to tell you that the day’s candle reclaimed that level.
4. The why
That kind of move — a daily close reclaiming a major anchored VWAP — often signals a shift in sentiment or trend strength. Traders watch it to confirm rebounds or invalidations of downside moves.
So in your context:
You anchored to 9/5 (the downside pivot).
You want to know if price closes back above that VWAP (~126.65).
If it does, the alert lights up — confirming the “reclaim” you mentioned in your note.
It’s basically your guard dog for the daily close reclaim.
Divergences + Alerts (ANY Indicator)📊 Divergences + Alerts (ANY Indicator)
This versatile indicator detects four types of divergences between price action and an oscillator:
Buyer Exhaustion
Buyer Absorption
Seller Exhaustion
Seller Absorption
Each divergence type is automatically identified and visually marked on the chart with colored lines. The indicator also includes built-in alert conditions for all four divergence types, allowing traders to receive real-time notifications when potential reversal signals occur.
By default, the oscillator is a candle-style visualization of the Money Flow Index (MFI), enhanced with volatility filtering via a VWMA-based ATR. However, users can replace the default MFI oscillator with any external source using the “Plug External Source” input, enabling full customization and compatibility with other indicators.
Key features:
🔍 Detects both exhaustion and absorption divergences
🔔 Alerts for each divergence type
🕯️ Candle-style oscillator visualization
🔌 Optional input for external indicator sources
⚙️ ATR-based filtering for precision
Ideal for traders seeking to spot early signs of trend reversals or momentum shifts with customizable flexibility.

Stalonte EMA - Stable Long-Term EMA with AlertsStalonte EMA - The Adaptive & Stable EMA - Almost Eternal
Here's why you will love "Stalonte":
The Stalonte (Stable Long-Term EMA) is a highly versatile trend-following tool. Unlike standard EMAs with fixed periods, it uses a configurable smoothing constant (alpha), allowing traders to dial in the exact level of responsiveness and stability they need. Finding the "sweet spot" (e.g., alpha ~0.03) creates a uniquely effective moving average: it is smooth enough to filter out noise and identify safe, high-probability trends, yet responsive enough to provide actionable signals without extreme lag. It includes alerts for crossovers and retests.
Pros and Cons of the Stalonte EMA
Pros:
Unparalleled Adaptability: This is its greatest strength. The alpha input lets you seamlessly transform the indicator from an ultra-slow "trend-revealer" (low alpha) into a highly effective and "safe" trend-following tool (medium alpha, e.g., 0.03), all the way to a more reactive one.
Optimized for Safety & Signal Quality: As you astutely pointed out, with the proper setting (like 0.03), it finds the perfect balance. It provides a smoother path than a standard 20-50 period EMA, which reduces whipsaws and false breakouts, leading to safer, higher-confidence signals.
Superior Trend Visualization: It gives a cleaner and more intuitive representation of the market's direction than many conventional moving averages, making it easier to "see" the trend and stick with it.
Objective Dynamic Support/Resistance: The line created with a medium alpha setting acts as a powerful dynamic support in uptrends and resistance in downtrends, offering excellent areas for entries on retests with integrated alerts.
Cons:
Requires Calibration: The only "con" is that its performance is not plug-and-play; it requires the user to find their optimal alpha value for their specific trading style and the instrument they are trading. This demands a period of testing and customization, which a standard 50-period EMA does not.
Conceptual Hurdle: For traders only familiar with period-based EMAs, the concept of a "smoothing constant" can be initially confusing compared to simply setting a "length."
In summary:
The Stalonte EMA is not a laggy relic. It is a highly sophisticated and adaptable tool. Its design allows for precise tuning, enabling a trader to discover a setting that offers a superior blend of stability and responsiveness—a "sweet spot" that provides safer and often more effective signals than many traditional moving averages. Thank you for pushing for a more accurate and fair assessment.
Use Case Example:
You can combine it with classical EMAs to find the perfect entry.
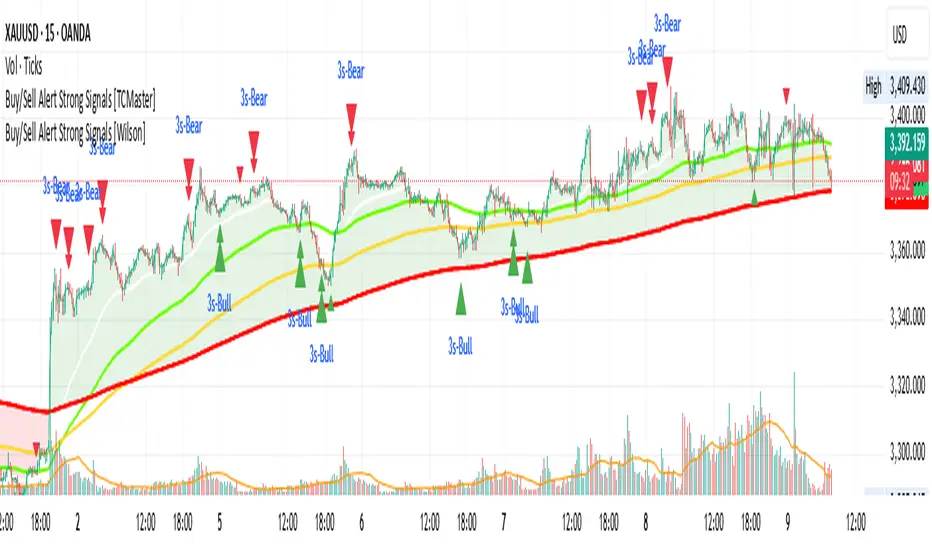
Buy/Sell Alert Strong Signals [Wilson]This indicator combines Smoothed Moving Averages (SMMA), Stochastic Oscillator, and popular candlestick patterns (Engulfing, 3 Line Strike) to highlight potential trend reversal zones.
Main features:
4 SMMA lines (21, 50, 100, 200) for short-, medium-, and long-term trend analysis.
Trend Fill: Background shading when EMA(2) and SMMA(200) are aligned, visually confirming trend direction.
Stochastic Filter: Filters signals based on overbought/oversold conditions to help reduce noise.
Candlestick pattern recognition:
Bullish/Bearish Engulfing
Bullish/Bearish 3 Line Strike
Alerts for each pattern when Stochastic conditions are met.
⚠️ Note: This is a technical analysis tool. It does not guarantee accuracy and is not financial advice. Always combine with other analysis methods and practice proper risk management.
🛠 How to Use:
1. SMMA Settings
21 SMMA & 50 SMMA: Short- and medium-term trend tracking.
100 SMMA: Optional mid/long-term filter (toggle on/off).
200 SMMA: Major trend direction reference.
2. Trend Fill
EMA(2) > SMMA(200): Background shaded green (uptrend bias).
EMA(2) < SMMA(200): Background shaded red (downtrend bias).
Can be enabled/disabled in settings.
3. Stochastic Filter
K Length, D Smoothing, Smooth K: Adjust sensitivity.
Overbought & Oversold: Default 80 / 20 thresholds.
Buy signals only valid if Stochastic is oversold.
Sell signals only valid if Stochastic is overbought.
4. Candlestick Patterns
3 Line Strike:
Bullish: Three consecutive bullish candles followed by one bearish candle closing below the previous, with potential reversal.
Bearish: Three consecutive bearish candles followed by one bullish candle closing above the previous, with potential reversal.
Engulfing:
Bullish: Green candle fully engulfs the prior red candle body.
Bearish: Red candle fully engulfs the prior green candle body.
5. Alerts
Alerts available for each pattern when Stochastic conditions are met.
Example: "Bullish Engulfing + Stochastic confirm".
📌 Important Notes
Do not use this indicator as the sole basis for trading decisions.
Test on a demo account before applying to live trades.
Combine with multi-timeframe analysis, volume, and proper position sizing.
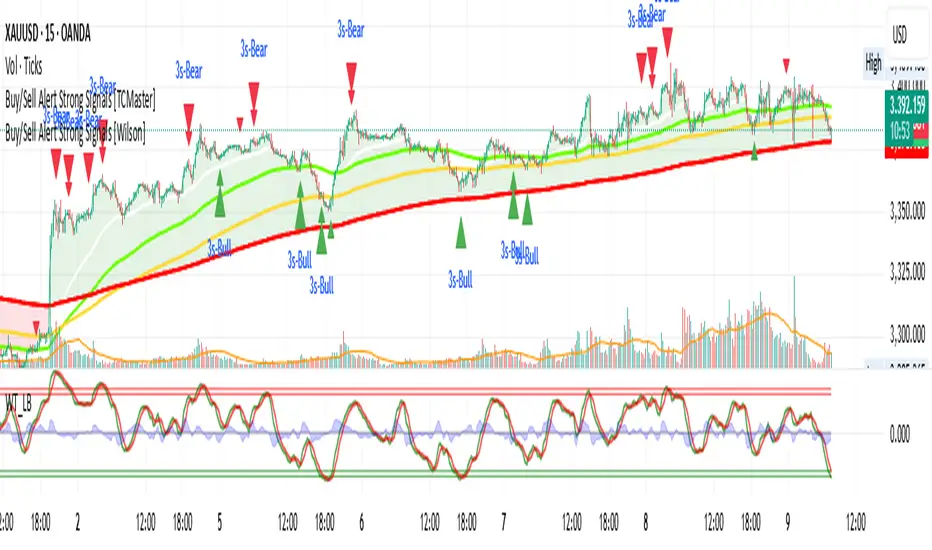
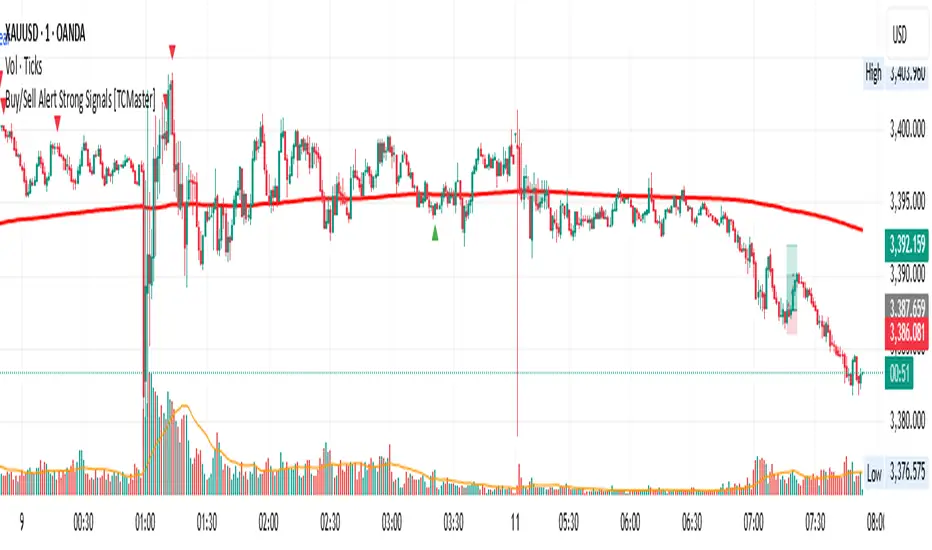
Buy/Sell Alert Strong Signals [TCMaster]This indicator combines Smoothed Moving Averages (SMMA), Stochastic Oscillator, and popular candlestick patterns (Engulfing, 3 Line Strike) to highlight potential trend reversal zones.
Main features:
4 SMMA lines (21, 50, 100, 200) for short-, medium-, and long-term trend analysis.
Trend Fill: Background shading when EMA(2) and SMMA(200) are aligned, visually confirming trend direction.
Stochastic Filter: Filters signals based on overbought/oversold conditions to help reduce noise.
Candlestick pattern recognition:
Bullish/Bearish Engulfing
Bullish/Bearish 3 Line Strike
Alerts for each pattern when Stochastic conditions are met.
⚠️ Note: This is a technical analysis tool. It does not guarantee accuracy and is not financial advice. Always combine with other analysis methods and practice proper risk management.
🛠 How to Use:
1. SMMA Settings
21 SMMA & 50 SMMA: Short- and medium-term trend tracking.
100 SMMA: Optional mid/long-term filter (toggle on/off).
200 SMMA: Major trend direction reference.
2. Trend Fill
EMA(2) > SMMA(200): Background shaded green (uptrend bias).
EMA(2) < SMMA(200): Background shaded red (downtrend bias).
Can be enabled/disabled in settings.
3. Stochastic Filter
K Length, D Smoothing, Smooth K: Adjust sensitivity.
Overbought & Oversold: Default 80 / 20 thresholds.
Buy signals only valid if Stochastic is oversold.
Sell signals only valid if Stochastic is overbought.
4. Candlestick Patterns
3 Line Strike:
Bullish: Three consecutive bullish candles followed by one bearish candle closing below the previous, with potential reversal.
Bearish: Three consecutive bearish candles followed by one bullish candle closing above the previous, with potential reversal.
Engulfing:
Bullish: Green candle fully engulfs the prior red candle body.
Bearish: Red candle fully engulfs the prior green candle body.
5. Alerts
Alerts available for each pattern when Stochastic conditions are met.
Example: "Bullish Engulfing + Stochastic confirm".
📌 Important Notes
Do not use this indicator as the sole basis for trading decisions.
Test on a demo account before applying to live trades.
Combine with multi-timeframe analysis, volume, and proper position sizing.
ADVANCED EMA RIBBON SUITE PRO [Multi-Timeframe + Alerts + Dash]🎯 ADVANCED EMA RIBBON SUITE PRO
📊 DESCRIPTION:
The most comprehensive EMA Ribbon indicator on TradingView, featuring 14 customizable
EMAs (5-200), multi-timeframe analysis, gradient ribbon visualization, smart alerts,
and a real-time dashboard. Perfect for trend following, scalping, and swing trading.
🔥 KEY FEATURES:
• 14 EMAs with Fibonacci sequence option (5, 8, 13, 21, 34, 55, 89, 144, 200)
• Multi-Timeframe (MTF) analysis - see higher timeframe trends
• Dynamic gradient ribbon with trend-based coloring
• Golden Cross & Death Cross detection with alerts
• Professional themes (Dark/Light) with 6 visual styles
• Real-time information dashboard
• Customizable transparency and colors
• Trend strength visualization
• Price position analysis
• Smart alert system for all major crossovers
📈 USE CASES:
• Trend Identification: Ribbon expansion/contraction shows trend strength
• Entry/Exit Signals: EMA crossovers provide clear trade signals
• Support/Resistance: EMAs act as dynamic S/R levels
• Multi-Timeframe Confluence: Combine timeframes for higher probability trades
• Scalping: Use faster EMAs (5-20) for quick trades
• Swing Trading: Focus on 50/200 EMAs for position trades
🎯 TRADING STRATEGIES:
1. Ribbon Squeeze: Trade breakouts when ribbon contracts
2. Golden/Death Cross: Major trend reversals at 50/200 crosses
3. Price Above/Below: Long when price above most EMAs, short when below
4. MTF Confluence: Trade when multiple timeframes align
5. Dynamic S/R: Use EMAs as trailing stop levels
⚡ OPTIMAL SETTINGS:
• Scalping: 5, 8, 13, 21 EMAs on 1-5 min charts
• Day Trading: Full ribbon on 15-60 min charts
• Swing Trading: Focus on 50, 100, 200 EMAs on daily charts
• Position Trading: Use weekly timeframe with monthly MTF
📌 KEYWORDS:
EMA, Exponential Moving Average, Ribbon, Multi-Timeframe, MTF, Golden Cross,
Death Cross, Trend Following, Scalping, Swing Trading, Dashboard, Alerts,
Support Resistance, Fibonacci, Professional, Advanced, Suite, Indicator
*Created using PineCraft AI (Link in Bio)

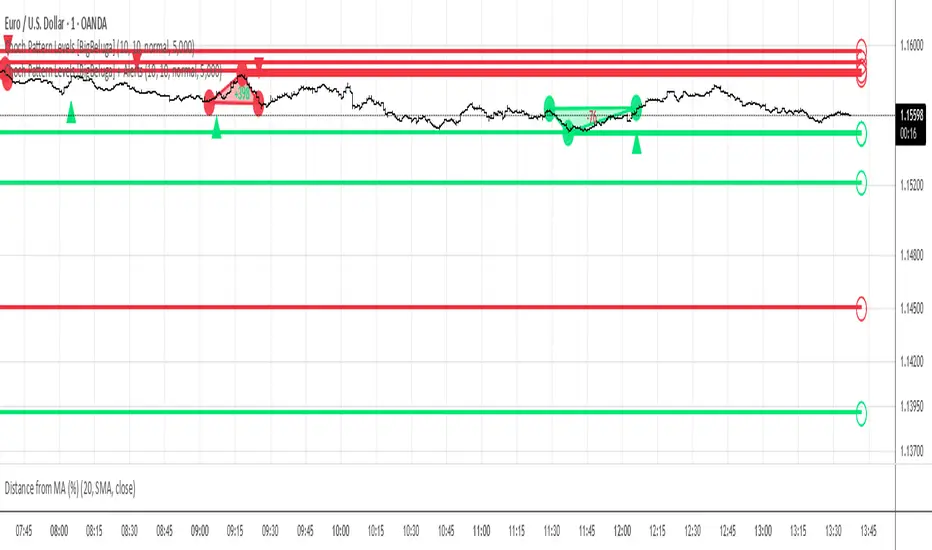
Choch Pattern Levels [BigBeluga] + AlertsThis version of Choch Pattern Levels includes built-in alert conditions for both ChoCh Up and ChoCh Down patterns. You can now set TradingView alerts directly when either pattern occurs, with optional visual markers (triangles) plotted on the chart.
Based on the original script by BigBeluga, licensed under CC BY-NC-SA 4.0. This is a modified version with alert conditions added.
SMA50 - Relleno + AlertasThis is about the 50 SMA and its relationship to price. When the price is above the 50 SMA, it is colored green, indicating a bullish trend. If the price is below the 50 SMA, it is colored red, indicating a bearish trend. It also has alerts when the trend crosses the 50 SMA.

VWAP Combo: Bands + MACD + Volume + AlertsBands: These are dynamic bands using a 20-period standard deviation and 1.5× width by default. Adjust lookback or bandMultiplier to tighten or widen.
Candle Colors: Green = MACD bullish, Red = bearish.
Volume Spike: Orange triangle when volume > 1.5× average.
Alerts: Fire on breakout, bounce, or combo confirmation.

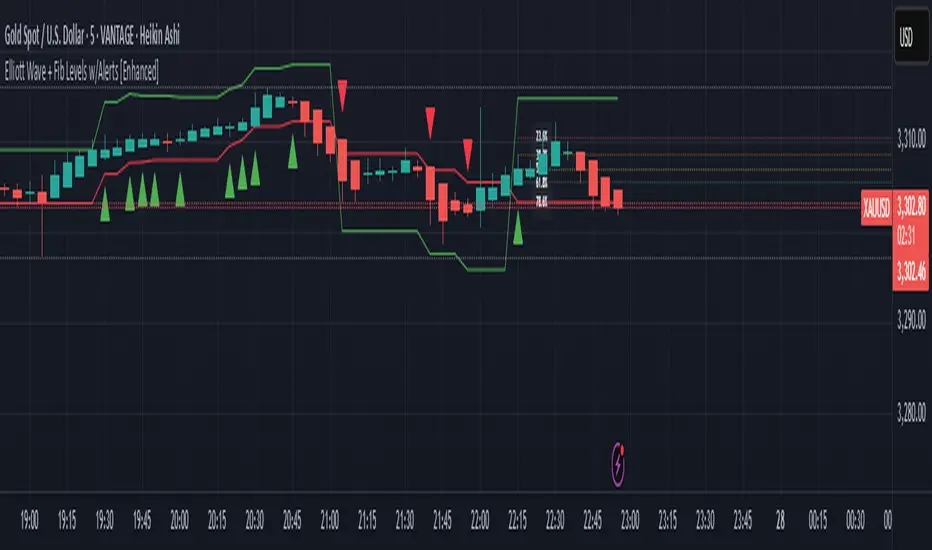
Elliott Wave + Fib Levels w/Alerts [Enhanced]Elliott Wave + Fibonacci Levels with Alerts
This powerful TradingView indicator combines Elliott Wave detection with customizable Fibonacci retracement levels to help identify key price zones and potential trade opportunities. It automatically detects bullish and bearish waves based on recent highs and lows, with an optional EMA filter to improve trend accuracy.
Key features include:
Dynamic detection of Elliott Waves based on configurable wave length.
Visualization of Fibonacci retracement levels on detected waves, with customizable percentage levels and optional labels for clarity.
ATR-based automatic calculation of stop loss and take profit levels with adjustable multipliers.
Real-time alerts triggered on new wave formations, indicating bullish or bearish setups with precise entry price details.
Clean plotting of entry signals, stop loss, and take profit zones directly on the chart.
User-friendly input controls to tailor the indicator to your trading style, including options to toggle EMA filtering, Fibonacci level display, and alert activation.
Ideal for traders looking to combine classic wave analysis with Fibonacci support/resistance levels and actionable trade alerts, this indicator streamlines technical analysis and trade management in one easy-to-use tool.
RSI Crossover Signal Companion - Alerts + Visuals🔷 RSI Crossover Signal Companion — Alerts + Visuals
The Relative Strength Index (RSI) is a momentum oscillator that measures the speed and change of recent price movements. It helps traders identify overbought or oversold conditions, possible trend reversals, and momentum strength.
This utility builds on TradingView’s classic Relative Strength Index (RSI) by adding real-time alerts and triangle markers when the RSI crosses its own moving average — a common technique for early momentum detection.
It is designed as a lightweight, visual companion tool for traders using RSI/MA crossover logic in manual or semi-automated strategies.
🔍 Features
✅ Preserves the full original RSI layout, including:
• Gradient fill and overbought/oversold zones
• Standard RSI input settings (length, source, etc.)
• MA smoothing options with user-defined type and length
🔺 Adds visual triangle markers:
🔼 Up triangle when RSI crosses above its MA
🔽 Down triangle when RSI crosses below its MA
📢 Built-in alerts for RSI/MA crosses:
“RSI Crossed Above MA”
“RSI Crossed Below MA”
📈 How to Use
This script is ideal for:
• Spotting early momentum shifts
• Confirming entries or exits in other systems (price action, trendlines, breakouts)
• Building alert-based automation (webhooks, bots, etc.)
Popular use cases:
• Combine with trend indicators like MA200 or MA12
• Use in confluence with price structure and divergence
• Validate breakout moves with momentum confirmation
⚙️ Customization
RSI length, MA length, MA type, and source are fully adjustable
Triangle marker size, shape, and color can be edited under Style
Alerts are pre-built and ready for use

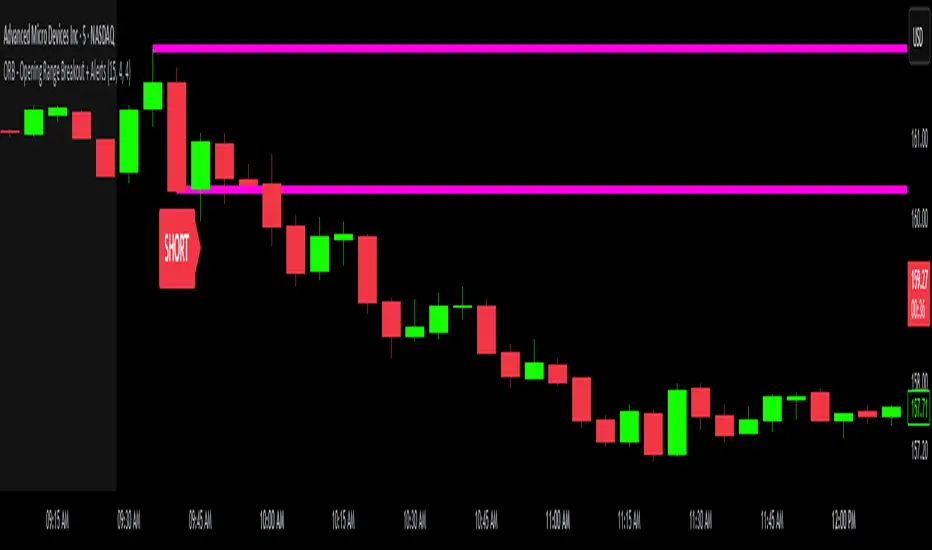
ORB - Opening Range Breakout + AlertsThe only ORB indicator you'll ever need.
- Flexible Range: Tailor the opening range (e.g., 5m, 15m, 30m) to your trading style.
- Key Levels: Auto-plots striking pink/purple support/resistance lines post-range for clear trade setups.
- Breakout Alerts: Reliable LONG/SHORT signals on 5m chart for confirmed breakouts; enable/disable as needed.
- Personalized Design: Customize line color and thickness for optimal visibility.
A friendly reminder that no tool or indicator guarantees success. Integrate this into a robust trading plan.
ICT iFVG Detector and Alert [by ote618]Description
This script detects ICT - fair value gaps (FVG) formed by price gaps between Candle 1 and Candle 3, then monitors the next 5 candles for an inverse fair value gap (iFVG).
What It Detects
Bullish FVG: When Candle 1 high is below Candle 3 low (BISI)
Bearish FVG: When Candle 1 low is above Candle 3 high (SIBI)
Once an FVG is detected, the script checks the next 5 candles:
A Bullish FVG becomes a Bearish IFVG if price closes below Candle 1 high
A Bearish FVG becomes a Bullish IFVG if price closes above Candle 1 low
Only the first bar that validates the FVG triggers the transition to an IFVG.
Visual Output
A shaded rectangle is plotted to mark the original FVG zone (from Candle 1 to Candle 3)
Color-coded:
Red for Bearish IFVG (validated Bullish IG)
Green for Bullish IFVG (validated Bearish IG)
The rectangle extends from Candle 1 to the validating bar
Alerts
You can receive alerts when an FVG becomes an IFVG:
Configurable to fire only on selected timeframes (1m, 5m, 15m, 60m)
Alerts include the direction and the chart timeframe
Settings
Enable Alerts For Timeframe: Choose which timeframe(s) trigger alerts
This tool helps traders identify inverse FVGs (iFVG), a useful ICT concept.

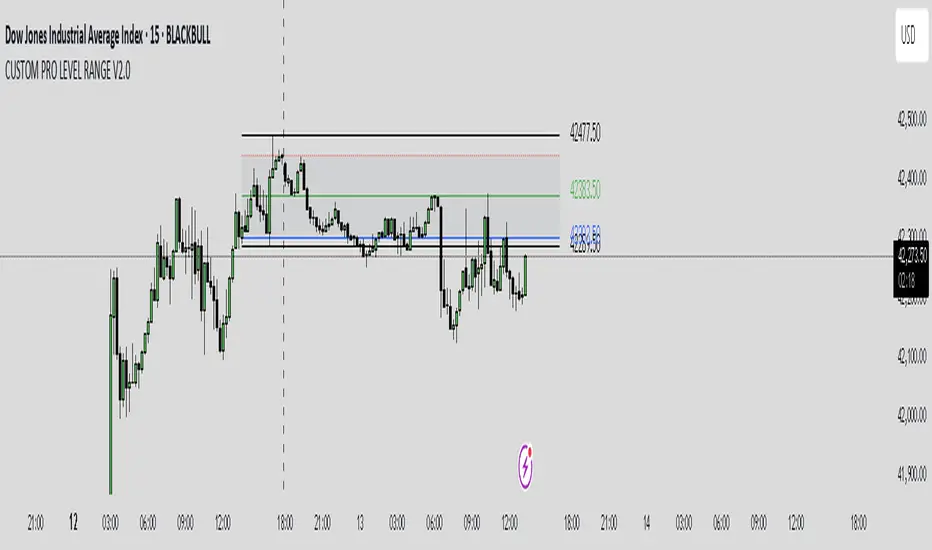
CUSTOM PRO RANGE V2.0 with AlertsCore Functions
Tracks High/Low Ranges
Daily (DR) or Initial (IDR) ranges within custom time windows (e.g., 9:30 AM–4:00 PM).
Optional extended hours (e.g., overnight).
Visual Tools
Draws boxes/lines for range boundaries, midpoints, and opening prices.
Custom colors/styles for clarity.
Smart Alerts
Notifies when price breaks high/low/mid of the range.
Avoids spam with once-per-bar alerts.
Flexible Timeframes
Works for intraday, daily, or even quarterly ranges with minor tweaks.
🎯 Who It Helps
Day Traders: Spot breakouts/reversals.
Swing Traders: Identify key support/resistance.
Analysts: Study price behavior in specific sessions.
Air Gap MTF with alert settingsWhat it shows:
This indicator will show a horizontal line at a price where each EMAs are on on different time frames, which will remove the effort of having to flick through different time frames or look at different chart.
The lines itself will move in real time as price moves and therefore as the EMA values changes so no need to manually adjustment the lines.
How to use it:
The price gap between each of the lines are known as "air gaps", which are essentially zones price can move with less resistance. Therefore bigger the airgap there is more likely more movement in price.
In other words, where lines are can be a resistance (or support) and can expect price stagnation or rejection.
On the chart it is clear to see lines are acting as resistances/supports.
Key settings:
The time frame are fixed to: 30min, 1hr and 4hr. This cannot be changed as of now.
EMA values for each time frame are user changeable in the settings, and up to 4 different values can be chosen for each time frame. Default is 5,12,34 and 50 for each timeframe.
Line colour, thickness and style can be user adjusted. Start point for where line will be drawn can be changed in the settings, either: start of day, user defined start or across the chart. In case of user defined scenario user can input a number that specifies a offset from current candle.
Label colour, font, alignment, text size and text itself can be user adjusted in the settings. Price can be also displayed if user chooses to do so. Position of label (offset from current candle) is user specified and can be adjusted by the user.
Both the lines and labels can be turned off (both and individually), for each lines.
Alert Settings:
Manually, user can set alerts for when price crosses a specific line.
This can be done by:
right click on any of line
choose first option (add alert on...)
On the second option under condition, use the dropdown menu to choose the desired EMA/timeframe to set alert for.
Hit "create" at bottom right of option
----------------------------------------------------------------------
If anything is not clear please let me know!

Volume Candle(alerts)This indicator highlights candles with unusually high trading volume by comparing the current volume to an EMA-based threshold. It helps identify significant volume spikes, which may indicate strong market movements.
Big Volume Detection
Compares the current volume to an EMA of past volume.
A candle is marked as "Big Volume" if the current volume exceeds the EMA by a specified multiple.
Color-Coded Candles
Big Volume & Bullish → Lime Green
Big Volume & Bearish → Red
Regular Bullish → Faded Lime (80% transparent)
Regular Bearish → Faded Red (80% transparent)
Alert System
Big Up or Down Volume → Triggers an alert when high volume occurs.
Big Up Volume → Triggers an alert for high-volume bullish candles.
Big Down Volume → Triggers an alert for high-volume bearish candles.
Customizable Settings
Period → EMA period for volume comparison (Default: 30)
Big Volume Multiple → Volume multiplier threshold for detection (Default: 3)
Use Cases
Spot unusual volume surges before major price moves
Confirm strong buying or selling pressure
Identify potential breakout zones

Hammer and Shooting Star Alerts - FrmRisk2RichesThis custom Pine Script indicator helps traders identify potential reversal signals in the market by detecting the formation of Hammer and Shooting Star candlestick patterns on multiple timeframes. The indicator automatically analyzes the 1-minute, 5-minute, 15-minute, and 30-minute charts, alerting you when a Hammer or Shooting Star candle forms on any of these timeframes.

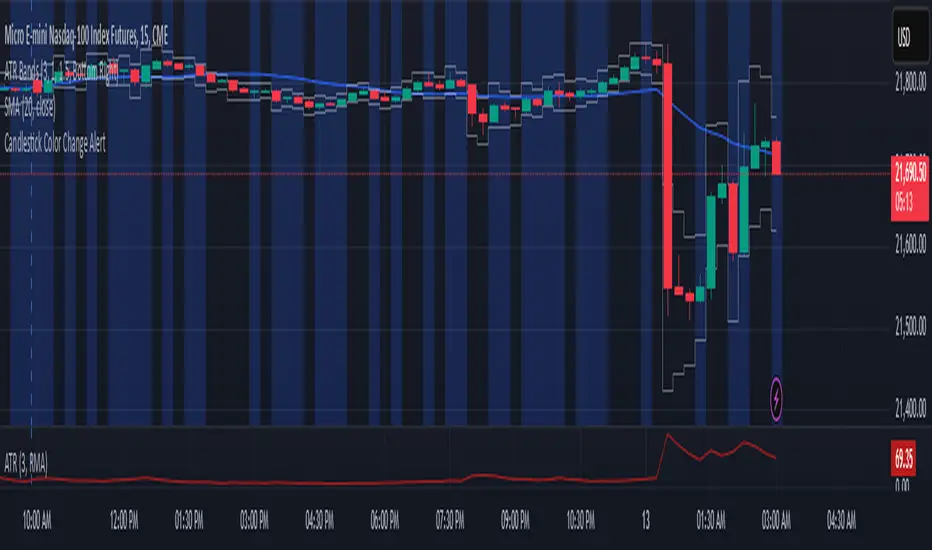
Candlestick Color Change AlertIt is an alert for change of candlestick color.
Identifies Candle Type
A candle is bullish if the closing price is higher than the opening price.
A candle is bearish if the closing price is lower than the opening price.
Detects a Color Change
The script checks if the current candle is bullish while the previous candle was bearish, or vice versa.
If a change is detected, an alert is triggered.
Triggers an Alert
Users receive an alert notification whenever a candlestick color change occurs.
Alerts can be set for popup, email, mobile push, or webhook notifications.
Visual Highlighting (Optional)
The script can also apply a background color (blue) on the chart to visually mark color changes.