Zindarra Multi Alerts Advanced (8 Symbols, 8 Levels) by RRBZindarra Multi Alerts Advanced by RRB by RagingRocketBull 2018
Version 1.0
This indicator lets you configure multiple alert levels for several assets. Zindarra Multi Alerts Advanced supports 8 symbols with 8 custom alert levels.
You can have an M:M relationship betweeen symbols and levels, for example:
- 4 symbols each boxed by 2 alerts above/below the price
- 3 symbols with 1 alert each
- 2 symbols, 1st with 2 alerts, 2nd - with 6 alerts
- 1 symbol with 8 alerts etc
There are several versions: Simple, Pro, Advanced and Ultimate. This is the Advanced version. The Differences are listed below.
- Simple: 10 Alert Levels, 1 plot mode, alert type: cross, no colors/triggered alerts
- Pro: 9 Alert Levels, 2 plot modes: plot/price line, alert type: cross, +change/swap colors, +hide/disable triggered alerts, 2 penetration modes (close, high/low), trigger on confirmed close
- Advanced: 8 Symbols/Tickers, 8 Alert Levels, +alert types: cross up/cross down, no color change. Display sources as lines/candles, normalize, scale/shift independently
- Ultimate: 5 Symbols/Tickers, 8 Alert Levels, +alert types: volume/price %/abs change, volume/ema/time cross
Features:
- 8 custom symbols, symbols:levels = M:M
- 8 custom alert levels with labels. For each alert there must be a corresponding non-empty symbol (can be a duplicate)
- alert types: cross/cross up/cross down
- normalize symbols (and alert levels) to 100% to compare,
- scale and shift each symbol (and alert levels) to position on a chart independently
- 1 alert levels plot mode: plot
- 2 symbol types: line/candles
- colorize symbol candles
- high/low or close level penetration modes
- show/hide levels/labels
- keep or auto disable triggered alerts
- trigger alerts only after a confirmed close
You will see all symbols on a single chart at the same time with their corresponding alert levels. From this chart you can manage all alerts configured for multiple assets.
Although TradingView has 2 percentage scale modes (Percent, Indexed to 100), somehow they still fail to be usefull when comparing multiple assets.
This indicator lets you normalize all symbols to 100% making a direct single scale comparison between assets with vastly different price levels possible.
All alert levels will be normalized as well.
TradingView does not let you move the plots attached to left scale. When scaled they all remain stuck in the center and can't be moved vertically or relative to each other.
This indicator lets you position all symbols independently using individual scale and shift settings. For example, you can:
- split your screen in 3 horiz areas and have a symbol in each of them without overlapping or
- have several partially overlapping assets with different scale each or
- have all assets fully overlapping and normalized to the same 100% scale
You have to manually create an alert in Manage Alerts Panel and configure it to use with this indicator.
Free accounts are limited to only 1 alert slot and this indicator will take it (any existing alerts must be disabled/stopped).
Once the alert is configured, the indicator can be removed from chart to free a slot for another indicator, but you won't see the alert levels.
Usage:
1. attach indicator to a chart
2. define alert levels in UI settings
3. in TradingView's Manage Alerts panel on the right:
- for free accounts: disable/stop all existing alerts, you are limited to 1 alert slot only. Otherwise you won't be able to save.
- create a new Alert:
- select 'Multi Alerts' indicator name in the Condition dropdown box, leave Level 1 and Multi Alerts Cross as default options
- select 'Once Per Bar' or 'Once Per Minute' instead of 'Only Once' to trigger the alert multiple times
5. click Save. Your 9 alerts are enabled now.
Change Settings:
1. change levels/settings in UI. Any changes will also reset already triggered levels visibility.
2. in Manage Alerts panel:
- open/edit the alert you created
- select new instance of 'Multi Alerts' indicator name in the Condition dropdown box (appears at the bottom)
- check the Condition dropdown again - a single instance should remain selected.
3. click Save. Your alert settings are updated.
Notes on using alerts:
- attaching this indicator to a chart and configuring alert levels will not automatically enable the alerts - you have to manually create/configure a new alert in the Alerts Panel
- removing this indicator from chart will not disable the alerts, you have to manually disable the alert you created in the Alerts Panel
- your alert in the Alerts Panel uses another instance (copy) of indicator/settings. Any changes won't affect the alert. You have to manually update the alert every time you change any settings in the indicator.
- recompiling and attaching your own version of indicator will require creating a new Alert (delete the old one).
- alerts are designed to work in realtime. In replay mode you will see triggered alert levels hiding/changing colors but there will be no system alert messages. It's best to test the indicator in realtime on M1 (1 min) chart
- you will only see 1 system alert per bar/60 sec when multiple alert levels are crossed with a single bar or across several symbols at the same time. However all of these levels will hide in the indicator as expected.
- you can only see the alert levels when the indicator is attached to chart, they are not shown by the system alert.
- For source=high/low a directional level penetration is used automatically (crossunder/low and crossover/high). For source=close a standard bidirectional cross is used unless another alert type is specified.
- normalization breaks/distorts alert levels and symbol price - this is normal and is expected. To view the real price of alert levels uncheck normalize - the first 8 outputs are alert levels. Unnormalized levels are straight lines.
- you will see alerts from all symbols in the system alert message box of the current symbol - a bit confusing, but there's no workaround, you can't have a customized alert message for each symbol/level
- many tickers as arguments can stretch/break TradingView's Create New Alert dialog but it's still possible to push all required buttons and Save.
- duplicate symbols will be displayed by default. You can manually hide duplicates using show/hide flags.
- empty tickers (and corresponding alerts) are essentially disabled
1. uses plot*, cross*, barssince, highest, security, alertcondition
"alert" için komut dosyalarını ara
Zindarra Multi Alerts by RRBZindarra Multi Alerts by RRB by RagingRocketBull 2018
Version 1.0
This indicator lets you configure multiple alert levels for an asset. Zindarra Multi Alerts supports 10 custom alert levels.
You have to manually create an alert in Manage Alerts Panel and configure it to use with this indicator.
Free accounts are limited to only 1 alert slot and this indicator will take it (any existing alerts must be disabled/stopped).
Once the alert is configured, the indicator can be removed from chart to free a slot for another indicator, but you won't see the alert levels.
This is the Zindarra Multi Alerts Simple version. You can't auto disable already triggered alerts in this indicator. All alerts will remain active.
If you want to be able to hide/disable/change color of the triggered alert levels use the Zindarra Multi Alerts Pro version.
Features:
- 10 custom alert levels with labels
- set open/high/low/close source point for level penetration
- show/hide levels/labels
Usage:
1. attach indicator to a chart
2. define alert levels in UI settings
3. in TradingView's Manage Alerts panel on the right:
- for free accounts: disable/stop all existing alerts, you are limited to 1 alert slot only. Otherwise you won't be able to save.
- create a new Alert:
- select 'Multi Alerts' indicator name in the Condition dropdown box, leave Level 1 and Multi Alerts Cross as default options
- select 'Once Per Bar' or 'Once Per Minute' instead of 'Only Once' to trigger the alert multiple times
5. click Save. Your 9 alerts are enabled now.
Change Settings:
1. change levels/settings in UI
2. in Manage Alerts panel:
- open/edit the alert you created
- select new instance of 'Multi Alerts' indicator name in the Condition dropdown box (appears at the bottom)
- check the Condition dropdown again - a single instance should remain selected.
3. click Save. Your alert settings are updated.
Notes on using alerts:
- attaching this indicator to a chart and configuring alert levels will not automatically enable the alerts - you have to manually create/configure a new alert in the Alerts Panel
- removing this indicator from chart will not disable the alerts, you have to manually disable the alert you created in the Alerts Panel
- your alert in the Alerts Panel uses another instance (copy) of indicator/settings. Any changes won't affect the alert. You have to manually update the alert every time you change any settings in the indicator.
- recompiling and attaching your own version of indicator will require creating a new Alert (delete the old one).
- alerts are designed to work in realtime. In replay mode you will see only the alert levels but there will be no system alert messages. It's best to test the indicator in realtime on M1 (1 min) chart
- you will only see 1 system alert per bar/60 sec when multiple alert levels are crossed with a single bar.
- you can only see the alert levels when the indicator is attached to chart, they are not shown by the system alert.
- a standard bidirectional cross is used for all penetration sources
1. uses plot*, cross*, alertcondition
Zindarra Multi Alerts Pro (9 Levels) by RRBZindarra Multi Alerts Pro by RRB by RagingRocketBull 2018
Version 1.0
This indicator lets you configure multiple alert levels for an asset. Zindarra Multi Alerts Pro supports 9 custom alert levels.
You have to manually create an alert in Manage Alerts Panel and configure it to use with this indicator.
Free accounts are limited to only 1 alert slot and this indicator will take it (any existing alerts must be disabled/stopped).
Once the alert is configured, the indicator can be removed from chart to free a slot for another indicator, but you won't see the alert levels.
If you want 10 alert levels and don't need colors and Pro features - use Multi Alerts Simple version instead.
Features:
- 9 custom alert levels with labels
- 2 plot modes: plot and price line
- high/low or close level penetration modes
- show/hide levels/labels
- change color based on level position above/below price
- keep or auto disable triggered alerts
- trigger alerts only after a confirmed close
- swap level colors
Usage:
1. attach indicator to a chart
2. define alert levels in UI settings
3. in TradingView's Manage Alerts panel on the right:
- for free accounts: disable/stop all existing alerts, you are limited to 1 alert slot only. Otherwise you won't be able to save.
- create a new Alert:
- select 'Multi Alerts' indicator name in the Condition dropdown box, leave Level 1 and Multi Alerts Cross as default options
- select 'Once Per Bar' or 'Once Per Minute' instead of 'Only Once' to trigger the alert multiple times
5. click Save. Your 9 alerts are enabled now.
Change Settings:
1. change levels/settings in UI. Any changes will also reset already triggered level colors/visibility.
2. in Manage Alerts panel:
- open/edit the alert you created
- select new instance of 'Multi Alerts' indicator name in the Condition dropdown box (appears at the bottom)
- check the Condition dropdown again - a single instance should remain selected.
3. click Save. Your alert settings are updated.
Notes on using alerts:
- attaching this indicator to a chart and configuring alert levels will not automatically enable the alerts - you have to manually create/configure a new alert in the Alerts Panel
- removing this indicator from chart will not disable the alerts, you have to manually disable the alert you created in the Alerts Panel
- your alert in the Alerts Panel uses another instance (copy) of indicator/settings. Any changes won't affect the alert. You have to manually update the alert every time you change any settings in the indicator.
- recompiling and attaching your own version of indicator will require creating a new Alert (delete the old one).
- alerts are designed to work in realtime. In replay mode you will see triggered alert levels hiding/changing colors but there will be no system alert messages. It's best to test the indicator in realtime on M1 (1 min) chart
- you will only see 1 system alert per bar/60 sec when multiple alert levels are crossed with a single bar. However all of these levels will hide/change color in the indicator as expected.
- plot modes: price line - changes color of the whole level, style is not configurable; plot - changes color of a level's segment after each cross, configurable style
- you can only see the alert levels when the indicator is attached to chart, they are not shown by the system alert.
- For source=high/low a directional level penetration is used automatically (crossunder/low and crossover/high). For source=close a standard bidirectional cross is used. Colors always change above/below close.
1. uses plot*, cross*, alertcondition

Time-based Alerts for Trading Windows🌟 Time-based Alerts for Trading Windows 🌐📈
This is a re-uploaded script as the previous one got hidden.
This Time-based Alerts for Trading Windows script is a highly customizable and reliable tool designed to assist traders in managing automated strategies or manually monitoring specific market conditions. Inspired by CrossTrade's Time-based Alert, this script is tailored for those who rely on precise time windows to trigger actions, such as sending webhook signals or managing Expert Advisors (EAs).
Whether you are a scalper, day trader, or algorithmic trader, this script empowers you to stay on top of your trades with fully customizable time-based alerts.
🛠️ Customizable Time Alerts
This indicator allows you to create up to 12 unique time windows by specifying the exact hour and minute for each alert. Each time window corresponds to an individual alert condition, making it perfect for managing trades during specific market sessions or key time periods.
For example:
Alert 1 can be set at 9:30 AM (market open).
Alert 2 can be set at 3:55 PM (just before market close).
Each alert can be toggled on or off in the indicator settings, allowing you to manage alerts without having to reconfigure your script.
You can adjust the colours to fit any colour scheme you like!
🕒 Odd and Even Time Alerts
The script comes with three built-in alert type categories:
Odd Alerts (marked with a green triangle on the chart): These correspond to odd-numbered inputs like Alert 1, Alert 3, Alert 5, and so on.
Even Alerts (marked with a red triangle on the chart): These correspond to even-numbered inputs like Alert 2, Alert 4, Alert 6, and so on.
You can also customize all 12 alerts individually to include a custom alert message
These alerts serve as a convenient way to differentiate between multiple trading strategies or market conditions. You can customize alert messages for odd and even alerts directly from TradingView’s alert panel.
🔗 Webhook Integration for Automation
This script is fully compatible with webhook-based automation. By configuring your alerts in TradingView, you can send signals to trading bots, EAs, or any third-party system. For example, you can:
Turn off an EA at a specific time (e.g., 3:55 PM EST).
Send buy/sell signals to your bot during predefined trading windows.
Simply use TradingView’s alert message editor to format webhook payloads for your automation system.
🌐 Timezone Flexibility
Trading happens across multiple time zones, and this script accounts for that. You can toggle between:
Eastern Time (New York): Ideal for most US-based markets.
Central Time (Exchange): Useful for futures and commodities traders.
This ensures your alerts are always in sync with your preferred time zone, eliminating confusion.
🎨 Visual Indicators
The script plots visual markers directly on your chart to indicate active alerts:
Up Facing Triangles: Represent odd-numbered alerts, providing a quick reference for these time windows.
Down Facing Triangles: Represent even-numbered alerts, helping you track different strategies or conditions.
These visual markers make it easy to see when alerts are triggered, even at a glance.
📈 Practical Use Case
Let’s say you’re trading the USTEC index on a 1-minute chart. You want to:
Turn off your trading bot at 16:55 EST to avoid after-market volatility.
Trigger a re-entry signal at 17:30 EST to capture moves during the Asian session.
Visually monitor these actions on your chart for easy reference.
This script makes it possible with precision alerts and webhook integration. Simply configure the time windows in the settings and set up your alerts in TradingView.
🚨 How to Set Up Alerts
Enable or Disable Alerts: Use the script’s settings to toggle specific alerts on or off as needed.
Set Custom Time Windows: Define the hour and minute for each alert in the settings panel.
Create Alerts in TradingView:
Go to the TradingView alert panel.
Select the condition (e.g., "Odd Time-based Alert (Green)" or "Even Time-based Alert (Red)").
Customize the alert message for webhook integration or personal notification.
Choose the trigger type: Once Per Bar or Once Per Bar Close to keep the alert active.
Integrate with Webhooks: Use the alert message field to format payloads for automation systems like MT4, MT5, or third-party bots.
📋 Key Notes
Alerts can trigger indefinitely if set to "Once Per Bar" or "Once Per Bar Close".
Always ensure the expiration date is set far in the future to avoid unexpected alert deactivation.
Test webhook messages and alert configurations thoroughly before using them in live trading.
This script is a powerful addition to your trading toolbox, offering precision, flexibility, and automation capabilities. Whether you’re turning off an EA, managing trades during market sessions, or automating strategies via webhooks, this script is here to support you.
Start using the Time-based Alerts for Trading Windows today and trade with confidence! 🚀✨

Momentum candle w/ AlertMomentum Candle Indicator with Alerts
The Momentum Candle Indicator is designed to assist traders in identifying candles that exhibit strong momentum based on customizable criteria. This indicator visually highlights momentum candles and provides alerting functionality to ensure timely notifications about significant price movements. It is flexible and suited for various trading styles, offering easy configuration.
Key Features:
Momentum Candle Detection: Identifies candles with a body size and wick characteristics indicative of momentum. The detection criteria are fully customizable to fit individual trading strategies.
Customizable Parameters:
- Minimum Body Size (Pips): The minimum size of the candle body, in pips, for it to be considered a momentum candle.
- Minimum Wick-to-Body Ratio (%): Specifies the minimum percentage of wick relative to the body size to qualify as momentum.
- Maximum Wick-to-Body Ratio (%): Sets the upper limit for the wick-to-body ratio to filter out candles with excessive wicks.
- Timeframe: Select the timeframe for momentum candle analysis (e.g., 15 minutes, 1 hour, etc.).
- Alert Trigger Option: Choose between alerts that trigger at candle close or in real-time when criteria are met. Real-time alerts are sent as soon as the criteria are met, but there is no guarantee that the candle will remain a valid momentum candle at its close.
- Show Detail: Enable or disable additional labels on the chart that display metrics for valid momentum candles.
- Enable Candle Debug: Activate debug mode to show detailed metrics for every candle, assisting in fine-tuning settings.
Visual Feedback: Highlights valid momentum candles on the chart for easy identification. Optional labels display metrics like body size, wick size, and ratios.
Alerts: Configurable alerts notify you whenever a momentum candle is detected, based on your defined criteria.
How to Use:
Add the Indicator to Your Chart: Add this script to your TradingView chart as an indicator.
Configure the Settings: Open the settings panel and adjust the parameters: Define the Minimum Body Size in pips. Set the Wick-to-Body Ratio thresholds. Choose the timeframe for analysis. Select the alert trigger option ( real-time or candle close ). Enable or disable labels and debug information.
Set Up Alerts: Open the TradingView alert panel. Select the condition for this script (e.g., " Momentum Candle Detected "). Customize the alert message and preferences. Click Create to activate the alert.
Analyze Results: Review highlighted momentum candles on the chart. Use optional debug labels for a detailed breakdown of candle metrics.
Why Use This Indicator?
Momentum candles often indicate significant market movements, providing valuable insights for trend-following or breakout strategies. This indicator automates the detection and alert process, helping traders focus on strategy execution while ensuring they don’t miss key opportunities.
With customizable parameters and real-time feedback, this tool is practical, adaptable, and designed to simplify momentum analysis.

888 BOT #alerts█ 888 BOT #alerts
This is an Expert Advisor 'EA' or Automated trading script for ‘longs’ and ‘shorts’, which uses only a Take Profit or, in the worst case, a Stop Loss to close the trade.
It's a much improved version of the previous ‘Repanocha’. It doesn`t use 'Trailing Stop' or 'security ()' functions (although using a security function doesn`t mean that the script repaints) and all signals are confirmed, therefore the script doesn`t repaint in alert mode and is accurate in backtest mode.
Apart from the previous indicators, some more and other functions have been added for Stop-Loss, re-entry and leverage.
It uses 8 indicators, (many of you already know what they are, but in case there is someone new), these are the following:
1. Jurik Moving Average
It's a moving average created by Mark Jurik for professionals which eliminates the 'lag' or delay of the signal. It's better than other moving averages like EMA, DEMA, AMA or T3.
There are two ways to decrease noise using JMA. Increasing the 'LENGTH' parameter will cause JMA to move more slowly and therefore reduce noise at the expense of adding 'lag'
The 'JMA LENGTH', 'PHASE' and 'POWER' parameters offer a way to select the optimal balance between 'lag' and over boost.
Green: Bullish, Red: Bearish.
2. Range filter
Created by Donovan Wall, its function is to filter or eliminate noise and to better determine the price trend in the short term.
First, a uniform average price range 'SAMPLING PERIOD' is calculated for the filter base and multiplied by a specific quantity 'RANGE MULTIPLIER'.
The filter is then calculated by adjusting price movements that do not exceed the specified range.
Finally, the target ranges are plotted to show the prices that will trigger the filter movement.
Green: Bullish, Red: Bearish.
3. Average Directional Index (ADX Classic) and (ADX Masanakamura)
It's an indicator designed by Welles Wilder to measure the strength and direction of the market trend. The price movement is strong when the ADX has a positive slope and is above a certain minimum level 'ADX THRESHOLD' and for a given period 'ADX LENGTH'.
The green color of the bars indicates that the trend is bullish and that the ADX is above the level established by the threshold.
The red color of the bars indicates that the trend is down and that the ADX is above the threshold level.
The orange color of the bars indicates that the price is not strong and will surely lateralize.
You can choose between the classic option and the one created by a certain 'Masanakamura'. The main difference between the two is that in the first it uses RMA () and in the second SMA () in its calculation.
4. Parabolic SAR
This indicator, also created by Welles Wilder, places points that help define a trend. The Parabolic SAR can follow the price above or below, the peculiarity that it offers is that when the price touches the indicator, it jumps to the other side of the price (if the Parabolic SAR was below the price it jumps up and vice versa) to a distance predetermined by the indicator. At this time the indicator continues to follow the price, reducing the distance with each candle until it is finally touched again by the price and the process starts again. This procedure explains the name of the indicator: the Parabolic SAR follows the price generating a characteristic parabolic shape, when the price touches it, stops and turns (SAR is the acronym for 'stop and reverse'), giving rise to a new cycle. When the points are below the price, the trend is up, while the points above the price indicate a downward trend.
5. RSI with Volume
This indicator was created by LazyBear from the popular RSI.
The RSI is an oscillator-type indicator used in technical analysis and also created by Welles Wilder that shows the strength of the price by comparing individual movements up or down in successive closing prices.
LazyBear added a volume parameter that makes it more accurate to the market movement.
A good way to use RSI is by considering the 50 'RSI CENTER LINE' centerline. When the oscillator is above, the trend is bullish and when it is below, the trend is bearish.
6. Moving Average Convergence Divergence (MACD) and (MAC-Z)
It was created by Gerald Appel. Subsequently, the histogram was added to anticipate the crossing of MA. Broadly speaking, we can say that the MACD is an oscillator consisting of two moving averages that rotate around the zero line. The MACD line is the difference between a short moving average 'MACD FAST MA LENGTH' and a long moving average 'MACD SLOW MA LENGTH'. It's an indicator that allows us to have a reference on the trend of the asset on which it is operating, thus generating market entry and exit signals.
We can talk about a bull market when the MACD histogram is above the zero line, along with the signal line, while we are talking about a bear market when the MACD histogram is below the zero line.
There is the option of using the MAC-Z indicator created by LazyBear, which according to its author is more effective, by using the parameter VWAP (volume weighted average price) 'Z-VWAP LENGTH' together with a standard deviation 'STDEV LENGTH' in its calculation.
7. Volume Condition
Volume indicates the number of participants in this war between bulls and bears, the more volume the more likely the price will move in favor of the trend. A low trading volume indicates a lower number of participants and interest in the instrument in question. Low volumes may reveal weakness behind a price movement.
With this condition, those signals whose volume is less than the volume SMA for a period 'SMA VOLUME LENGTH' multiplied by a factor 'VOLUME FACTOR' are filtered. In addition, it determines the leverage used, the more volume, the more participants, the more probability that the price will move in our favor, that is, we can use more leverage. The leverage in this script is determined by how many times the volume is above the SMA line.
The maximum leverage is 8.
8. Bollinger Bands
This indicator was created by John Bollinger and consists of three bands that are drawn superimposed on the price evolution graph.
The central band is a moving average, normally a simple moving average calculated with 20 periods is used. ('BB LENGTH' Number of periods of the moving average)
The upper band is calculated by adding the value of the simple moving average X times the standard deviation of the moving average. ('BB MULTIPLIER' Number of times the standard deviation of the moving average)
The lower band is calculated by subtracting the simple moving average X times the standard deviation of the moving average.
the band between the upper and lower bands contains, statistically, almost 90% of the possible price variations, which means that any movement of the price outside the bands has special relevance.
In practical terms, Bollinger bands behave as if they were an elastic band so that, if the price touches them, it has a high probability of bouncing.
Sometimes, after the entry order is filled, the price is returned to the opposite side. If price touch the Bollinger band in the same previous conditions, another order is filled in the same direction of the position to improve the average entry price, (% MINIMUM BETTER PRICE ': Minimum price for the re-entry to be executed and that is better than the price of the previous position in a given %) in this way we give the trade a chance that the Take Profit is executed before. The downside is that the position is doubled in size. 'ACTIVATE DIVIDE TP': Divide the size of the TP in half. More probability of the trade closing but less profit.
█ STOP LOSS and RISK MANAGEMENT.
A good risk management is what can make your equity go up or be liquidated.
The % risk is the percentage of our capital that we are willing to lose by operation. This is recommended to be between 1-5%.
% Risk: (% Stop Loss x % Equity per trade x Leverage) / 100
First the strategy is calculated with Stop Loss, then the risk per operation is determined and from there, the amount per operation is calculated and not vice versa.
In this script you can use a normal Stop Loss or one according to the ATR. Also activate the option to trigger it earlier if the risk percentage is reached. '% RISK ALLOWED' wich is calculated according with: '%EQUITY ON EACH ENTRY'. Only works with Stop Loss on 'NORMAL' or 'BOTH' mode.
'STOP LOSS CONFIRMED': The Stop Loss is only activated if the closing of the previous bar is in the loss limit condition. It's useful to prevent the SL from triggering when they do a ‘pump’ to sweep Stops and then return the price to the previous state.
█ ALERTS
There is an alert for each leverage, therefore a maximum of 8 alerts can be set for 'long' and 8 for 'short', plus an alert to close the trade with Take Profit or Stop Loss in market mode. You can also place Take Profit limit and Stop Loss limit orders a few seconds after filling the position entry order.
- 'MAXIMUM LEVERAGE': It is the maximum allowed multiplier of the % quantity entered on each entry for 1X according to the volume condition.
- 'ADVANCE ALERTS': There is always a time delay from when the alert is triggered until it reaches the exchange and can be between 1-15 seconds. With this parameter, you can advance the alert by the necessary seconds to activate it earlier. In this way it can be synchronized with the exchange so that the execution time of the entry order to the position coincides with the opening of the bar.
The settings are for Bitcoin at Binance Futures (BTC: USDTPERP) in 30 minutes.
For other pairs and other timeframes, the settings have to be adjusted again. And within a month, the settings will be different because we all know the market and the trend are changing.
█ 888 BOT (SPANISH)
Este es un Expert Advisor 'EA' o script de trading automatizado para ‘longs’ y ‘shorts’, el cual, utiliza solo un Take Profit o, en el peor de los casos, un Stop Loss para cerrar el trade.
Es una versión muy mejorada del anterior ‘Repanocha’. No utiliza ‘Trailing Stop’, ni funciones ‘security()’ (aunque usar una función security no significa que el script repinte) y todas las señales son confirmadas, por consiguiente, el script no repinta en modo alertas y es preciso en en el modo backtest.
Aparte de los anteriores indicadores se han añadido algunos más y otras funciones para Stop-Loss, de re-entrada y apalancamiento.
Utiliza 8 indicadores, (muchos ya sabéis sobradamente lo que son, pero por si hay alguien nuevo), son los siguientes:
1. Jurik Moving Average
Es una media móvil creada por Mark Jurik para profesionales la cual elimina el ‘lag’ o retardo de la señal. Es mejor que otras medias móviles como la EMA, DEMA, AMA o T3.
Hay dos formas de disminuir el ruido utilizando JMA. El aumento del parámetro 'LENGTH' hará que JMA se mueva más lentamente y, por lo tanto, reducirá el ruido a expensas de añadir ‘lag’
Los parámetros 'JMA LENGTH', 'PHASE' y 'POWER' ofrecen una forma de seleccionar el equilibrio óptimo entre ‘lag’ y sobre impulso.
Verde : Alcista, Rojo: Bajista.
2. Range filter
Creado por Donovan Wall, su función es la de filtrar o eliminar el ruido y poder determinar mejor la tendencia del precio a corto plazo.
Primero, se calcula un rango de precio promedio uniforme 'SAMPLING PERIOD' para la base del filtro y se multiplica por una cantidad específica 'RANGE MULTIPLIER'.
A continuación, el filtro se calcula ajustando los movimientos de precios que no exceden el rango especificado.
Por último, los rangos objetivo se trazan para mostrar los precios que activarán el movimiento del filtro.
Verde : Alcista, Rojo: Bajista.
3. Average Directional Index (ADX Classic) y (ADX Masanakamura)
Es un indicador diseñado por Welles Wilder para medir la fuerza y dirección de la tendencia del mercado. El movimiento del precio tiene fuerza cuando el ADX tiene pendiente positiva y está por encima de cierto nivel mínimo 'ADX THRESHOLD' y para un periodo dado 'ADX LENGTH'.
El color verde de las barras indica que la tendencia es alcista y que el ADX está por encima del nivel establecido por el threshold.
El color Rojo de las barras indica que la tendencia es bajista y que el ADX está por encima del nivel de threshold.
El color naranja de las barras indica que el precio no tiene fuerza y seguramente lateralizará.
Se puede elegir entre la opción clásica y la creada por un tal 'Masanakamura'. La diferencia principal entre los dos es que en el primero utiliza RMA() y en el segundo SMA() en su cálculo.
4. Parabolic SAR
Este indicador, creado también por Welles Wilder, coloca puntos que ayudan a definir una tendencia. El Parabolic SAR puede seguir al precio por encima o por debajo, la particularidad que ofrece es que cuando el precio toca al indicador, este salta al otro lado del precio (si el Parabolic SAR estaba por debajo del precio salta arriba y viceversa) a una distancia predeterminada por el indicador. En este momento el indicador vuelve a seguir al precio, reduciendo la distancia con cada vela hasta que finalmente es tocado otra vez por el precio y se vuelve a iniciar el proceso. Este procedimiento explica el nombre del indicador: el Parabolic SAR va siguiendo al precio generando una característica forma parabólica, cuando el precio lo toca, se para y da la vuelta (SAR son las siglas en inglés de ‘stop and reverse’), dando lugar a un nuevo ciclo. Cuando los puntos están por debajo del precio, la tendencia es alcista, mientras que los puntos por encima del precio indica una tendencia bajista.
5. RSI with Volume
Este indicador lo creo un tal LazyBear de TV a partir del popular RSI.
El RSI es un indicador tipo oscilador utilizado en análisis técnico y creado también por Welles Wilder que muestra la fuerza del precio mediante la comparación de los movimientos individuales al alza o a la baja de los sucesivos precios de cierre.
LazyBear le añadió un parámetro de volumen que lo hace más preciso al movimiento del mercado.
Una buena forma de usar el RSI es teniendo en cuenta la línea central de 50 'RSI CENTER LINE'. Cuando el oscilador está por encima, la tendencia es alcista y cuando está por debajo la tendencia es bajista.
6. Moving Average Convergence Divergence (MACD) y (MAC-Z)
Fue creado por Gerald Appel. Posteriormente se añadió el histograma para anticipar el cruce de medias. A grandes rasgos podemos decir que el MACD es un oscilador consistente en dos medias móviles que van girando en torno a la línea de cero. La línea del MACD no es más que la diferencia entre una media móvil corta 'MACD FAST MA LENGTH' y una media móvil larga 'MACD SLOW MA LENGTH'. Es un indicador que nos permite tener una referencia sobre la tendencia del activo sobre el cual se está operando, generando de este modo señales de entrada y salida del mercado.
Podemos hablar de mercado alcista cuando el histograma del MACD se sitúe por encima de la línea cero, junto con la línea de señal, mientras que hablaremos de mercado bajista cuando el histograma MACD se situará por debajo de la línea cero.
Está la opción de utilizar el indicador MAC-Z creado por LazyBear que según su autor es más eficaz, por utilizar el parámetro VWAP (precio medio ponderado por volumen) 'Z-VWAP LENGTH' junto con una desviación standard 'STDEV LENGTH' en su cálculo.
7. Volume Condition
El volumen indica el número de participantes en esta guerra entre toros y osos, cuanto más volumen más probabilidad de que se mueva el precio a favor de la tendencia. Un volumen bajo de negociación indica un menor número de participantes e interés por el instrumento en cuestión. Los bajos volúmenes pueden revelar debilidad detrás de un movimiento de precios.
Con esta condición se filtran aquellas señales cuyo volumen es inferior a la SMA de volumen para un periodo 'SMA VOLUME LENGTH' multiplicado por un factor 'VOLUME FACTOR'. Además, determina el apalancamiento utilizado, a más volumen, más participantes, más probabilidad de que se mueva el precio a nuestro favor, es decir, podemos utilizar más apalancamiento. El apalancamiento en este script lo determina las veces que está el volumen por encima de la línea de la SMA.
El apalancamiento máximo es de 8.
8. Bollinger Bands
Este indicador fue creado por John Bollinger y consiste en tres bandas que se dibujan superpuestas al gráfico de evolución del precio.
La banda central es una media móvil, normalmente se emplea una media móvil simple calculada con 20 períodos. ('BB LENGTH' Número de periodos de la media móvil)
La banda superior se calcula sumando al valor de la media móvil simple X veces la desviación típica de la media móvil. ('BB MULTIPLIER' Número de veces la desviación típica de la media móvil)
La banda inferior de calcula restando a la media móvil simple X veces la desviación típica de la media móvil.
la franja comprendida entre las bandas superior e inferior contiene, estadísticamente, casi un 90% de las posibles variaciones del precio, lo que significa que cualquier movimiento del precio fuera de las bandas tiene especial relevancia.
En términos prácticos, las bandas de Bollinguer se comporta como si de una banda elástica se tratara de manera que, si el precio las toca, éste tiene mucha probabilidad de rebotar.
En ocasiones, después de rellenarse la orden de entrada, el precio se devuelve hacia el lado contrario. Si toca la banda de Bollinger se rellena otra orden en la misma dirección de la posición para mejorar el precio medio de entrada, (% MINIMUM BETTER PRICE': Precio mínimo para que se ejecute la re-entrada y que sea mejor que el precio de la posición anterior en un % dado) de esta manera damos una oportunidad al trade de que el Take Profit se ejecute antes. La desventaja es que se dobla el tamaño de la posición. 'ACTIVATE DIVIDE TP': Divide el tamaño del TP a la mitad. Más probabilidad de que se cierre el trade pero menos ganancias.
█ STOP LOSS y RISK MANAGEMENT.
Una buena gestión de las pérdidas o gestión del riesgo es lo que puede hacer que tu cuenta suba o se liquide en poco tiempo.
El % de riesgo es el porcentaje de nuestro capital que estamos dispuestos a perder por operación. Este se aconseja que debe estar comprendido entre un 1-5%.
% Risk = (% Stop Loss x % Equity per trade x Leverage) / 100
Primero se calcula la estrategia con Stop Loss, después se determina el riesgo por operación y a partir de ahí se calcula el monto por operación y no al revés.
En este script puedes usar un Stop Loss normal o uno según el ATR. También activar la opción de que salte antes si se alcanza el porcentaje de riesgo. '% RISK ALLOWED' que se calcula según el porcentaje de tu capital para 1X '% EQUITY ON EACH ENTRY'.
'STOP LOSS CONFIRMED': Solamente se activa el Stop Loss si el cierre de la barra anterior se encuentra en la condición de límite de pérdidas. Es útil para evitar que se dispare el SL cuando hacen un ‘pump’ para barrer Stops y luego se devuelve el precio a la normalidad.
█ ALERTAS
Hay una alerta por cada apalancamiento por consiguiente como máximo se pueden poner 8 alertas para 'long' y 8 para 'short', más una alerta para cerrar el trade con Take Profit o Stop Loss en modo market. Tambien puedes colocar las ordenes Take Profit limit y Stop Loss limit unos segundos despues de rellenar la orden de entrada de la posición.
- 'MAXIMUM LEVERAGE': Es el máximo multiplicador permitido de la cantidad introducida para 1X según la condición de volumen.
- 'ADVANCE ALERTS': Siempre existe un retardo de tiempo desde que se activa la alerta hasta que llega al exchange y que puede ser de entre 1-15 segundos. Con este párametro se puede adelantar la alerta los segundos necesarios para que se active antes. De este modo se puede sincronizar con el exchange para que el tiempo de ejecución de la orden de entrada a la posición coincida con la de apertura de la barra.
Los settings son para Bitcoin en Binance Futures (BTC:USDTPERP) en 30 minutos.
Para otro pares y otras temporalidades se tienen que ajustar las opciones de nuevo. Además para dentro de un mes, los ajustes serán otros distintos ya que el mercado y la tendencia es cambiante.

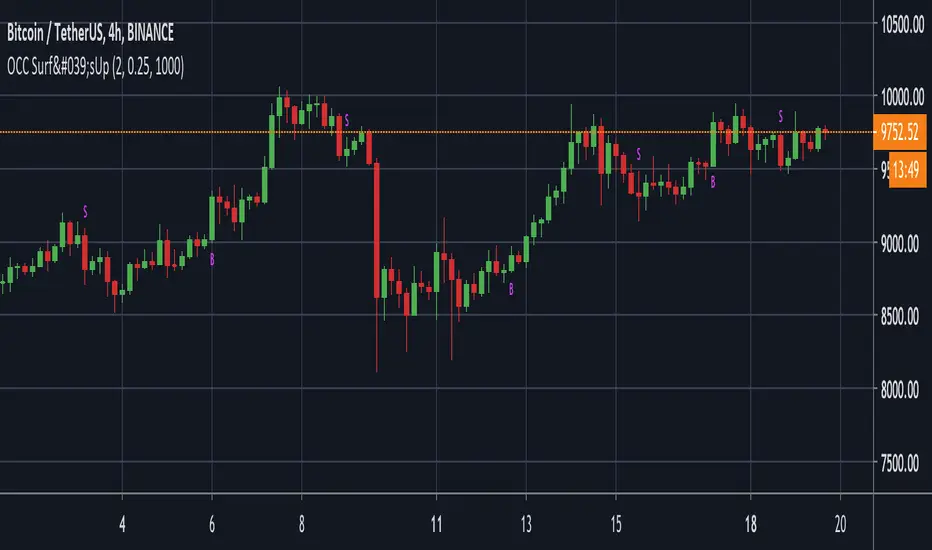
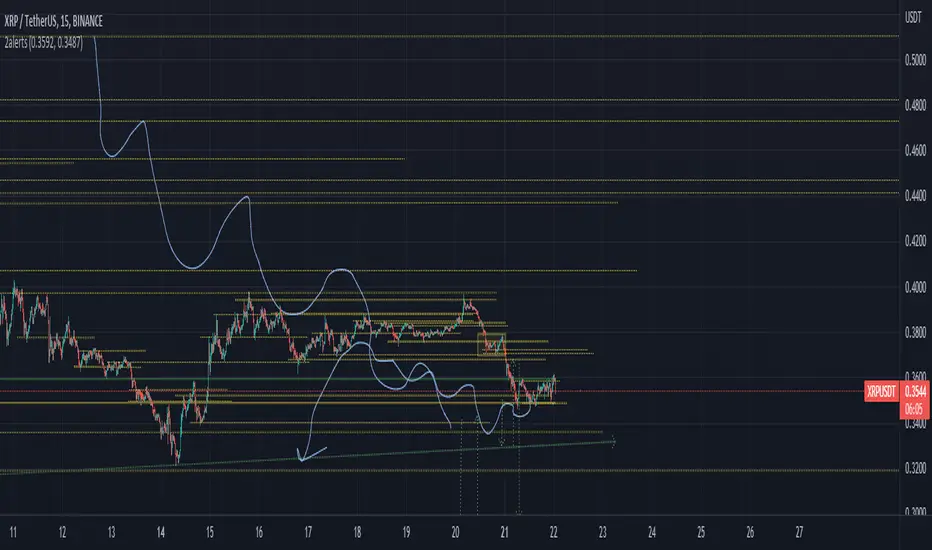
Surf's Up Alerts 1.0Optimal Markets - USDT/ BTC -USD/ BTC all major exchanges
Optimal Chart - 4H
Average trades - 1-2/week
YTD Profit (0 leverage) = 62%
This script was designed to give new traders confidence and some guidance when entering into the crypto trading industry.
When added to the USD/ BTC 4H (optimal) charts of any high volume exchange, three new alert conditions will appear under the Surf's Up indicator alerts. Turn on the "Buy Signal" and "Sell Signal" to be alerted of potential large price increases. This script analyzes multiple data pieces to determine points in which the price has the highest probability of moving up, along with a sell alert that will alert the user of either: the point at which the trend is dying and to take profit OR that the trend is not happening, and to cut your losses. "Secure Profit" can be set to alert you of given profit target, at which time you can set a stop loss just above break even, essentially making a risk-free trade! This is OPTIONAL as it could cause you to a leave a large winning trade too early as well :)
Buy and Sell conditions have been programmed to know when the user is already in a trade, so multiple alerts will not fire, allowing full integration of auto trading as well.
Surf's Up is a back-tested strategy turned study in order to give high potential trade alerts. This way, anyone can easily add the script to the BTC/USD 4H chart, and simply turn on/off any of the 3 alerts: Buy, Sell, or Secure Profit.
You can get more information along with access to this script/alert system by clicking the link in the signature, or sending us a PM here on Tradingview.
Happy Trading!
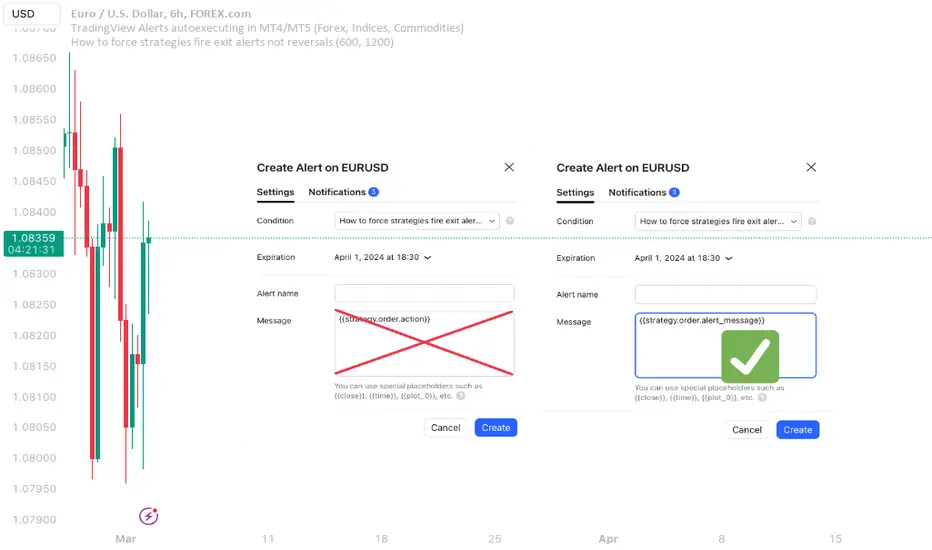
How to force strategies fire exit alerts not reversalsPineScript has gone a long way, from very simple and little-capable scripting language to a robust coding platform with reliable execution endpoints. However, this one small intuitivity glitch is still there and is likely to stay, because it is traditionally justified and quite intuitive for significant group of traders. I'm sharing this workaround in response to frequent inquiries about it.
What's the glitch? When setting alerts on strategies to be synchronized with TradingView's Strategy Tester events, using simple alert messages such as "buy" or "sell" based on entry direction seems straightforward by inserting {{strategy.order.action}} into the Create Alert's "Message" field. Because "buy" or "sell" are exactly the strings produced by {{strategy.order.action}} placeholder. However, complications arise when attempting to EXIT positions without reversing, whether triggered by price levels like Stop Loss or Take Profit, or logical conditions to close trades. Those bricks fall apart, because on such events {{strategy.order.action}} sends the same "sell" for exiting buy positions and "buy" for exiting sell positions, instead of something more differentiating like "closebuy" or "closesell". As a result reversal trades are opened, instead of simply closing the open ones.
This convention harkens back to traditional stock market practices, where traders either bought shares to enter positions or sold them to exit. However, modern trading encompasses diverse instruments like CFDs, indices, and Forex, alongside advanced features such as Stop Loss, reshaping the landscape. Despite these advancements, the traditional nomenclature persists.
And is poised to stay on TradingView as well, so we need a workaround to get a simple strategy going. Luckily it is here and is called alert_message . It is a parameter, which needs to be added into each strategy.entry() / strategy.exit() / strategy.close() function call - each call, which causes Strategy Tester to produce entry or exit orders. As in this example script:
line 12: strategy.entry(... alert_message ="buy")
line 14: strategy.entry(... alert_message ="sell")
line 19: strategy.exit(... alert_message ="closebuy")
line 20: strategy.exit(... alert_message ="closesell")
line 24: strategy.close(... alert_message ="closebuy")
line 26: strategy.close(... alert_message ="closesell")
These alert messages are compatible with the Alerts Syntax of TradingConnector - a tool facilitating auto-execution of TradingView alerts in MetaTrader 4 or 5. Yes, simple alert messages like "buy" / "sell" / "closebuy" / "closesell" suffice to carry the execution of simple strategy, without complex JSON files with multiple ids and such. Other parameters can be added (actually plenty), but they are only option and that's not a part of this story :)
Last thing left to do is to replace "Message" in Create Alert popup with {{strategy.order.alert_message}} . This placeholder transmits the string defined in the PineScript alert_message= parameter, as outlined in this publication. With this workaround, executing closing alerts becomes seamless within PineScript strategies on TradingView.
Disclaimer: this content is purely educational, especially please don't pay attention to backtest results on any timeframe/ticker.
Stochastic Arrows Crossover with Alerts [TED]This indicator highlights key Stochastic %K and %D crossovers, helping traders identify potential buy and sell signals with visual triangle arrows and custom alerts. It uses the Stochastic Oscillator, which is a momentum indicator that compares the closing price to the price range over a given period.
Key Features:
Visual Arrows: The indicator plots green triangle-up arrows for bullish crossovers and red triangle-down arrows for bearish crossovers on the chart.
Customizable Parameters: You can adjust the period for %K, %D, and the smoothing factor to fit your trading strategy.
Overbought/Oversold Zones: The background color fills between the 80 (Overbought) and 20 (Oversold) levels, helping you visualize potential reversal areas.
Alerts: Set up dynamic alerts based on the crossover events, including:
Bullish and Bearish Crossovers
Crossover Events from the Previous Bar
How to Use:
Bullish Signal: When the %K line crosses above the %D line, it signals a potential buying opportunity. This is visually represented with a green triangle-up arrow on the chart.
Bearish Signal: When the %K line crosses below the %D line, it signals a potential selling opportunity, indicated by a red triangle-down arrow on the chart.
Overbought/Oversold Zones: The background color fill helps identify overbought or oversold market conditions, which may indicate a potential reversal.
Custom Alerts:
You can set alerts for:
Bullish Crossover: When the %K line crosses above the %D line.
Bearish Crossover: When the %K line crosses below the %D line.
Previous Bar Crossovers: Alerts for crossovers from one bar ago (helpful for backtesting).
Instructions:
Add the Indicator: Apply this Stochastic Arrows Crossover indicator to your chart from the public library.
Customize Settings: Adjust the input parameters like K period, D period, and Smoothing to match your preferred settings.
Enable Alerts:
Once added to your chart, you can set up alerts from the Alert Panel on TradingView.
Choose from the available alert conditions (Bullish Crossover, Bearish Crossover, or Crossover from the Previous Bar).
Set your desired timeframe and alert message to receive notifications for the crossovers.
Monitor the Chart: Keep an eye on the arrows and background color fill to interpret potential trade setups based on the Stochastic Oscillator's behavior.
[VTaL] Vertical Time Alert Lines - By BlueJayBird🦾 USE
- Vertical lines drawn ON TOP of chart at selected key times of the day, week, month, year.
- You can use it at any symbol (as far as I know).
- Programmatic alerts available.
- Lines from lower time-frames are selectively NOT visible at higher time-frames. Example: At 1h time-frame, vertical lines from 1h and 4h intervals are not visible. Drawing them is considered not really useful.
🎭 MAIN FEATURES
- Available targeted times: 3m, 15m, 1h, 4h, 1D, 1W, 1M, 1Y.
- Offset available for all lines. Example: 1 offset for 4h moves lines from 4AM to 8AM.
- Programmatic alerts for all lines. Example: If alert is enabled for 15m lines, every time those lines are reached, alert will trigger.
- Available drawing themes: Custom, Light, Dark.
💻 NOTES ON CODE
- Vertical lines are drawn using a custom function, which uses line.new() built-in function.
- Alerts are triggered using ta.cross() built-in function. Alert is triggered when close price crosses a given time value from the line.get_x1() built-in function.
- I've added, where necessary, several comments to the code for understanding what's going on. If you have additional questions, you may ask them in the comment section of the publication.
- 3m lines are not really useful in day-trading, they were added for debugging purposes mainly. Useful for learning how to use alerts, though.
👉🏼 NOTES ON ALERTS
- When setting up an alert, the targeted line must be enabled/visible.
- Every time any alert is enabled or disabled, you must create AGAIN the alert from the "Alerts" panel (remember, alerts run in the back-end).
- Alerts contain really useful information. If you have any idea for adding some other data, tell in the comment section. 💡
⚠️ KNOWN ISSUES
- None. Let me know please if you find any.
--------------------------------------------
~ Comment , Follow and Boost ~ 🚀

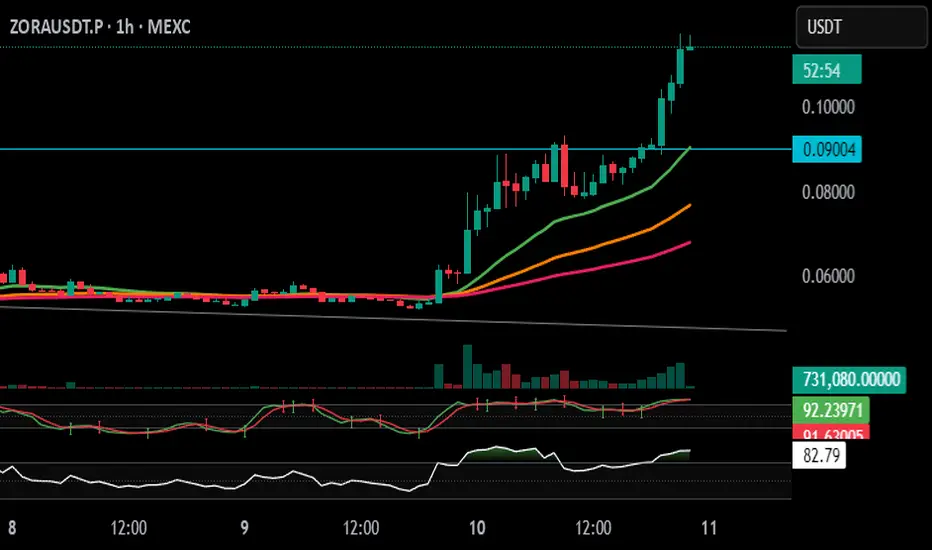
Quantum Vector AlertsIts the part 2 of Multiple Indicators 50EMA Cross Alerts.
Its more suitable for the seconds chart. Beside, you can use it in higher timeframe.
The input bars length is the sample size that the code will use to trigger all alert. 20 mean 20 bar after the current candle.
When you activate volume alert you can select an amount of volume that when volume cross it you will be notified. The volume of every bar is displayed in the screener below volume.
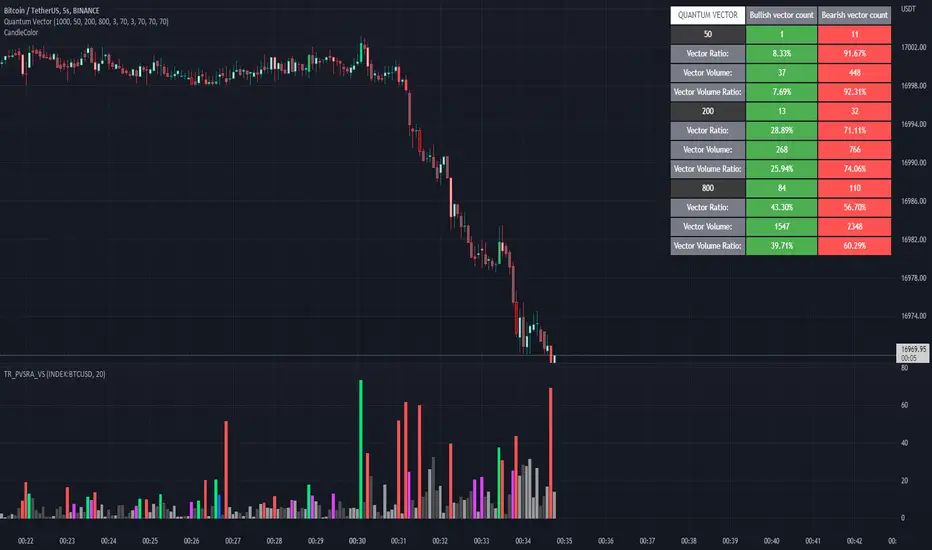
In the section percentage vector counting the script do the sum of the red vector and green vector and give a ratio. In bullish vector count percentage for alert, you can select the percentage difference that you want to receive an alert. If your sample have 3 red vectors and 7 green vectors you will receive an alert saying that there is an imbalance of 70% showing more green vectors.
You can select a variant of percentage vector. The variant will do a summation of volume. If 1 vector candle is the size of the 3 other vector, they will have the same ponderation.
Normal alert counting count the number of vectors in the bars length. You can count the red and green candle only or add the blue and violet.
Bullish vector count will show a notification when the number of green candle will appear on the chart in the selected length. The same process is valid for bearish vector count. For example, if you want 3 bullish candle in 20 bar. You select bars length 20 and bullish vector count 3.
These alerts are suitable to the hybrid system. Thanks to our teacher Trader Reality and to all the member that contribute to this great discord community.
5 MAs w. alerts [LucF]Is this gazillionth MA indicator worth an addition to the already crowded field of contenders? I say yes! This one shows up to 5 MAs and 6 different marker conditions that can be used to create alerts, among many other goodies.
Features
MAs can be darkened when they are falling.
MAs from another time frame can be displayed, with the option of smoothing them.
Markers can be filtered to Longs or Shorts only.
EMAs can be selected for either all or the two shortest MAs.
The background can be colored using any of the marker states except no. 3.
Markers are:
1. On crosses between any two user-defined MAs,
2. When price is above or below an MA,
3. On Quick Flips (a specific setup involving a cross, multiple MA states and increasing volume, when available),
4. When the difference between two MAs is within a % of its high/low historic values,
5. When an MA has been rising/falling for n bars,
6. When the difference between two MAs is greater than a multiple of ATR.
Some markers use similar visual cues, so distinguishing them will be a challenge if they are used concurrently.
Alerts
Alerts can be created on any combination of alerts. Only non-consecutive instances of markers 5 and 6 will trigger the alert condition. Make sure you are on the interval you want the alert to run at. Using the “Once Per Bar Close” trigger condition is usually the best option.
When an alert is created in TradingView, a snapshot of the indicator’s settings is saved with the alert, which then takes on a life of its own. That is why even though there is only one alert to choose from when you bring up the alert creation dialog box and choose “5 MAs”, that alert can be triggered from any number of conditions. You select those conditions by activating the markers you want the alert to trigger on before creating the alert. If you have selected multiple conditions, then it can be a good idea to record a reminder in the alert’s message field. When the alert triggers, you will need the indicator on the chart to figure out which one of your conditions triggered the alert, as there is currently no way to dynamically change the alert’s message field from within the script.
Background settings will not trigger alerts; only marker configurations.
Notes
MAs are just… averages. Trader lure would have them act as support and resistance levels. I’m not sure about that, and not the only one thinking along these lines. Adam Grimes has studied moving averages in quite a bit of detail. His numbers point to no evidence indicating they act as support/resistance, and to specific MA lengths not being more meaningful than others. His point of view is debated by some—not by me. Mean reversion does not entail that price stops when it reaches its MA; rather, it makes sense to me that price would often more or less oscillate around its MA, which entails the MA does not act as support/resistance. Aren’t the best mean reversion opportunities when price is furthest away from its MA? If so, it should be more profitable to identify these areas, which some of this indicator’s markers try to do.
I think MAs can be much more powerful when thought of as instruments we can use to situate price events in contexts of various resolutions, from the instantaneous to the big picture. Accordingly, I use the relative positions and slopes of MAs in both discretionary and automated trading; but never their purported ability to support/resist.
Regardless of how you use MAs, I hope you will find this indicator useful.
Biased References
The Art and Science of Technical Analysis: Market Structure, Price Action, and Trading Strategies, Adam Grimes, 2012.
Does the 200 day moving average “work”?
Moving averages: digging deeper

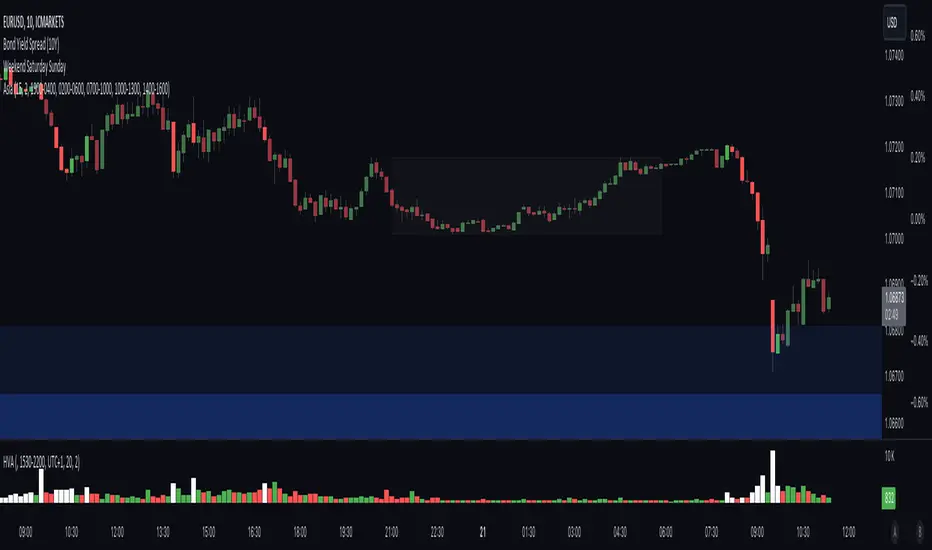
High Volume AlertThe High Volume Alert Script is developed for all traders focusing on volume analysis in their trading strategies, providing alerts for unusually high trading volumes during specified trading sessions.
Functionality:
Volume Moving Average Calculation:
Average Volume = Moving Average(Volume) = Sum of last the x last candles Volume
Where n is the user-defined period for the moving average calculation (denoted as movingaverageinput in the script. This moving average serves as the baseline to compare current volume levels against historical averages.
High Volume Detection:
HighVolume = CurrentVolume >= (MA(Volume) x HighVolumeRatio)
Here, HighVolumeRatio is a user-defined multiplier that sets the threshold for what is considered high volume. If the current volume exceeds this threshold (the product of the moving average of volume and the HighVolumeRatio ), the script identifies this as a high-volume event.
Session Filtering:
The script further refines these alerts by ensuring they only trigger during the specified trading session, enhancing relevance for traders interested in specific market hours. This session is defined by the sess and timezone parameters.
Visualisation and Alerts:
If high volume is detected (HighVolume = True), the script colors the volume bar with the highVolumeColor . If the option is selected, it also changes the color of the candlestick to either highVolumeCandleColorUp (for bullish candles) or highVolumeCandleColorDown (for bearish candles), depending on the price movement within the high-volume period. An alert is generated through the alertcondition function when high volume is detected during the specified session, notifying the trader of potentially significant market activity.
Application in Trading:
This indicator serves traders who prioritize volume as a leading indicator of potential price movement. High trading volumes may indicate the presence of significant market activity, often associated with events like news releases, market openings, or large trades, which can precede price movements.
Originality and Practicality:
This script is self-developed, aiming to fill the gap in automatic ratio adjusted volume alerts within the TradingView environment.
Conclusion:
The High Volume Alert Script is an essential tool for traders who integrate volume analysis into their strategy, offering tailored alerts and visual cues for high volume periods.
Compliance and Limitations:
The script complies with TradingView scripting standards, ensuring no lookahead bias and maintaining real-time data integrity. However, its utility depends on the availability on volume data, and please be aware that forex pairs never offer real volume data, this tool is best used with a exchange traded symbol.
Manual Buy&Sell Alerts [Starbots]This is a simple Strategy created to help you manually execute open or close orders via Alerts on Exchanges or Platforms.
More and more Exchanges and Platforms allow Tradingview Alert trading and sometimes we come to a problem that we can not sell an open order on the exchanges other way than signaling a sell or buy from Tradingview Alerts.
This is a tool to solve that problem as your are able to manually:
- send alert on limit targets (Long limit target, Short limit target, Take Profit limit target, Stop Loss limit target)
- send alert when new live bar opens on the market (simple way for closing your open trades on the Exchange/Platform - it will sell your open Long/Short order after new live bar is opened on the market)
Functions:
- 🕛Start
Define a start time for strategy to open/close trades
- 🕐Stop Trading after your Order is Closed
If you wish to stop opening/closing trades after your first position is successfully closed keep this turned on. If you wish to keep opening/closing trades indefinitely when the conditions are met keep this turned off.
🏁Buy&Sell By Limit Target
-Buy Price
-Take Profit
-Stop Loss
-🟢Enable Long Limit Orders
-🔴Enable Short Limit Orders
If you enable Enable Long or Short limit orders you will be able to execute trades when the price reaches your limit target lines.
Please Note that if you turn on Shorting, your Take Profit limit target must be 'UNDER' your buy price and Stop Loss limit target must be 'ABOVE' your buy price.
Type in your limit values manually or re-apply the strategy to your chart to select limit targets again with a mouse - you can also drag the limit lines to your wanted areas.
(I recommend using low time-frame charts - 30s, 1minute for fast executions)
🏁Buy&Sell After New Bar Opens
-🟢Open Long
-Close Long on a new Open Bar
-🔴Open Short
-Close Short on a new Open Bar
This is a simple way for closing your open trade on Exchanges. If you select Open Long/Short and then Close Long/Short on a new Open bar it will sell your open order and send sell alert when the new bar is opened on the market. Choose your time-frame and execute immediate sell order when a new bar is opened. You can select low 15s-30s-1minute charts to quickly get a sell alert.
Alerts
Long Message
Short Message
Exit Long Message
Exit Short Message
You can type in your webhook alert messages in this inputs. Write this code in 'Message' when creating Alert for strategy to send your Buy/Sell messages from above inputs.
{{strategy.order.alert_message}}
If you trade on exchanges and use different dynamic alert message to trade from Strategies, then you can just leave Alert inputs empty and write down your message alert in 'Message' box when creating new alert normally.
>> Do not forget to also set order size and pyramiding in properties tab correctly in this case.

(2) Two AlertsCurrent Trading View free plan allows only ONE active alert.
This simple indicator Allows to trigger this ONE and ONLY alert when price reaches Higher, or Lower price level.
You can set levels and turn alerts for them on/off in settings, or by just drag-n-dropping Horizontal lines on the chart.
To set the only alert you need to create new alert, and change it's following parameters :
condition : 2alerts
Any alert function() call
Feel free to modify it on your needs.
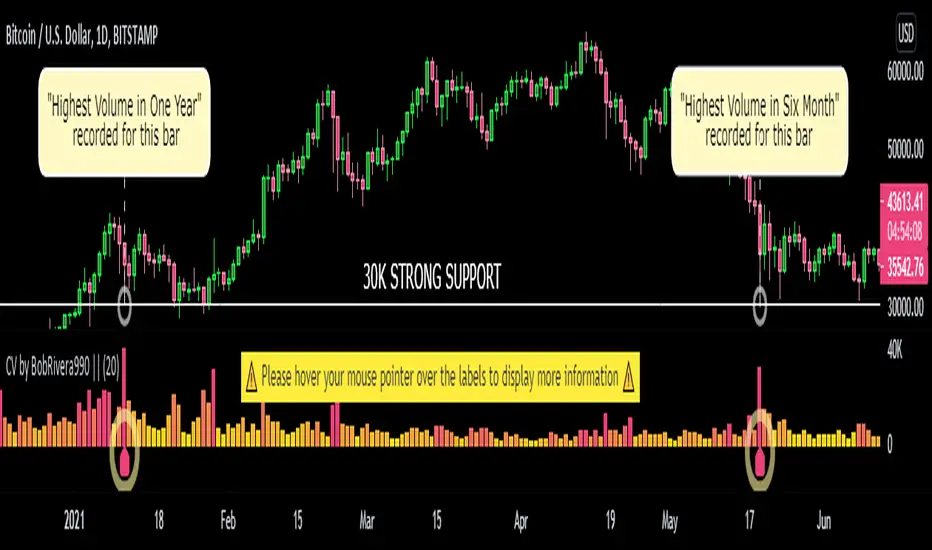
Volume Records + AlertContents
Overall Introduction
Settings menu parameters
Usage
How to use alerts
Limits
Overall Introduction
This indicator is a "volume analysis" tool for confirming the direction and strength of price trend and spotting trend reversals. This tool consists of two parts:
1- The colored graph is a custom volume oscillator which shows the relative changes in volume.
The darkening of the color of the bars is a sign of increasing volume.
2- Triangular labels that show trading volume records over different time periods based on the absolute values of the volume.
By creating an alert, you can be notified of new trading volume records. These records are:
Highest / lowest volume in one year,
Highest / lowest volume in six month
Highest / lowest volume in three month
Highest / lowest volume in one month
Highest / lowest volume in one week
Settings menu parameters
{Short Length} =>
The fast volume MA of the Volume Oscillator.
{Long Length} =>
The slow volume MA of the Volume Oscillator.
{Visual Parameters} =>
Parameters to personalize the appearance of the indicator.
{Alert Conditions Part 01: Highest Records ⏰ } =>
Parameters to customize the alert.
{Alert Conditions Part 02: Lowest Records ⏰ } =>
Parameters to customize the alert.
Usage
This indicator is a "volume analysis" tool for confirming the direction and strength of price trend and spotting trend reversals.
What Is Volume Analysis?
Volume analysis involves examining relative or absolute changes in an asset's trading volume in order to make inferences about future price movements.
A significant price increase along with a significant volume increase, for example, could be a credible sign of a continued bullish trend or a bullish reversal.
The gradual darkening of the bars is a sign of the strength of the trend.
Volume can be an indicator of market strength, as rising markets on increasing volume are typically viewed as strong and healthy.
How to use alerts
Note that by creating an alert, an instance of the indicator, with all your settings, will be activated on the site's server and alerts will be triggered by it.
After that, changing the indicator settings on the chart will no longer affect the alert.
Open the settings window and select the alert conditions as you wish
Click the Create Alert button (or press the A key while holding down the ALT key)
In the Condition section, select the name of the indicator.
Make the rest of the settings as you wish.
Finally, click on the Create button.
It's finished. After a few moments, your alert will be added to the Alerts menu.
Limits
The labels are displayed after the bars close.
Labels are displayed for the last 10,000 bars.

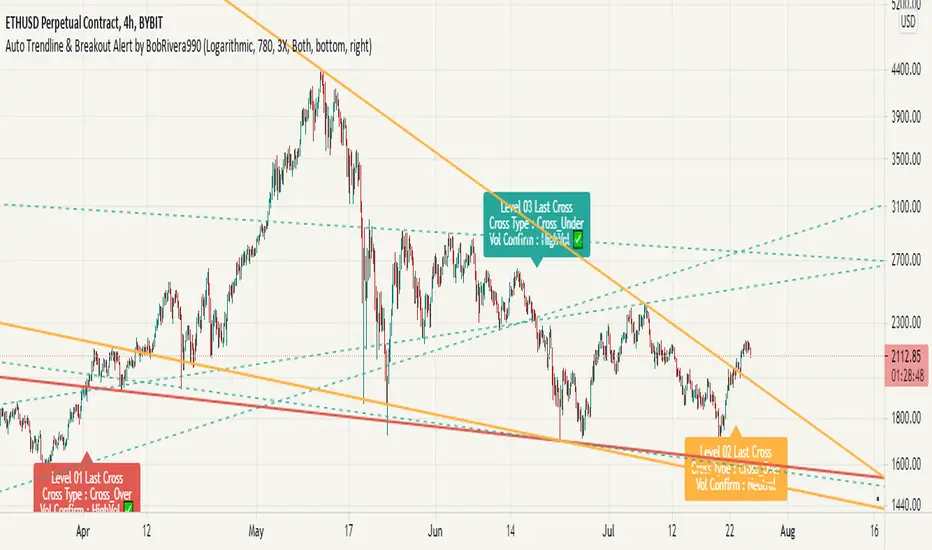
Auto Trendline & Breakout Alert(Linear / Log) Full-VersionContents
Overall Introduction
Does it repaint?
Features
Settings menu parameters
How to setup
Limits
Errors and Performance
Examples
Overall Introduction
This indicator is the best tool for breakout traders.
Drawing and evaluating the trend lines of multiple charts in different time frames is a very time-consuming and tedious task. In addition, being aware of breakouts in the shortest possible time requires constant monitoring.
With this tool, you can draw and classify trend lines in a fraction of a second and by placing an alert on any chart, you can receive notifications about breakouts, wherever you are.
The classification of trend lines is done based on the reaction of the price chart to the trend lines and the analysis of the trading volume.
This indicator is designed to reclassify trend lines with each reaction of the price chart. These lines are classified into 6 levels and these levels are distinguished by different colors. Thus, any touching or crossing of the price chart can make a difference.
Does it repaint?
Any tool that shows trend lines must repaint because trend lines are constantly changing. Some lines lose their strength and new ones are formed, so some lines should be removed and replaced with new lines and that means repainting.
The indicator should reflect the latest changes. So while repainting is a bad thing in a strategy, it is essential in this indicator.
This indicator is designed to reclassify trend lines with each reaction of the price chart. Thus, any touching or crossing of the price chart can make a difference.
Note that unlike alerts, breakout labels are not trading signals:
Breakout labels show the latest breakout for each level based on the lines that appear on the chart, so they may repaint or have delay.
But Alerts work differently, Alerts are triggered when one of the trend lines is broken and then the next candle is opened and has no any delay.
Features
This indicator is designed for use on both linear and logarithmic scales. It works linearly by default. If you are using a logarithmic chart, enter the settings menu and set the chart scale parameter to “Log”.
The indicator is equipped with the volume status tool to identify and avoid false breakouts. Note that you can't completely avoid false breakouts, but you can minimize risk and loss. I have already published volume status as a separate script.
Several filters are provided to customize alerts. You can limit alerts based on the level and strength of broken trend lines, volume status, and type of breakout (Cross-Over, Cross-Under, or both).
The last breakouts panel gives an overview of the current market situation. You can activate it in the settings menu. the figure below shows the panel:
Settings menu parameters
{Chart Scale …} =>
Set it according to the chart. If you are using a linear chart, select the "Linear" option or if you are using a logarithmic chart, select the "Log" option
{Max Operational Range Length ...} =>
This parameter specifies the number of candles processed by the indicator (By default, the last 1000 bars)
{Filter Out-Of-Range Lines} =>
The filter removes diverging or out-of-range lines and reduces the clutter of the chart
{Visible Trend Lines ...} =>
In this section you can specify which level of trend lines should be visible. Level 1 contains the strongest lines and level 6 contains the weakest.
{Alert Condition 01 _ Trendline Levels} =>
In this section, you can specify which level of trend lines will trigger an alert after the breakout. This section has been added to customize alerts.
{Alert Condition 02 _ Cross Type} =>
In this section, you can limit alerts based on the type of breakout (Cross-Over, Cross-Under or both). This section has been added to customize alerts.
{Alert Condition 03 _ Volume Status} =>
In this section, you can limit alerts by volume to avoid fake breakouts. This section has been added to customize alerts.
{Last Breakout Label} =>
In this section, you can enable or disable the last breakout labels.
{Panel} =>
In this section, you can enable or disable the last breakout panel or set its position on the chart.
How to setup
There are many parameters in the settings menu, but two are more important. One is “Chart Scale” and the other is the “Max Operational Range Length".
Set the “chart scale” parameter according to the chart, otherwise the trend lines drawn by the indicator do not match the price chart.
If you are using a linear chart, select the "Linear" option or if you are using a logarithmic chart, select the "Log" option.
Max Operational Range Length Limits the range of the price chart that is processed by the indicator.
By increasing this parameter:
The strength and durability of the trend lines increases.
The number of breakout signals decreases.
The importance of breakout signals increases.
The indicator processing load increases.
In the following figure, you can see the effects of increasing the “Max Operational Range Length" parameter:
Limits
Since this indicator makes extensive use of trading volume, it is necessary to use a chart with volume information.
But if the volume information is not provided by the vendor, indicator will continue to work based on the price chart only, and a warning message will be displayed below the chart to let you know.
Errors and Performance
The performance of this indicator depends on the “Max Operational Range Length” parameter in the settings menu because it performs calculations, within a range with the length of this parameter.
By increasing this parameter, the processing load increases. Sometimes you may encounter the following error: “Loop takes too long to execute (>200 ms)”
If you see this error, do one of the following:
Reduce the “Max Operational Range Length”.
Reset the indicator. To do this, double-click on the “Hide” button in front of the indicator name.
Examples
EURUSD (FX:EURUSD) – 1D // Scale: Logarithmic, Max Range Length = 1000, Filter: 2X
NASDAQ 100 (CME_MINI:NQ1!) - 1D // Scale: Logarithmic, Max Range Length = 700
GOLD (COMEX:GC1!) – 1D // Scale: Logarithmic, Max Range Length = 650, Filter: 2X
NATURAL GAS (NYMEX:NG1!) – 1D // Scale: Logarithmic, Max Range Length = 625, Filter: 4X
AMAZON (NASDAQ:AMZN) – 1D // Scale: Logarithmic, Max Range Length = 1750, Filter: 2X
APPLE INC (NASDAQ:AAPL) – 1D // Scale: Logarithmic, Max Range Length = 340, Filter: 4X
GBPUSD (FX:GBPUSD) – 1D // Scale: Logarithmic, Max Range Length = 1000, Filter: 3X
SILVER (COMEX:SI1!) – 1D // Scale: Logarithmic, Max Range Length = 550, Filter: 3X
BITCOIN (KUCOIN:BTCUSDT) – 4H // Scale: Logarithmic, Max Range Length = 1250, Filter: 3X
MICROSOFT (NASDAQ:MSFT) – 1D // Scale: Logarithmic, Max Range Length = 340, Filter: 4X
TOTAL (CRYPTOCAP:TOTAL) – 2H // Scale: Logarithmic, Max Range Length = 1075, Filter: 3X
Scrybblez Alerts## Scrybblez Alerts ##
Request access for a trial here or by twitter to @scrybblez
0.What is this Indicator for?
This indicator contains the same code present in Scrybblez Strategy but instead of being a strategy, it is a study. Why is that? Tradingview works in a way that allows Strategies to signal entries and backtest results but does not allow them to send alerts. Studies on the other hand can prompt alerts.
Being able to backtest how well does your Indicator work is very important, but it's useless to have the perfect algorithm and then not being able to act on those signals in time, which is why I wrote this Study.
1.Alerts
Alerts can be set in a few different ways, first let's go through how you can receive them.
- Showing a popup
- Playing a sound
- Sending an email
- Sending an SMS
The first two are useful for when you're in front of the computer or around the house (to avoid being glued to the screen) and the second two for when you're away and want to know of an important event that just occurred.
Since they are quite limited people have come up with ways of making use of these alerts in ingenious ways, one of them for example is to make use of Browser extensions (Autoview, ProfitView,...) to make trades automatically and avoid missing those juicy entries that your indicator just found for you.
2.How to set the alerts?
This study has 9 alerts inside.
_ALERT TEST
The first alert is one I configured so that I can use it to debug if my alerts are prompting, there is nothing more painful than thinking you configured all your alerts correctly, then waiting for an alert to trigger only to see thatthe alert did not work because you misconfigured something or worse, that you prompted that alert once per minute... and you exited several times your current position.
To avoid this, we have this alert, it will ALWAYS trigger, use it to test if your alerts work but DO NOT USE it for anything else.
The remaining 8 alerts' "Message" comes pre-configured (in pairs) with bitmex and bitmex-testnet for ease of use with sample settings for using them with AutoView and Bitmex:
Description of sample settings provided for Autoview
Platform: Bitmex
Bitmex-Testnet Account: bitmex
Bitmex Account: bmex
Leverage: x1
Quantity: 99% of your portfolio
Actual Alerts to be configured
1) LONG
Condition: Scrybblez Alerts and * Open Long * is meant to be linked with both
Alert Condition: LONG and/or TESTNET LONG
2) CLOSE LONG
Condition: Scrybblez Alerts and * Close Long * is meant to be linked with both
Alert Condition: CLOSE LONG and/or TESTNET CLOSE LONG
3) SHORT
Condition: Scrybblez Alerts and * Open Short * is meant to be linked with both
Alert Condition: SHORT and/or TESTNET SHORT
4) CLOSE SHORT
Condition: Scrybblez Alerts and * Close Short * is meant to be linked with both
Alert Condition: CLOSE SHORT and/or TESTNET CLOSE SHORT
After linking the "Condition" with its corresponding "Alert Condition" I advise you to use the option "Once per close bar".
Finally I personally always tick for "Alert actions" both Play sound and Send Email .
If you are happy with using the sample settings provided above, please be aware that Bitmex is a trading platform where you risk being LIQUIDATED and you could potentially lose your entire portfolio. If you are still Ok with it, proceed at your own risk, I myself use either leverage x3 or x4 any higher than that and you're asking to be liquidated with an unexpected 20% spike (and these spikes have happened a few times before) or some heavy manipulation, I advise caution until you know what you are doing.
Also, please note that although I personally use this indicator to trade, the alerts that it provides are by no means to be taken as financial advice from me and you follow them at your own risk, we are all grownups here.
*** Reminder ***
Scrybblez Alerts works with the same code as Scrybblez Strategy , all stated there applies here as well.
How does this strategy work?
This strategy works particularly well with Bitcoin and can be applied to volatile coins with big swings with smaller movements.
It comes preconfigured with settings for 202 minutes.

Outside the Bollinger Bands Alerting Indicator Overview
The Outside the Bollinger Bands Alerting Indicator is a comprehensive technical analysis tool that combines multiple proven
indicators into a single, powerful system designed to identify high-probability reversal patterns at Bollinger Band extremes. This
indicator goes beyond simple band touches to detect sophisticated pattern formations that often signal strong directional moves.
Key Features & Capabilities
🎯 Advanced Pattern Recognition
Bollinger Band Breakout Patterns
- Detects "pierce-and-reject" formations where price breaks through a Bollinger Band but immediately reverses back inside
- Identifies failed breakouts that often lead to strong moves in the opposite direction
- Combines multiple confirmation signals: engulfing candle patterns, MACD momentum, and ATR volatility filters
- Visual alerts with symbols positioned below (bullish) or above (bearish) candles
Tweezer Top & Bottom Patterns
- Identifies consecutive candles with nearly identical highs (tweezer tops) or lows (tweezer bottoms)
- Requires at least one candle to breach the respective Bollinger Band
- Confirms reversal with directional close requirements
- Customizable tolerance settings for pattern sensitivity
- Visual alerts with ❙❙ symbols for easy identification
📊 Multi-Indicator Integration
Bollinger Bands Indicator
- Dual-band configuration with outer (2.0 std dev) and inner (1.5 std dev) bands that can be adjusted to suit your own parameters
- Configurable MA types: SMA, EMA, SMMA (RMA), WMA, VWMA
- Customizable length, source, and offset parameters
- Color-coded band fills for visual clarity
Moving Average Suite
- EMA 9, 21, 50, and 200 (individually toggleable)
- Special "SMA 3 High" for help visualizing and detecting Bollinger Band break-outs
- Dynamic color coding based on price relationship
Optional Ichimoku Cloud overlay
- Complete Ichimoku implementation with customizable periods
- Dynamic cloud coloring based on trend direction
- Toggleable overlay that doesn't interfere with other indicators
🚨 Comprehensive Alert System
Real-Time JSON Alerts
- Sends structured data on every confirmed bar close
- Includes all indicator values: BB levels, EMAs, MACD, RSI
- Contains signal states and crossover conditions
- Perfect for automated trading systems and webhooks
{"timestamp":1753118700000,"symbol":"ETHUSD","timeframe":"5","price":3773.3,"bollinger_bands":{"upper":3826.95,"basis":3788.32,"lower":3749.68},"emas":{"ema_9":3780.45,"ema_21":3788.92,"ema_50":3800.79,"ema_200":3787.74,"sma_3_high":3789.45},"macd":{"macd":-10.1932,"signal":-11.3266,"histogram":1.1334},"rsi":{"rsi":40.5,"rsi_ma":39.32,"level":"neutral"}}
Specific Alert Conditions
- MACD histogram state changes (rising to falling, falling to rising)
- RSI overbought/oversold crossovers
- All pattern detections (BB Bounce, Tweezer patterns)
- Bollinger Band breakout alerts
🎨 Visual Elements
Pattern Identification
- ♻ symbols for Bollinger Band breakout patterns (green for bullish, red for bearish)
- ❙❙ symbols for tweezer patterns (green below for bottoms, red above for tops)
- Color-coded band fills for trend visualization
Chart Overlay Options
- All moving averages with distinct colors
- Bollinger Bands with inner and outer boundaries
- Optional Ichimoku cloud with trend-based coloring
Trading Applications
Reversal Trading
- Identify high-probability reversal points at extreme price levels
- Use failed breakout patterns for entry signals
- Combine multiple timeframes for enhanced accuracy
Trend Analysis
- Monitor moving average relationships for trend direction
- Use Ichimoku cloud for trend strength assessment
- Track momentum with MACD and RSI integration
Risk Management
- ATR-based volatility filtering reduces false signals
- Multiple confirmation requirements improve signal quality
- Real-time alerts enable prompt decision making
Suggested Use
- Use on multiple timeframes for confluence
- Combine with support/resistance levels for enhanced accuracy
- Set up alerts for hands-free monitoring
- Customize settings based on market volatility and trading style
- Consider volume confirmation for stronger signals

Mongoose multi time frame RSI quick glance w/alertsThis Pine Script helps you identify overbought and oversold conditions for any stock, index, or cryptocurrency you're monitoring, across three different time frames (daily, weekly, and monthly). It uses the Relative Strength Index (RSI) as the indicator for these conditions. Here’s a breakdown of what the script does and what it tells you:
Key Features:
RSI Indicator:
The script calculates the RSI for three different timeframes: daily, weekly, and monthly.
RSI is a momentum oscillator that measures the speed and change of price movements, typically on a scale from 0 to 100:
Overbought: RSI > 70 (This could indicate the asset is overvalued and may see a price correction).
Oversold: RSI < 30 (This could indicate the asset is undervalued and may see a price rebound).
Color-Coded Background:
The script visually highlights overbought and oversold conditions by coloring the chart background:
Blue for Daily overbought/oversold.
Green for Weekly overbought/oversold.
Red for Monthly overbought/oversold.
Overbought areas will have the colored background whenever the RSI is above 70.
Oversold areas will have the colored background when the RSI drops below 30.
Multiple Timeframes:
The script checks these overbought and oversold levels on three timeframes (daily, weekly, and monthly) simultaneously, giving you a broad view of the market’s momentum.
This helps you determine whether a price movement is part of a short-term fluctuation (daily), a mid-term trend (weekly), or a long-term cycle (monthly).
Alerts:
If the RSI crosses the overbought or oversold threshold for any of these timeframes, the script will trigger an alert.
The alert message includes the name of the stock or cryptocurrency and the timeframe in which the condition occurred (e.g., "Daily Overbought").
How to Use This Information:
Trading Decisions: You can use this script to help decide when to enter or exit trades based on whether an asset is overbought or oversold in different timeframes.
Buy Signal: When RSI is oversold (below 30) and you expect a price rebound.
Sell Signal: When RSI is overbought (above 70) and you expect a price correction.
Long-Term vs Short-Term: By analyzing the three timeframes, you can tailor your strategy to short-term trades (daily RSI) or longer-term investments (weekly or monthly RSI).
In essence, this script gives you a multi-timeframe RSI-based view of potential reversal points in the market, visually coded for clarity, and alerts you when those levels are hit across different timeframes.
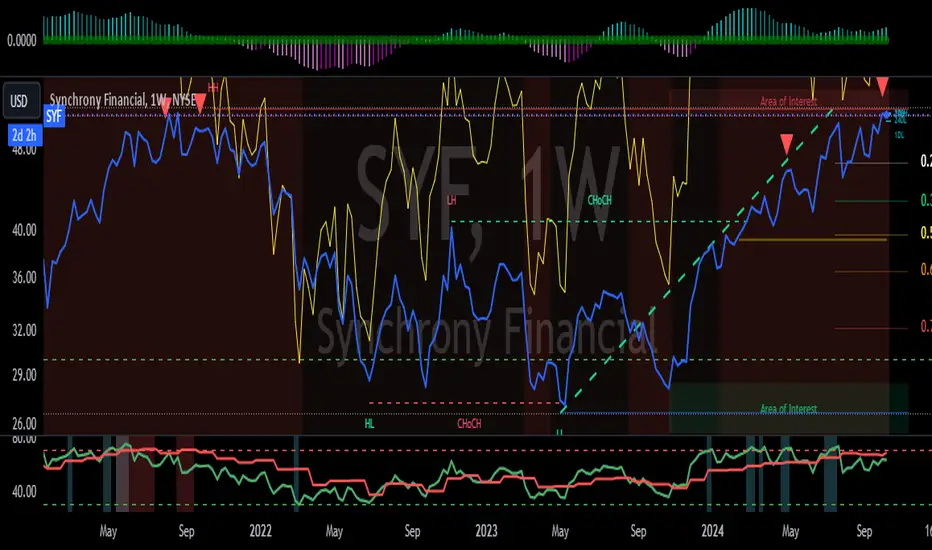
TradingView Alerts (Expo)█ Overview
The TradingView inbuilt alert feature inspires this alert tool.
TradingView Alerts (Expo) enables traders to set alerts on any indicator on TradingView, both public, protected, and invite-only scripts (if you are granted access). In this way, traders can set the alerts they want for any indicator they have access to. This feature is highly needed since many indicators on TradingView do not have the particular alert the trader looks for, this alert tool solves that problem and lets everyone create the alert they need. Many predefined conditions are included, such as "crossings," "turning up/down," "entering a channel," and much more.
█ TradingView alerts
TradingView alerts are a popular and convenient way of getting an immediate notification when the asset meets your set alert criteria. It helps traders to stay updated on the assets and timeframe they follow.
█ Alert table
Keep track of the average amount of alerts that have been triggered per day, per month, and per week. It helps traders to understand how frequently they can expect an alert to trigger.
█ Predefined alerts types
Crossing
The Crossing alert is triggered when the source input crosses (up or down) from the selected price or value.
Crossing Down / Crossing Up
The Crossing Down alert is triggered when the source input crosses down from the selected price or value.
The Crossing Up alert is triggered when the source input crosses up from the selected price or value.
Greater Than / Less Than
The Greater Than alert is triggered when the source input reaches the selected value or price.
The Less Than alert is triggered when the source input reaches the selected value or price.
Entering Channel / Exiting Channel
The Entering Channel alert is triggered when the source input enters the selected channel value.
The Exiting Channel alert is triggered when the source input exits the selected channel value.
Notice that this alert only works if you have selected "Channels."
Inside Channel / Outside Channel
The Inside Channel alert is triggered when the source input is within the selected Upper and Lower Channel boundaries.
The Outside Channel alert is triggered when the source input is outside the selected Upper and Lower Channel boundaries.
Notice that this alert only works if you have selected "Channels."
Moving Up / Moving Down
This alert is the same as "crossing up/down" within x-bars.
The Moving Up alert is triggered when the source input increases by a certain value within x-bars.
The Moving Down alert is triggered when the source input decreases by a certain value within x-bars.
Notice that you have to set the Number of Bars parameter!
The calculation starts from the last formed candlestick.
Moving Up % / Moving Down %
The Moving Up % alert is triggered when the source input increases by a certain percentage value within x-bars.
The Moving Down % alert is triggered when the source input decreases by a certain percentage value within x-bars.
Notice that you have to set the Number of Bars parameter!
The calculation starts from the last formed candlestick.
Turning Up / Turning Down
The Turning Up alert is triggered when the source input turns up.
The Turning Down alert is triggered when the source input turns down.
-----------------
Disclaimer
The information contained in my Scripts/Indicators/Ideas/Algos/Systems does not constitute financial advice or a solicitation to buy or sell any securities of any type. I will not accept liability for any loss or damage, including without limitation any loss of profit, which may arise directly or indirectly from the use of or reliance on such information.
All investments involve risk, and the past performance of a security, industry, sector, market, financial product, trading strategy, backtest, or individual's trading does not guarantee future results or returns. Investors are fully responsible for any investment decisions they make. Such decisions should be based solely on an evaluation of their financial circumstances, investment objectives, risk tolerance, and liquidity needs.
My Scripts/Indicators/Ideas/Algos/Systems are only for educational purposes!
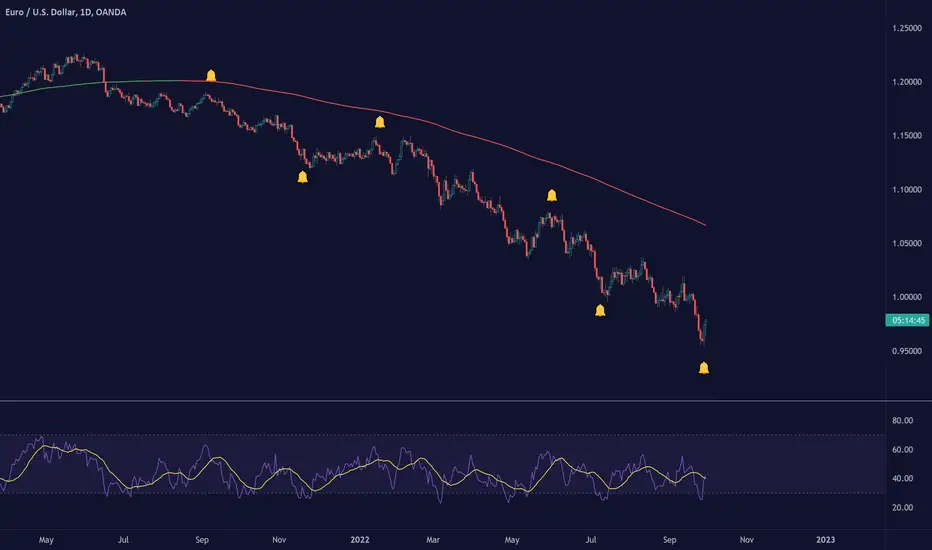
Impactful pattern and candles pattern AlertThe Alertion indicator!
impactful pattern:
pattern that happen near the zone or in the zone at lower timeframe and give us entry and stop limit price.
It is helpful for price action traders and those who want to decrease their risk.
There are 3 IP patterns:
Quasimodo
Head and shoulder
whipsaw engulfing
These patterns may occur near the zone or may not occur but by them, you can decrease your trading risk for example you can
trade with half lot before IP pattern and enter with other half after pattern.
how to use?
for example:
you find zone at 1h timeframe for short position
when price enter to your zone
you run this indicator and choose your lower timeframe, for example 15m and click on short position.
Then make the alert by right-click on your chart and choose the add alert and at condition box choose the impactful pattern and then click on create
now wait for message :)
Candles pattern:
like reversal bar, key reversal bar, exhaustion bar, pin bar, two-bar reversal, tree-bar reversal, inside bar, outside bar
these occur when the trend turn, so it is usable when the price enter to your zone or near your zone.
This pattern can decrease your risk.
Inside bar and outside bar:
if this pattern engulf up, it is bullish pattern and if engulf down, it is bearish pattern.
what does this indicator do?
this indicator is for making alert
it helps you to decrease your risk and failure.
You optimize it to alert you when IP pattern happen or candle pattern happen or inside bar or outside bar engulfing or all of them.
For IP pattern, it will message you entry and stop limit price.
It works at 2 different timeframes, so you can make alert for example in 1h TF for candles pattern and 15m TF for IP pattern.
Indicator will alert you for candles pattern at your chart timeframe and for IP pattern at timeframe you've chosen when you run the indicator, and it is changeable
in setting.
setting options
TIMEFRAME
IP: select the timeframe for IP patterns it means when IP pattern happen at that timeframe the indicator will alert you
example = your TF is 1h, you found the supply zone and want to trade, note that IP pattern happen in lower TF, so you select 15m TF or TF lower than 1h.
Short position: select it if you want to make short position.
BUFFERING
indicator send you entry and stop limit price
you can change it by amount of percent
it is your strategy to change your entry and stop loss or not
example= in head and shoulder pattern at short position, the stop limit is high price of head in pattern
so the indicator will message you the exact price but if you want to put
your stop limit 5 percent upper than exact price you can enter 5 in front of stop loss
or you want to enter 5 percent lower than exact high price of shoulder, you can optimize it.
ALERTION
you choose what alert you want
IP alert or candle alert or inside and outside bar alert
type your text for alert
you can write additional text for your message
ADVANCE
IP alert frequency option:
1. Once per bar : indicator will alert you for IP pattern once at your chat timeframe bar, and you should wait til next bar for next alert.
2. Once per bar close : alert you when your chart timeframe bar closed and next alert will happen when next bar is closed.
3. All: alert you all the times IP pattern happen
pivot left and right bars: lower will find smaller pattern
at the END:
this indicator is not strategy
it is part of your strategy that help you to increase your winning rate.
It is helpful for scalping and candle patterns finding.
After you make an alert, you can delete the indicator or change your timeframe or make another alert, your previous alert won’t change.
Thank you all.

Custom Volume - Periodic Peaks & Troughs + AlertThis script is a custom volume indicator with additional features.
But why is this useful?
The minimum and maximum volumes, in different time periods, are displayed by labels below the bars. I call them "Peaks" and "Troughs".
Hover your mouse cursor over the labels to see more details.
These parameters are widely used in technical analysis.
If traders want to confirm a reversal on a level of support–or floor–they look for high buying volume. Conversely, if traders are looking to confirm a break in the level of support, they look for low volume from buyers.
If traders want to confirm a reversal on a level of resistance–or ceiling– they look for high selling volume. Conversely, if traders are looking to confirm a break in the level of resistance, they look for high volume from buyers.
For example, take a look at the chart.
Settings menu parameters
{Dialog Box} =>
Parameter to show / hide the dialog box.
{Visual Parameters} =>
Parameters to personalize the appearance of the indicator.
{ Alert Conditions Part 01: Peaks ⏰ "} =>
Parameters to customize the alert.
{ Alert Conditions Part 02: Troughs ⏰ "} =>
Parameters to customize the alert.
{Volume MA} =>
Moving average settings
How to use alerts
Note that by creating an alert, an instance of the indicator, with all your settings, will be activated on the site's server and alerts will be triggered by it.
After that, changing the indicator settings on the chart will no longer affect the alert.
Open the settings window and select the alert conditions as you wish
Click the Create Alert button (or press the A key while holding down the ALT key)
In the Condition section, select the name of the indicator.
Make the rest of the settings as you wish.
Finally, click on the Create button.
It's finished. After a few moments, your alert will be added to the Alerts menu.
Limits
The labels are displayed after the bars close.
Labels are displayed for the last 10,000 bars.
References: Investopedia