Technical Analysis - Binary Option AlertA. Oscillators & B. Moving Averages base on TradingView's Technical Analysis by ThiagoSchmitz
C.Pivot base on Ultimate Pivot Points Alerts by elbartt
D. Summary & Alert by anhnguyen14
Binary Option Alert base on my indicator: Technical Analysis - Panel Info
Put alert = Srong Sell + close>open
Call alert = Strong buy + close
"alert" için komut dosyalarını ara

Hancock - Pump Catcher [BitMEX] [Alerts]This is a study to the version of the strategy found here .
It generates 3 alerts:
CLOSE - Triggers to close all open positions
LONG - Triggers to open a long position
SHORT - Triggers to open a short position
Commands for alerts (without stop-loss) to get you started:
CLOSE - a=bitmex e=bitmextestnet c=position t=market
LONG - a=bitmex e=bitmextestnet b=long s=xbtusd l=5 q=99% t=market
SHORT - a=bitmex e=bitmextestnet b=short s=xbtusd l=5 q=99% t=market
I would advise including a stop-loss with your commands. These commands are for autoview and don't include a stop loss, use autoview command documentation to add stop-loss.
Happy trading
Hancock

CYBER ENSEMBLE {PREVIEW}This is the PREVIEW version of CYBER ENSEMBLE
The subscription based PREMIUM version is found here:
Please PM me for access information.
Signals for the last 5 days are disabled.
Signal Alerts are disabled.
===============
CYBER ENSEMBLE is a sophisticated signalling script base on the interplay of an ensemble of optimized indicators and market state filters.
(>1000 lines of code)
Users are advised to manually back-test and optimize the settings for a particular chart and time frame, before proceeding with its use.
The algorithms will be periodically updated to further optimize and improve their performances, and new algorithms may be tested and added in the future.
Note: In no way is this intended as a financial/investment/trading advice. You are responsible for your own investment/trade decisions.

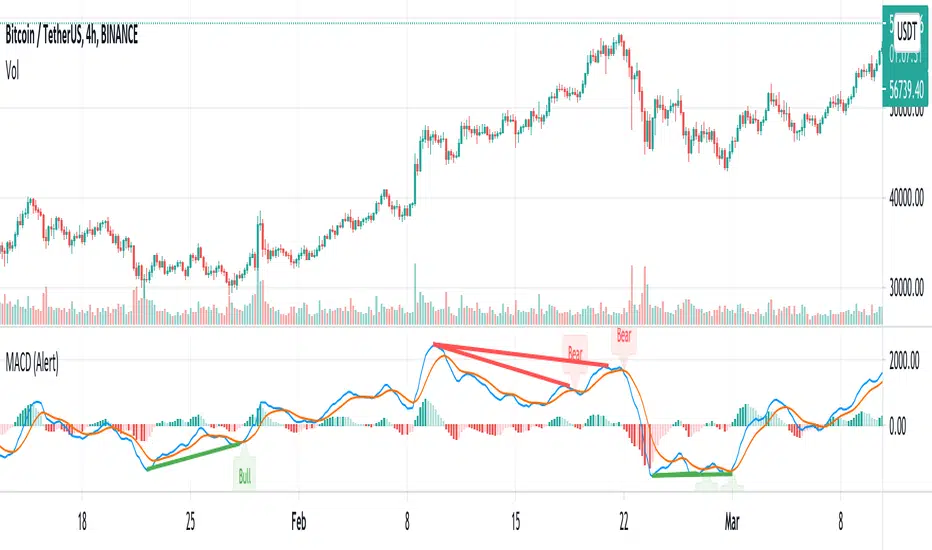
MACD w/ Divergences (Alert)To best use the MACD Divergence indicators, adjust the following settings accordingly.
• MACD Bullish Divergence Under: <0 (lower for larger volatility and more bearish markets)
• MACD Bearish Divergence Above: >0 (higher for larger volatility and more bullish markets)
Key Notes:
1. Set "Once Per Bar" instead of "Once Per Bar Close" alert.
The strategy already uses prior bar close (instead of current bar close) for calculation. This ensures that the signals will stay as they are after fired off, even when the current bar price is still changing.
2. It's OKAY to see the "alert may trigger differently than expected" warning.
Reason why you are seeing this warning is because we used a function called valuewhen() in our strategy. This function does not look at the entire history of data and has several limitations. For instance, on a 30min resolution, at the end of 2018, the function will be able to find past occurrences of BTC exceeding 16k. However, the function won't be able to find such occurrences at the end of 2019. Since our strategy is only concerned with very recent events, these limitations will not impact our results or cause repainting. You can find out more about this in the TradingView Wiki .
Trend Pulse Pro V2Trend Pulse Pro V2 (Non Repaint)
TradingView Account Needed: Free
You don't need to be an expert to use Trend Pulse Pro.
Just follow the signals and that's all and use simple Fibonacci levels to find stop loss and take profit!
You can increase the win rate even more by following some simple technical analysis, for example, when trend breaks (price break signal level) you can use that as support become resistance level (sell) or resistance becomes support (buy):
No complex things. No waste of time.
And although you won't win 100% of the trades (no signals can guarantee that), your trading will surely improve a lot!
Even someone with almost no trading experience can read the simple trading rules given in the included user guide, watch the how-to videos and follow Trend Pulse Pro’s signals to consistently make smarter trades.
With Trend Pulse Pro you will get accurate buy and sell signals every time there is a new trading opportunity so that you never miss any big price movements and makes your trading both easier and more profitable.
How to use the signals and alerts:
Trend Pulse Pro automatically analyze trend and price action to give you a signal when there's a good trade.
These trend signals and alerts are derived from live data but the stability of our code allows it to not repaint.
Trend Pulse Pro allow you to easily determine the trend and will give you buy and sell entry levels.
Works on all markets on all time frames so it's suitable for scalpers, day and swing traders.
If you want more details, the link is in the signature.
Disclaimer:
Past performance is not indicative of future performance. No representation is being made that any results discussed within the service and its related media content will be achieved. All opinions, news, research, analyses, prices or other information is provided as general market commentary and not as investment advice. TradingWalk, their members, shareholders, employees, agents, representatives and resellers do not warrant the completeness, accuracy or timeliness of the information supplied, and they shall not be liable for any loss or damages, consequential or otherwise, which may arise from the use or reliance of the TradingWalk service and its content. © 2019 TradingWalk.
TradingWalk indicators are built for TradingView. TradingWalk is on no way a part of TradingView.

*FIBAUS Ultimate Trender with AlertsVery easy to follow indicator. Its all about the trend. It works in any timeframe with any entity. Crypto, forex, commodities, and stocks. It can be used to scalp but I personally dont day trade anymore and use it for longterm trades. I normally use 6H to 1D candles.
The green ribbon and green arrows indicate a long/buy opportunity and the red ribbon with red arrows at the top of the page indicate a short/sell opportunity.
All you do is set the alerts based on your preferred timeframe and wait for the alert.
Blue spotted lines act as necklines, stop loss levels/ take profit levels.
You can see many areas where the red and green ribbons bounce or are rejected at the blue dotted line. This gives plenty of entry, re-entry, and exit opportunities.
Message me if you want a shot at it.
Happy Trading,
FIBAUS

TMA Indicator v2.2This indicator is designed to show support and resistance at local extremes. Configurable SMA crossover events can be used to impart a bullish or bearish bias. This helps to reduce noise on the chart and increase profit factor. In other words, the indicator will only look for bullish breakouts if the fast moving average is above the slow moving average and vice-versa.
SMA Crossover events can be used to filter bullish or bearish resistance levels.
SMA Crossover events can be used to filter bullish or bearish breakout alerts.
Supports alerts for entries and exits based on breakouts of local extrema.
Alerts can be generated at every breakout or with SMA crossover filtering active.
Backtests would suggest that filtering with SMA crossovers often yields slightly lower profit but with a considerable improvement to profit factor.
Green/Red indicates long/short entry
Yellow/Orange indicates long/short exit
See here for an example backtest and visualization of active SMA signal filtering:
For paper trading only. Do not use on real markets. Never make investment decisions based on this indicator alone.

PerPro V7+Alert per PAIRPerPro V7 in study mode with alerts on some pairs of FOREX.
Update:
- Alerts per pair
- Indicator mode(STUDY)
Alerts per PAIR
- Condition: PerPro V7+Alert // LONG // LONG
- Options: Once per bar close(recommend in lower timeframe)

Ichimoku 2 sets of settings, markers and alertsThis is my take on the masterful, beautiful and powerful Ichimoku.
It comes with:
- 2 sets of settings you can flip between,
- 5 types of markers:
--- Tenkan/Kijun crosses,
--- Price (close)/Tenkan crosses, with the option of only showing those occurring with the trend, so on pullbacks,
--- Price (close) exits out of the Kumo,
--- Chikou exits out of the Kumo,
--- Overbought/Oversold conditions (shown on the chart).
- Choice of showing only long or short markers,
- Coloring of bars using OB/OS conditions,
- Alerts on all markers and on combinations.
The markers are intended as indications—not bulletproof buy/sell signals.
The overbought/oversold conditions are detected when the high/low is a multiple of ATR away from Kijun. The ATR length and multiple used are configurable.
I normally use the Josh Olszewicz (CarpeNoctom) big settings, so those are the default.
I prefer subtle coloring on charts and my choice of colors reflects that.
You will see references to KumoA and KumoB in the names of inputs and style elements. For me, KumoA is the top of the Kumo when it is bullish, so the bottom when bearish.
As usual when creating alerts, be sure you already have defined proper inputs and that you are on the intended interval, as they will be used when triggering alerts.

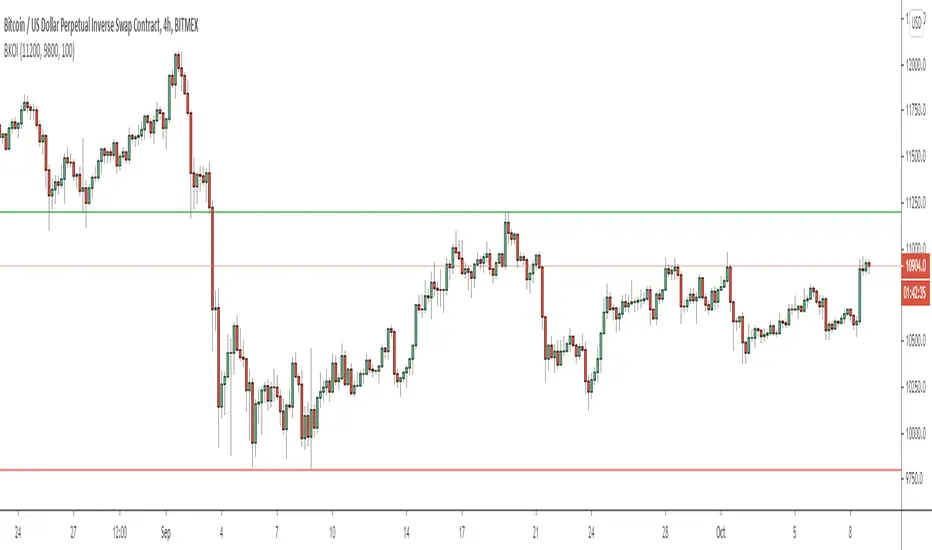
Breakout IndicatorThis script allows you to set breakout alerts.
An alert will be triggered only when price breaks and closes beyond the specified prices. You will get an alert on the first candle that closes beyond the levels you set.
92652HLB AlertThis alert will tell you the moment when it exceeds the high or low for a certain period of time. The default consists of three periods, meaning long term, medium term, short term. Alerts are also displayed on the chart with arrows, the longest arrow is long.
Alerts are set with the alert function of TradingView and individually set high value break and low price break for one period. The direction of the break indicates the direction of the market, and it seems that the break of the middle term is stronger than the short term.
In addition, the directionality when multiple breaks occur simultaneously or consecutively is recognized as stronger than a single break.

WaveTrend with Crosses and Alerts - Jab ZootaLazy bear created this script. I added alertconditions to send alerts on crossovers.

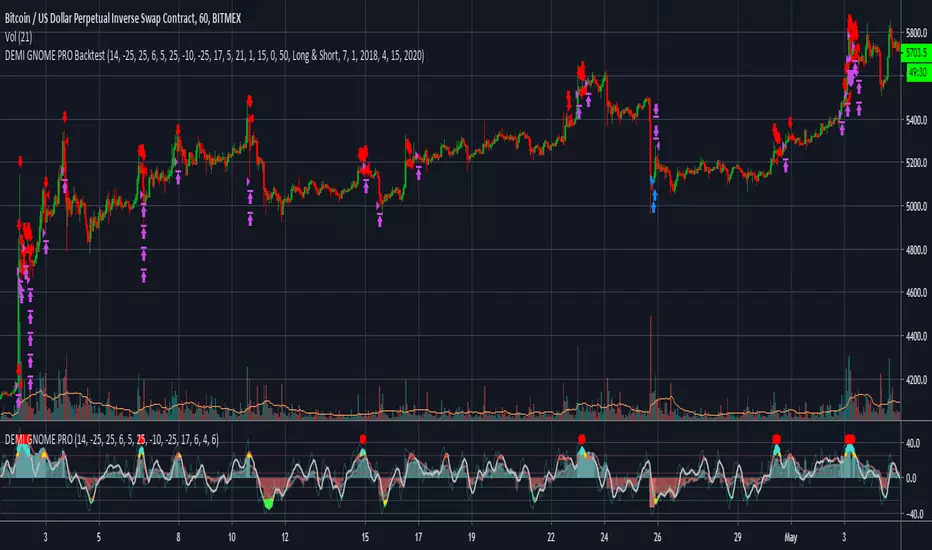
DEMI GNOME PROHello Fellow Traders!
-------------------------------------------
This is the newest addition to Gnome Alerts PRO
This is one of the newer scripts that we are using for scalping on the lower time frames on Bitmex & Binance.
This is a transformed version of GODMODE that adapts to market swings.
INCLUDES:
------------------------
*Autoview Ready*
BUY ALERTS
- multiple long positions
SELL ALERTS
- sell with oversold alerts
- sell based of %gain
Short Alerts For Bitmex
Backtesting is also available!
More info on how gain access in my profile!
CM_Ultimate_MA_MTF_V2 with Alert Long and Short Hello All,
Here is a scirpt of ChrisMoody modified with the alerts of purchases and sales.
I just have a problem with automation. At the bottom of my script my alerts "Buy1" and "Sell2" give alerts constantly and I wish to have a single alert before the order is completed. Before "Sell1" or Buy2 ".
I found the function "barstate.isfirst" that could possibly work?
Does anyone have an idea ? :)

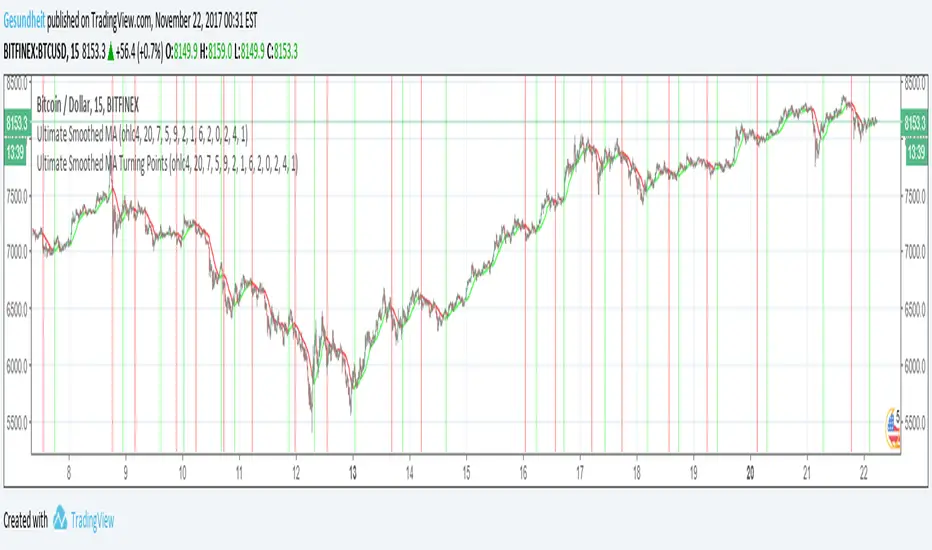
Ultimate Smoothed MA Turning PointsCompanion script to "Ultimate Smoothed MA" , details in that description.
Adapted from Chris Moody's "Ultimate Moving Average-Multi-TimeFrame-7 MA Types"
If you'd like to receive alerts on turning points, the conditions in line 96 and 97 can be used for alertcondition.
Trend-following Microprofit w/ Smart DCA BACKTESTING VERSIONCompanion to the alert script:
Tradingview doesn't like backtesting with too little capital or trade sizes less than 1 share, so the "Net Profit" number may not be accurate right off the bat. To get a better idea, change the order size or initial capital so the strategy is trading the appropriate % of initial capital. For example, if your personal capital is $2000 and you are making $100 trades, your trades are 5% of initial capital. That is roughly equivalent to the defaults using orders of 1 BTC with $100,000 capital.
Tightening the stop level will improve the Net Profit to Max Drawdown ratio, making the strategy more suitable for large trade sizes.
This script does not provide alerts for Gunbot. Find the settings you like using this strategy script, then plug those values into the alert script.
If you like this you can buy me chocolate below. Cheers!

Double Bottom Chart Pattern with alertDouble bottom is a very common chart pattern, as its name indicates, it consists of two bottoms, and these two bottoms need to be in a relative flat price level. One of the bottom can't be much higher or lower than the other.
This indicator will detect and highlight double bottom pattern automatically on chart and alert you via SMS, email and sound.
Features:
Adjust the threshold between two bottoms.
Adjust the number of bars used to form each bottom.
Check if the first bottom is the highest in a given number of bars
Adjust the number of bars between two bottoms.
Switch of alert.
It works on all timeframes and any symbol.
You can also load more than one with different inputs to get more results on chart.

Double Top Chart Pattern detector with alert
Double top is a very common chart pattern, as its name indicates, it consists of two tops, and these two tops need to be in a relative flat price level. One of the top can't be much higher or lower than the other.
This indicator will detect and highlight double top pattern automatically on chart and alert you via SMS, email and sound.
Features:
Adjust the threshold between two tops.
Adjust the number of bars used to form each top.
Check if the first top is the highest in a given number of bars
Adjust the number of bars between two tops.
Switch of alert.
A detailed instruction will show you how to properly adjust each input.
It works on all timeframes and any symbol.
You can also load more than one with different inputs to get more results on chart.

Auto Trendline, Upper Descending Trend line detector with alertThis is a custom Tradingview indicator that automatically plots descending trend lines above price bars. It will alert when the price closes above the trend line.
The concept is straightforward: the trend line is formed by two adjacent peaks when the price is in a downtrend. It will save a lot of time for people (just like me) who uses trendline often.
By deploying this indicator, should the condition meet, you don't need to draw the trend lines by hand anymore. You can also consider it as a trend line reminder.
It's also very easy to use, just load it on chart and set your desired inputs.
Features:
Adjust the strength of the 2 peaks that form the trend line.
Set price difference between two peaks in two variables: amount or percentage.
Turn on/off the cross above alert.
It works on all symbols and all timeframes.
never paint
A detailed instruction will show you how to properly adjust each input.

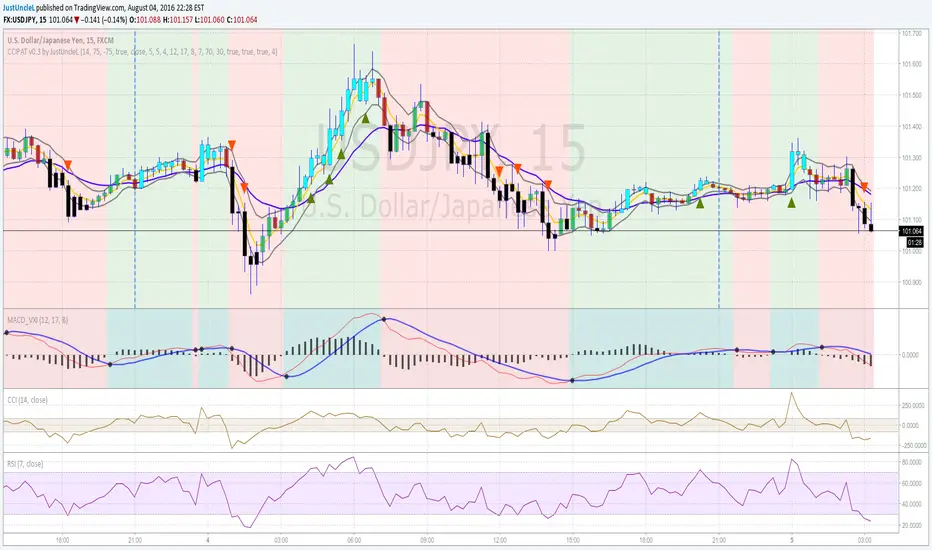
Price Action Trading System v0.3 by JustUncleLThis is an updated and improved version of my "Price Action Trading strategy". I have added two extra optional filters, one is a trend direction filter based on the MACD slow EMA(17), blue line, and the other is a RSI(7) filter which works similarly to CCI(14) but slightly different dynamics (thank you to gianfranco60 for the suggestion). Also made a couple of corrections:
- input for lenLower minval=1 should be maxval=-1
- one bar pullback did not reset trigger, missing some alerts
Some Notes about usage:
- this is an alert indicator not a signal generator, each alert is a strong trend continuance candidate,
but should be treated on it's own merits by looking at chart dynamics and market conditions.
- will work well on trending markets only.
- works best on the first alert after MACD cross over.
- don't take trades when MACD and signal are close together.
- don't trade when channel and slow MA are flat or close together or
chopper (yellow and blue MA cross over quickly over short period).
[AutoView] Trailing Stop Back Testing and alerts + TP and TSThe number one request since the creation of autoview was to have alerts triggered for Take Profit, Stop Loss and Trailing Stops. Finally, we've figured it out, and as an additional bonus, this allows us to back test trailing stops in the strategy tester.
YouTube Video about this script and setup: bit.ly
This script contains 2 things people have been asking for, multiple time frames and of course, a trailing stop that can be both back tested and setup for alerts.
This strategy itself seems to perform better without the use of the Trailing Stop, so play around and monitor it before actually trying to trade it live.
View all the trades being tracked in a Google Sheets here: bit.ly
To learn more about back testing strategies, automation and AutoView join our free slack group via slack.crypto.pink
Referral Tax:
This requires 4 alerts, so you are going to have to upgrade to PRO. It'd be greatly appreciated if you signed up using our referral link.
bit.ly
1Broker
bit.ly
okcoin
bit.ly

SMT + CVD (NQ vs ES) w/ AlertsSMT + CVD (NQ vs ES) w/ Alerts
This tool combines Smart Money Technique (SMT) and Cumulative Volume Delta (CVD) to highlight high-probability inflection points on NQ (primary) versus ES (secondary).
How it works
SMT condition: the primary breaks its most recent swing (High for bearish / Low for bullish) while the secondary does not break the corresponding swing within a small retest window.
CVD confirmation: at the same time, the primary’s CVD shows divergence (higher price but lower/equal CVD for shorts, lower price but higher/equal CVD for longs).
When both align, the script plots a marker/label and draws a line from the primary swing to the signal bar. Alerts are fired.
Signals & Alerts
Labels: “SMT+CVD DOWN/UP” on the signal bar.
Lines: connects the primary swing → signal bar so you can see the structure that produced the signal.
Alert names: “SMT+CVD Bearish” and “SMT+CVD Bullish.”
Inputs
Primary / Secondary symbols: defaults NQ & ES (you can change them).
Resolution: use chart timeframe or specify one.
Swing Left/Right Bars: pivot detection depth (higher = larger swings).
Break Window Bars: how many bars the secondary has to not break for SMT to be valid.
CVD Up/Down By: Close vs Previous Close (default) or Close vs Open.
Anchor CVD Daily: resets CVD at session/day start.
CVD Smoothing (EMA): smooths the CVD line (optional show).
FAST Pivots (no future bars): left-only swing detection so signals appear sooner and behave well in Replay/live.
Require Secondary Pivot: if ON, SMT checks wait for a confirmed secondary swing; if OFF, signals can appear while the secondary swing is still forming (useful for Replay/testing).
Show CVD line: optional, may compress price scale.
Non-repaint notes
With FAST Pivots ON, swings are detected with no future bars (minimal latency = leftBars).
With FAST Pivots OFF, standard pivots require rightBars future bars to confirm the swing (classic, but naturally delayed).
Tips
For intraday futures, keep leftBars/rightBars small (e.g., 3/3) and Break Window 1–3.
In Replay, enable FAST Pivots and consider disabling Require Secondary Pivot if you want signals to appear as soon as the primary breaks.
Combine with session filters, execution rules, or liquidity zones for context.

FTI - AlertFlow Trend Index (FTI) – Alert
Flow Trend Index (FTI) – Analytica (+ Alert) combines momentum, trend, and volatility into a data-driven analytical view—displayed directly on your chart and candlesticks. It builds on FTI-Core by revealing the numerical values behind each visual element, turning market flow into measurable insight.
FTI-Alert then adds configurable automation, notifying you in real time when the market enters overbought or oversold conditions.
Analytica shows how strongly the market is moving (flow), where its adaptive baseline lies (trend), and how far price has stretched from equilibrium (volatility).
This deeper layer helps analysts interpret when the market is gaining strength, losing momentum, or shifting direction, and especially when conditions are overbought or oversold.
• Smoothed RSI (Heikin-Ashi Powered)
────────────
Transforms RSI into color-coded candles with visible RSI values.
Heikin-Ashi smoothing filters noise, exposing authentic momentum and exhaustion levels.
-See and measure momentum simultaneously.
• McGinley Dynamic Line
────────────
Adaptive moving average that adjusts speed to market volatility.
In Analytica, you can view the exact McGinley value and Δ % distance from price, providing a real-time sense of stretch or compression.
→ Quantifies rhythm between trend and pause.
• FIBB Cloud (Fibonacci ATR Bands)
────────────
• Analytical Enhancements
────────────
RSI Number Overlay on each candle (live values)
Analytical Table showing RSI · McGinley · Δ % vs McGinley
Custom Advanced RSI Ranges for precise zone control
Adjustable themes, text size, and line style
See it. Measure it. Understand it.
In short:
FTI-Analytica merges visual flow and analytical depth.
It reveals the true numerical forces behind each move —
FTI – Analytica shows the true numerical information behind each Data point.
No signals or alerts are generated — the indicator is intended solely for visualization, study, and educational purposes.
© Zyro Trades. All rights reserved.
Zyro™ and FTI™ are unregistered trademarks of Zyro Trades.
