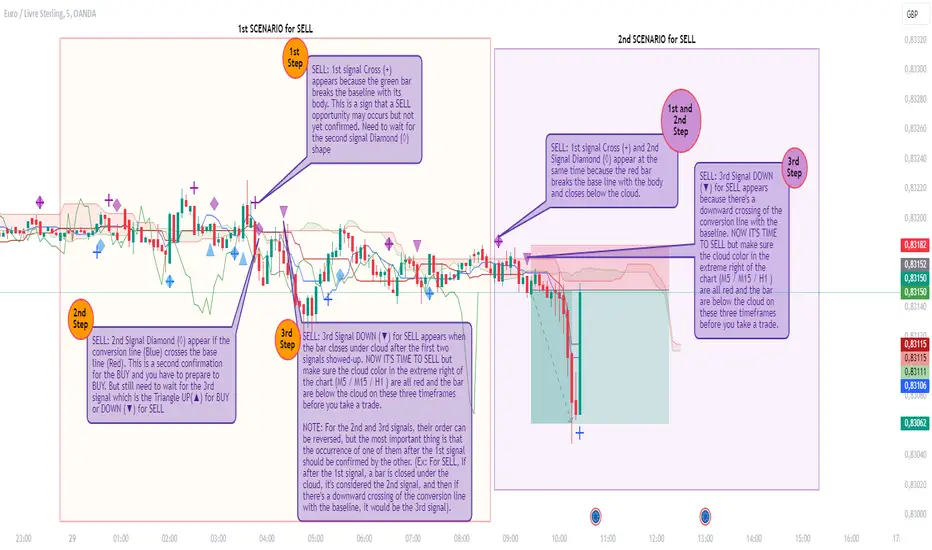
Rado Ichi Alerts v1.2This indicator is based on the “Ichimuko Cloud” indicator, but in addition, it can display signals in graphs and can also send you an alert for each signal.
Indeed, this script uses the open-source Ichimoku Cloud standard. However, the additional features I've implemented, such as the display of different signals (e. g : Cross (+) “First signal” to warn about BUY or SELL opportunities that could arise, Diamond (◊) “Second signal” to warn about BUY or SELL preparation and Triangle UP(▲) or DOWN (▼) “Third and last signal” for BUY or SELL NOW action) as well as the ability to configure ALERTS related to these signals are not included in the standard Ichimoku Cloud script and are also not reproduced by the Ichimuko Cloud script.
The logic behind these signals is based on a customized Ichimoku strategy that we've been able to develop over a long period of back-testing.
What makes this script unique and original is its capacity to display signals and at the same time send alerts for each signal. This can help traders to not sit in front of their screens all the time and only take action when the third signal appears with an alert. Then, traders visually check whether the signal is valid in relation to the strategy before placing a trade.
This is the reason why I put my script in Closed-source.
Types of Signals and Alerts: (See also the chart for more explanation)
1) Cross (+): This means that an opportunity arises when it appears (BUY or SELL). The alert associated with this signal is the “1st Alert”, which you can view and configure in the alerts dialog box during its creation. Default message for this alert: “Ichi_Opportunity_(BUY or SELL) ”.
2) Diamond (◊): This means you should get ready to (BUY or SELL). Normally, this signal appears after the Cross (+) but it can appear at the same time as the Cross (+).The alert associated with this signal is the “2nd Alert” which you can see and configure in the alerts dialog box during its creation. Default message for this alert: “Ichi_Prepare_to_(BUY or SELL) ”.
3) Rectangle Up or Down (▲ / ▼): This means you should (BUY or SELL) now. Normally, this signal appears after the Diamond (◊) but it can appear at the same time as the Diamond (◊). The alert associated with this signal is the “3rd Alert”, which you can view and configure in the alerts dialog box during its creation. Default message for this alert: “Ichi_(BUY or SELL)_NOW ”.
Alerts can be configured for BUY or SELL only, depending on your needs (and the bias you've chosen). Alert messages can also be customized.
You can also choose the alerts that interest you, (e.g. 2nd Alert only so you can prepare, or 3rd Alert only if you only need to be alerted when you should take action to buy or sell). But you can combine all three alerts on a single chart.
CORRECTIVE :
- Correction to display missing signals (which are not displayed sometimes) on each step of the strategy.
IMPROVEMENTS :
- A new function has been added to the indicator dialog to change the reset time for the first two signals if they are not triggered within 10 bars (default value) after their last execution. This feature is necessary to better organize (visualize) the display of signals.
"alert" için komut dosyalarını ara
Auto Trendlines with Break AlertsIdentify the two most recent significant swing highs and swing lows based on a customizable pivot length.
Draw trendlines extending from these points.
Provide an optional visual signal (a small diamond on the chart) and a alertcondition for sound/push notifications when a trendline is broken.
Configure: Once the indicator is on your chart, you can click on the gear icon (⚙️) next to its name to adjust the settings. You will see a checkbox to enable/disable alerts and a slider to change the pivot length.
Configuring Alerts in TradingView
The alertcondition lines in the code allow you to set up official TradingView alerts for sound and push notifications.
Create an Alert: Click the clock icon (⏰) on the right-side toolbar of your TradingView chart.
Set the Condition: In the "Condition" field, select the name of the indicator: "Auto Trendlines with Break Alerts".
Choose the Alert Type: A second dropdown will appear. Select either "High Trendline Broken" or "Low Trendline Broken" to specify which break you want to be alerted for.
Select Notification Options: In the "Notifications" section, you can check the boxes for "Play sound," "Send email," "Send push notification," etc.
Create the Alert: Click "Create" to save your alert.
AWD TRADE MANAGER (ATM) by ManhDNAWD TRADE MANAGER (ATM) is a position management tool including with some advanced features and entry suggestions. It helps you to do most of position calculations and position management, reduce time spent for charting by alerts.
There are 3 main things to describe about the manager:
(1) The original function of the manager is to help traders to manage their trades with automatic calculations of all factors of their trades with some of input values. For example, it will calculate the trade volume when you enter the bet size, entry and stop loss price. It calculates take profit price when you enter entry, stop loss prices and the risk/reward ratio, …
(2) Another function is the system of alerts. After set up a trade, create an alert and the manager will do the rest. It will send you an alert when the limit order got filled, got stopped out, take profit level hit, or even it reached a key level or an opposite/spike move just occurred…
(3) Entry suggestions: Suggest entries with price action strategies. Details bellow.
Features in details:
(1) Automatic calculations:
- Auto calculate trade volume based on entry, stop loss prices and the money users willing to lose when the trade is failed. Auto detect some type of assets and volume will be calculated in USD (for cryptocurrencies) or in lot (for forex).
- Auto calculate take profit price based on entry, stop loss prices and expected rr ratio.
-Auto suggest take profit price based on pivot points.
- Auto suggest stop loss price based on pivot points.
- You can enter several exit points with percentages and the manager will calculate the averaged risk reward ratio you earned after the last exit price reached.
- Quick entry price pick to reduce typing requirement.
- Quick trade set up: 2 checkboxes and 1 number entering to set up a trade.
(2) Alert system
After setting up a trade and creating an alert of the manager, it will follow the market and your order. It will send you alerts for all the events that you should follow up your position. These alerts can be sent to your pc, your phone and your smart watch, so even you are a full-time day trader, you will save your time for charting or managing your positions. Here’s the list of alerts:
- Sending alert when suggesting an entry with details calculated from preset inputs so you can just pick that info to enter the position including trading volume, entry, stop loss, take profit prices, timeframe, estimated risk-reward ratio …
- Sending alert when a limit order got filled and auto switch to position-managing-mode.
- Sending alert when a limit order in still staying unfilled but should be canceled (because of price reaching a key level or is running too far, …)
- Sending alert when the position got stopped out or TP hit.
- Sending alert when the running position reached a key level and need to be watched out.
- Sending alert when a spike move or opposite move just occurred.
- Sending alert when a position is taking too long to run.
- You can also set 3 levels of price with messages then ATM will send you alerts when price reaches those levels.
- When price runs, ATM might suggest you to move stop loss to levels based on pivot points by sending you alerts.
- Alert when a BOS occurred.
- Options to turn on/off each kind of alert.
(3) Entry suggestions.
The script included price action entry suggestions.
The 1st strategy is getting in a position when a candle pattern occurred and confirmed by MA20.
The 2nd strategy is detecting double top/bottom and a candle pattern confirm break out after that.
The 3rd strategy is a pullback strategy, in a trending market, a candle pattern occurs and confirms the pullback ends, it will suggest an entry.
All those strategies I am using by myself for a long period of time but to make sure they are good for your trading style, do your own research and backtest before use. Keep in mind to manage risk and be responsible to your capital.
User side modifications:
- Those price action strategies have some major arguments that users can tune themselves to make it meet their style or their needs like choosing method to suggest entries, refine entry quality by changing the confirmation methods,…
- Most of appearance factors can be changed by users.
- one-click to toggle between full features and simple mode.
TradingView Chart demo pictures:
Author's bio:
I have been a full-time day trader for 7 years. I like coding with Pinescript and I also developed some helpful indicators that provide unique aspects to approach markets and the most favorite one from that is Relative Volume Index (RVI) that will be introduced in near future.
Disclaimer:
This tool has been tested and been using for my own trading career for a long period of time but practicing to use it yourself to understand it and use it correctly is needed. All of the features have been carefully tested before publishing but make sure to double-check all the info you get from it before getting into a trade to avoid losing money by a sudden mistake or even a bug. Keep in mind you will need to take all the responsibility with your capital or any potential loss while using this tool.
If you get anything wrong while using it, please leave some comments bellow, all of your ideas or suggestions will be taken seriously.
Thank you in advance!
(It is not possible to explain all the settings or features within the description, If you have questions, please leave comment, I will answer to help you to get familiar with the tool.)
TheStrat AlertsFinally, an indicator that will monitor and send notification for any potential 'TheStrat' candle combination setups.
Explanation of 'TheStrat' trading technique
‘ TheStrat ’ technique works off the basis of labelling whether the focus candle did or did not break any of the previous candles high or low values. There are three possible label definitions; either a 1 candle, 2 candle or a 3 candle.
1 bar (inside) - If price movement on the new candle remains within the high and low of previous candle.
3 bar (outside) – If price movement went above both the high and the low of the previous candle.
2 bar (directional) – If price movement only broke with the high (called a 2-up) or if price movement only broke the low of the previous candle (called a 2-down).
Once labelled the technique then looks for certain combination of these labelled candles (called actionable setups) such as: 2-1-2, 1-2-2, 3-1-2.
How does the indicator work?
This indicator will monitor and alert you when a possible ‘ TheStrat ’ actionable combination is identified on any ticker and timeframe you add the indicator to and then register an alert. The key decisions are which TICKER and which TIMEFRAME to register the alert and lastly what actionable ‘ TheStrat ’ combination to enable in the indicator settings.
When a registered alert is running it will continually monitor for the enabled ' TheStrat ' conditions and upon the bar close of a defined condition, it generates the alert notification using the existing built-in TradingView alert feature. This indicator is not market or timeframe specific, in fact this alerting indicator can be used to register alerts on multiple tickers and timeframes simultaneously.
Example of how to use the indicator
Assume you are interested in being alerted for any ‘2-1-2’ combination on AAPL on the 30min timeframe. You would simply go to that chart (APPL on 30 min), add ' TheStrat Alerts ' indicator to the chart. Ensure the 2-1-x condition is enabled in the indicator setting. Then using the built-in TradingView - 'Create Alert' feature to register the alert that will listening to 'TheStrat Alerts' indicator monitored events. In this example the alert will specifically trigger if it finds a 2-1 bar setup and send the alert of a possible 2-1-2 setup allowing you to jump to the chart to review.
Description of the script
The script work by monitoring the development of new candles and when it finds a potential developing combination it will generate an alert prior to the completion of the actionable signal.
The following 'TheStrat' combinations have been coded.
2-1-? candle setup (expect 2-1-2)
3-1-? candle setup (expect 3-1-2)
1-2-? candle setup (expect 1-2-2 rev)
3-2-? candle setup (expect 3-2-2 rev)
2d-2d-? or 2u-2u-? (expect 2-2 rev)
"Randy Jackson" 2u-2u-2d-? or 2d-2d-2u-? candle setup
5 consecutive 2u or 5 consecutive 2d "Pivot Machine Gun" candle setup
50% retracement after a 2u
50% retracement after a 2d
Failed 2u - candle that closed red, instead of green
Failed 2d - candle that closed green, instead of red.
1-3 "Nirvana" candle setup
1 candle and 3 candle formation
How is this useful to a trader?
This unequivocally original and useful indicator relieves the need to sit and monitor all the tickers and timeframes you can simply place the alert indicator, enable the conditions under which you wish to be alerted and let it monitor for you.
The clear value of the indicator is the increased ability to find potential setups to trade when certain conditions have been identified.
TO ENABLE, please follow these steps:
1) Add indicator to your TICKER choice and TIMEFRAME of your choice.
2) Open the indicator options/settings (cog wheel of indicator) and select the checkboxes to enable which conditions you want to be alerted on. Start off with a few specific setups to get the hang of the indicator. Then OK the indicator setting window to close it.
3) Next find along the of the screen the 'Create Alert' icon (watch icon with + symbol). Click it will open the ' Create Alert ' settings.
4) For CONDITION , drop down and select ' TheStrat Alerts ' so that the alert will listen for the alerts you selected in the indicator settings.
5) Expand 'More options' to select notification preference like pop-up, sound or email
6) Finally click on ' CREATE ' to register the alerts
The indicator will now generate alerts for the options you enabled in the indicator. Please delete and re-register the alert if you changed any settings in the indicator, for example a different condition.
This indicator is not merging multiple indicators as it uses only the default TradingView alert functionality, and the source code is based on my other highly successful free indicator. The indicator does not infer future performance but does notify of the potential actionable ' TheStrat ' setup prior to the completion of the ' TheStrat ' combination. It is also an independent and standalone indicator and does not rely on any of my other published indicators.
This is a paid private invite-only indicator, if you want a trial, please contact me by sending a private message through TradingView.
Good Luck with trading and I hope this indicator helps to increase the profitability of your portfolio. Happy Trading.

1D Exit Alerts"A Daily Exit LONG" + "B Daily Exit SHORT":
I'm not using this one anymore since they often make me worry more than necessary, and I focus more on aiming to reach specific price targets, or using the 5m Exit alerts instead.
Also swing trades require less time-sensitive operations than day trades, so for me personally they felt a bit redundant.
But maybe it helps some of you:
There are 4 conditions that trigger it. As with 5m Exit Alerts, the triggering reasons show up in the exit alert message (unfortunately only as a number, since alert messages can't have "dynamic text" in TradingView).
Here are the conditions sorted from best to worst:
Gap Up / Down. Better check SPY and the stock whether a Gap Reversal is likely to happen (aka get out) or whether the stock will keep going higher / lower.
Earnings: End of day or Tomorrow morning. Alert is triggered at beginning of morning before earnings, and then again 15m before market close.
Mental stop loss: Broke daily EMA 8 or SMA - in the wrong direction....
Wrong direction: Broke below / above yesterday's Low / High. It's not immediately triggered, but only after re-touching VWAP again, to prevent too impulsive exits.
As with 5m Exit alerts: Always consider how the market and stock looks like, then decide whether to exit or not! These are meant to make you look at the chart, not to FOMO-exit.
"X Candle Close":
Same as in 1D Enter alert: Is triggered 15m before market close (I put it in here as well because I kept forgetting whether I put this one into Enter or Exit alerts...)
More infos: www.reddit.com
Supertrend + MACD Trend Change with AlertsDetailed Guide
1. Indicator Overview
Purpose:
This script combines the Supertrend and MACD indicators to help you detect potential trend changes. It plots a Supertrend line (green for bullish, red for bearish) and marks the chart with shapes when a trend reversal is signaled by both indicators. In addition, it includes alert conditions so that you can be notified when a potential trend change occurs.
How It Works:
Supertrend: Uses the Average True Range (ATR) to determine dynamic support and resistance levels. When the price crosses these levels, it signals a possible change in trend.
MACD: Focuses on the crossover between the MACD line and the signal line. A bullish crossover (MACD line crossing above the signal line) suggests upward momentum, while a bearish crossover (MACD line crossing below the signal line) suggests downward momentum.
2. Supertrend Component
Key Parameters:
Factor:
Function: Multiplies the ATR to create an offset from the mid-price (hl2).
Adjustment Impact: Lower values make the indicator more sensitive (producing more frequent signals), while higher values result in fewer, more confirmed signals.
ATR Period:
Function: Sets the number of bars over which the ATR is calculated.
Adjustment Impact: A shorter period makes the ATR react more quickly to recent price changes (but can be noisy), whereas a longer period provides a smoother volatility measurement.
Trend Calculation:
The script compares the previous close with the dynamically calculated upper and lower bands. If the previous close is above the upper band, the trend is set to bullish (1); if it’s below the lower band, the trend is bearish (-1). The Supertrend line is then plotted in green for bullish trends and red for bearish trends.
3. MACD Component
Key Parameters:
Fast MA (Fast Moving Average):
Function: Represents a shorter-term average, making the MACD line more sensitive to recent price movements.
Slow MA (Slow Moving Average):
Function: Represents a longer-term average to smooth out the MACD line.
Signal Smoothing:
Function: Defines the period for the signal line, which is a smoothed version of the MACD line.
Crossover Logic:
The script uses the crossover() function to detect when the MACD line crosses above the signal line (bullish crossover) and crossunder() to detect when it crosses below (bearish crossover).
4. Combined Signal Logic
How Signals Are Combined:
Bullish Scenario:
When the MACD shows a bullish crossover (MACD line crosses above the signal line) and the Supertrend indicates a bullish trend (green line), a green upward triangle is plotted below the bar.
Bearish Scenario:
When the MACD shows a bearish crossover (MACD line crosses below the signal line) and the Supertrend indicates a bearish trend (red line), a red downward triangle is plotted above the bar.
Rationale:
By combining the signals from both indicators, you increase the likelihood that the detected trend change is reliable, filtering out some false signals.
5. Alert Functionality
Alert Setup in the Code:
The alertcondition() function is used to define conditions under which TradingView can trigger alerts.
There are two alert conditions:
Bullish Alert: Activated when there is a bullish MACD crossover and the Supertrend confirms an uptrend.
Bearish Alert: Activated when there is a bearish MACD crossover and the Supertrend confirms a downtrend.
What Happens When an Alert Triggers:
When one of these conditions is met, TradingView registers the alert condition. You can then create an alert in TradingView (using the alert dialog) and choose one of these alert conditions. Once set up, you’ll receive notifications (via pop-ups, email, or SMS, depending on your settings) whenever a trend change is signaled.
6. User Adjustments and Their Effects
Factor (Supertrend):
Adjustment: Lowering the factor increases sensitivity, resulting in more frequent signals; raising it will filter out some signals, making them potentially more reliable.
ATR Period (Supertrend):
Adjustment: A shorter ATR period makes the indicator more responsive to recent price movements (but can introduce noise), while a longer period smooths out the response.
MACD Parameters (Fast MA, Slow MA, and Signal Smoothing):
Adjustment:
Shortening the Fast MA increases sensitivity, generating earlier signals that might be less reliable.
Lengthening the Slow MA produces a smoother MACD line, reducing noise.
Adjusting the Signal Smoothing changes how quickly the signal line responds to changes in the MACD line.
7. Best Practices and Considerations
Multiple Confirmation:
Even if both indicators signal a trend change, consider confirming with additional analysis such as volume, price action, or other indicators.
Market Conditions:
These indicators tend to perform best in trending markets. In sideways or choppy conditions, you may experience more false alerts.
Backtesting:
Before applying the indicator in live trading, backtest your settings to ensure they suit your trading style and the market conditions.
Risk Management:
Always use proper risk management, including stop-loss orders and appropriate position sizing, as alerts may occasionally produce late or false signals.
Happy trading!

Market Structure & Session Alerts### Market Structure & Session Alerts Indicator
#### Overview
The "Market Structure & Session Alerts" indicator is a comprehensive tool designed to assist traders in identifying key market structure levels, detecting liquidity sweeps, and receiving alerts for specific trading sessions. This indicator is particularly useful for traders who want to keep an eye on previous high and low levels and be alerted during pre-London and pre-New York sessions.
#### Features
1. **Previous High/Low Levels:**
- **Daily, Weekly, and Monthly Highs and Lows:** The indicator plots the previous day, week, and month high and low levels on the chart. These levels can be crucial for identifying support and resistance zones.
- **Toggle Display:** Users can choose to show or hide these levels using the "Show Previous Day/Week/Month High/Low" option.
2. **Liquidity Sweep Detection:**
- **Liquidity Sweep Identification:** The indicator detects liquidity sweeps when the current price closes above the previous day's high. This can signal potential reversals or continuations in the market.
- **Visual Alerts:** When a liquidity sweep is detected, a green triangle is plotted below the bar.
3. **Session Alerts:**
- **Session Timings:** Users can set specific start and end times for the pre-London and pre-New York sessions to match their timezone.
- **Visual Background Highlight:** The background of the chart is highlighted in yellow during the defined session times to provide a visual cue.
- **Alert Messages:** The indicator can generate alerts to notify traders when the market enters the pre-London or pre-New York session.
4. **Current Price Line:**
- The current price is plotted as a black line, providing a clear visual reference for the current market price.
#### How to Use
1. **Input Parameters:**
- `Show Previous Day/Week/Month High/Low`: Enable or disable the display of previous high/low levels.
- `Show Liquidity Sweep`: Enable or disable the detection and display of liquidity sweeps.
- `Show Session Alerts`: Enable or disable session alerts and background highlights.
2. **Session Timing Adjustments:**
- Set the `Pre-London Start`, `Pre-London End`, `Pre-New York Start`, and `Pre-New York End` times according to your timezone to ensure accurate session alerts.
3. **Alerts:**
- Make sure alerts are enabled in your TradingView settings to receive notifications when the market enters the pre-London or pre-New York sessions.
#### Example Use Cases
- **Day Traders:** Identify potential support and resistance levels using the previous day's high and low.
- **Swing Traders:** Use weekly and monthly high and low levels to determine significant market structure points.
- **Scalpers:** Detect liquidity sweeps to identify potential quick trades.
- **Session Traders:** Be alerted when the market enters key trading sessions to align your trading strategy with major market activities.
This indicator combines multiple market analysis tools into one, providing a robust system for traders to enhance their trading decisions and market awareness.

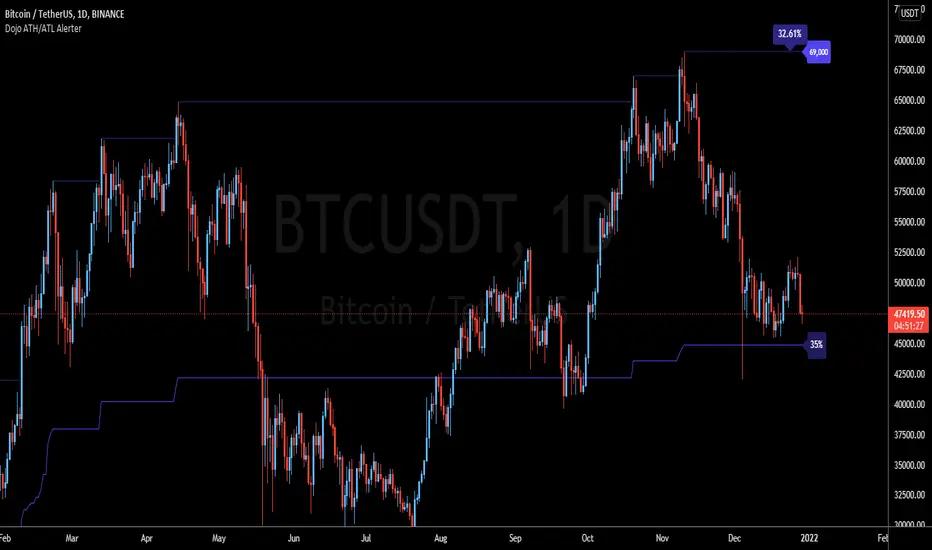
Trading-Dojo ATH/ATL AlerterTrading-Dojo High-Low indicator with alerts.
Allows you to set popup or email alerts when price breaches historic highs or lows
Or chose Embed method to have it publish directly to a webhook in Discord!
Simply place the indicator on a chart, right-click the indicator lines and add alert. Choose the type of alert you want and that's it.
* Note: the indicator excludes the current candle so if you hit ATH yesterday and you're on the weekly timeframe , it won't fire off an alert. For better resolution use Daily or lower if the asset you are alerting on is very volatile.
Liquidity Sweep Trap Alert (Improved)Detects high-conviction “liquidity sweep” traps (false breakouts) by comparing price against recent swing highs/lows, applying a wick-size filter and a cooldown period so that only meaningful reversal wicks trigger signals.
Shows labels on the chart and provides alert conditions when a trap occurs.
How It Works (Core Concept)
Swing High / Low Sweep
The script looks back a user-defined number of bars (Lookback Period) to identify the most recent swing high and swing low (excluding the current forming bar).
A Bull Trap is identified when price’s high exceeds that swing high intrabar but the candle closes back below it.
A Bear Trap is identified when price’s low dips below that swing low intrabar but the candle closes back above it.
Wick-Size Filter
To avoid tiny “micro-sweeps,” the script measures the length of the reversal wick (the distance beyond the swing high or below the swing low) as a percentage of the bar’s total range.
Only if this wick percentage ≥ Min Wick/Range % does the raw trap condition qualify for further consideration.
Cooldown Mechanism
After a trap fires, the same type of trap (bull or bear) is suppressed for a specified number of bars (Cooldown Bars).
This prevents back-to-back signals in choppy conditions and ensures each trap has breathing room before the next.
Confirmed on Close
Signals only trigger once the bar has closed (barstate.isconfirmed), eliminating “ghost” signals that flash intrabar and then vanish.
Chart Labels & Alerts
When a trap is confirmed, a label (“Trap ↑” for bull, “Trap ↓” for bear) is plotted above/below the bar (toggleable via Show Trap Labels).
Built-in alertcondition calls allow users to create native TradingView alerts tied to these confirmed traps.
Inputs & Usage
Lookback Period (bars)
Defines how many bars back to compute the recent swing high/low.
Shorter values catch more frequent, smaller swings; longer values focus on larger pivots.
Show Trap Labels
Toggle on/off the on-chart label markers.
Cooldown Bars
Number of bars to wait after a trap fires before allowing the same trap type again.
Higher values reduce signal frequency; set lower if you want more frequent triggers.
Min Wick/Range %
Minimum required wick length (beyond the swing level) as a percentage of that bar’s high–low range.
Increase to filter out weak or noise-driven sweeps; decrease if you want to capture smaller reversals.
Recommended Settings & Markets
Timeframes: Works on any timeframe (e.g., 5m, 15m, 1h, daily). Adjust inputs per instrument volatility.
Crypto (e.g., BTC): Typical starting values might be Lookback = 10, Min Wick % = 0.10–0.20, Cooldown = 3–5 bars.
Equities / Indices (e.g., Nifty, Bank Nifty): Use higher Min Wick % (e.g., 0.30–0.50) and adjust volume-based filters externally. Cooldown may be 3–5 bars on daily charts.
Testing: Always backtest or visually review sample signals before live trading. Tune Lookback and Min Wick % to balance hit-rate vs. false positives.
Originality & What Makes It Different
Beyond Simple Breakout Alerts: Instead of alerting on any breakout, this indicator specifically looks for false breakouts (liquidity sweeps) where smart money may trap retail stops.
Wick-Size Threshold: Many scripts flag any high above a swing high; here, the reversal wick must be a configurable percentage of the bar’s range, filtering out minor spikes.
Cooldown Logic: Prevents repeated signals in tight ranges, unlike basic breakout or pivot indicators that may fire repeatedly.
Confirmed on Close: Eliminates intrabar flicker signals, ensuring each alert is based on a completed bar.
Lightweight & Self-Contained: No external dependencies; works standalone on the chart. Users can hook native TradingView alerts to these conditions.
How to Use
Add to Chart: Apply the published script; no need for additional overlays.
Configure Inputs: Open settings and set:
Lookback Period to match swing size you target.
Min Wick/Range % to filter out small reversals.
Cooldown Bars so signals aren’t clustered.
Toggle Show Trap Labels on/off.
Set Alerts: In TradingView Alerts, choose “Bull Trap Detected” or “Bear Trap Detected” as the condition.
Interpret Signals:
Bull Trap: Price tried to break above a recent high but failed—potential short opportunity or exit long.
Bear Trap: Price tried to break below a recent low but failed—potential long opportunity or exit short.
Combine with Risk Management: Always apply your own stop-loss and take-profit rules; use the trap signal as one element of your trade decision.
Chart Examples & Annotations
Clean Example Chart: Display only this indicator on the chart using default inputs or example settings.
Annotation Guidance: If you include manual drawings in screenshots, clearly explain:
“Red label marks the bar where price spiked above the 10-bar swing high, closed below it with wick ≥ 10% of range, and no prior bull trap in last 5 bars → Bull Trap.”
Avoid unrelated scripts or decorative drawings that aren’t described.
Disclaimer
Not Financial Advice: Signals indicate potential reversal setups but do not guarantee outcomes. Trade at your own risk.
Use Proper Risk Management: Always define stop-loss, position size, and consider market context.
Test Before Live: Review historical signals and backtest manually or via strategy tester if possible.

Volume Spike Alert & Overlay"Volume Spike Alert & Overlay" highlights unusually high trading volume on a chart. It calculates whether the current volume exceeds a user-defined percentage above the historical average and triggers an alert if it does. The information is also displayed in a customizable on-screen table.
What It Does
Monitors volume for each bar and compares it to an average over a user-defined lookback period.
Supports multiple smoothing methods (SMA, EMA, WMA, RMA) for calculating the average volume.
Triggers an alert when current volume exceeds the threshold percentage above the average.
Displays a table on the chart with:
Current Volume
Average Volume
Threshold Percentage
Optional empty row for spacing/formatting
How It Works
User Inputs:
lookbackPeriods: Number of bars used to calculate the average volume.
thresholdPercent: % above the average that triggers a volume spike alert.
smoothingType: Type of moving average used for volume calculation.
textColor, bgColor: Formatting for the display table.
tablePositionInput: Where the table appears on the chart (e.g., Bottom Right).
Toggles for showing/hiding parts of the table.
Volume Calculations:
Calculates current bar's volume.
Calculates average volume using the selected smoothing method.
Computes the threshold: avgVol * (1 + thresholdPercent / 100).
Compares current volume to threshold.
Table Display:
Dynamically creates a table with volume stats.
Adds rows based on user preferences.
Alerts:
alertcondition fires when currentVol crosses above the calculated threshold.
Message: "Volume Threshold Exceeded"
Usage Examples
Example 1: Spotting High Activity
Apply the script to a stock like AAPL on a 5-minute chart.
Set lookbackPeriods to 20 and thresholdPercent to 30.
Use EMA for more reactive volume tracking.
When volume spikes more than 30% above the 20-period EMA, an alert triggers.
Example 2: Day Trading Filter
For scalpers, apply it to a 1-minute crypto chart (e.g., BTC/USDT).
Set thresholdPercent to 50 to catch only strong surges.
Position the table at the top left and reduce visible info for a clean layout.
Example 3: Long-Term Context
On a daily chart, use SMA and set lookbackPeriods to 50.
Helps identify breakout moves supported by strong volume.
How this is different from Trading View's Volume indicator:
The standard volume plot from trading view allows users to set a alert when the average line is crossed, but it does not allow you to set a custom percentage at which to trigger an alert. This indicator will allow you to set any percentage you wish to monitor and above that percentage threshold will trigger your alert.
===== ORIGINAL DESCRIPTION =====
Volume Spike Alert & Overlay
This indicator will display the following as an overlay on your chart:
Current volume
Average Volume
Threshold for Alert
Description:
This indicator will display the current bar volume based on the chart time frame,
display the average volume based on selected conditions,
allow user selectable threshold over the average volume to trigger an alert.
Options:
Average lookback period
Smoothing type
Alert Threshold %
Enable / Disable Each Value
Change Text Color
Change Background Color
Change Table location
Add/Remove extra row for placement in top corner
Usage Example:
I use this indicator to alert when the current volume exceeds the average volume by a specified percentage to alert to volume spikes.
Set the threshold to 25% in the settings
Create an alert by clicking on the 3 dots on the right of the indicator title on the chart
When the threshold is exceeded the alert will trigger

BOCS Channel Scalper Indicator - Mean Reversion Alert System# BOCS Channel Scalper Indicator - Mean Reversion Alert System
## WHAT THIS INDICATOR DOES:
This is a mean reversion trading indicator that identifies consolidation channels through volatility analysis and generates alert signals when price enters entry zones near channel boundaries. **This indicator version is designed for manual trading with comprehensive alert functionality.** Unlike automated strategies, this tool sends notifications (via popup, email, SMS, or webhook) when trading opportunities occur, allowing you to manually review and execute trades. The system assumes price will revert to the channel mean, identifying scalp opportunities as price reaches extremes and preparing to bounce back toward center.
## INDICATOR VS STRATEGY - KEY DISTINCTION:
**This is an INDICATOR with alerts, not an automated strategy.** It does not execute trades automatically. Instead, it:
- Displays visual signals on your chart when entry conditions are met
- Sends customizable alerts to your device/email when opportunities arise
- Shows TP/SL levels for reference but does not place orders
- Requires you to manually enter and exit positions based on signals
- Works with all TradingView subscription levels (alerts included on all plans)
**For automated trading with backtesting**, use the strategy version. For manual control with notifications, use this indicator version.
## ALERT CAPABILITIES:
This indicator includes four distinct alert conditions that can be configured independently:
**1. New Channel Formation Alert**
- Triggers when a fresh BOCS channel is identified
- Message: "New BOCS channel formed - potential scalp setup ready"
- Use this to prepare for upcoming trading opportunities
**2. Long Scalp Entry Alert**
- Fires when price touches the long entry zone
- Message includes current price, calculated TP, and SL levels
- Notification example: "LONG scalp signal at 24731.75 | TP: 24743.2 | SL: 24716.5"
**3. Short Scalp Entry Alert**
- Fires when price touches the short entry zone
- Message includes current price, calculated TP, and SL levels
- Notification example: "SHORT scalp signal at 24747.50 | TP: 24735.0 | SL: 24762.75"
**4. Any Entry Signal Alert**
- Combined alert for both long and short entries
- Use this if you want a single alert stream for all opportunities
- Message: "BOCS Scalp Entry: at "
**Setting Up Alerts:**
1. Add indicator to chart and configure settings
2. Click the Alert (⏰) button in TradingView toolbar
3. Select "BOCS Channel Scalper" from condition dropdown
4. Choose desired alert type (Long, Short, Any, or Channel Formation)
5. Set "Once Per Bar Close" to avoid false signals during bar formation
6. Configure delivery method (popup, email, webhook for automation platforms)
7. Save alert - it will fire automatically when conditions are met
**Alert Message Placeholders:**
Alerts use TradingView's dynamic placeholder system:
- {{ticker}} = Symbol name (e.g., NQ1!)
- {{close}} = Current price at signal
- {{plot_1}} = Calculated take profit level
- {{plot_2}} = Calculated stop loss level
These placeholders populate automatically, creating detailed notification messages without manual configuration.
## KEY DIFFERENCE FROM ORIGINAL BOCS:
**This indicator is designed for traders seeking higher trade frequency.** The original BOCS indicator trades breakouts OUTSIDE channels, waiting for price to escape consolidation before entering. This scalper version trades mean reversion INSIDE channels, entering when price reaches channel extremes and betting on a bounce back to center. The result is significantly more trading opportunities:
- **Original BOCS**: 1-3 signals per channel (only on breakout)
- **Scalper Indicator**: 5-15+ signals per channel (every touch of entry zones)
- **Trade Style**: Mean reversion vs trend following
- **Hold Time**: Seconds to minutes vs minutes to hours
- **Best Markets**: Ranging/choppy conditions vs trending breakouts
This makes the indicator ideal for active day traders who want continuous alert opportunities within consolidation zones rather than waiting for breakout confirmation. However, increased signal frequency also means higher potential commission costs and requires disciplined trade selection when acting on alerts.
## TECHNICAL METHODOLOGY:
### Price Normalization Process:
The indicator normalizes price data to create consistent volatility measurements across different instruments and price levels. It calculates the highest high and lowest low over a user-defined lookback period (default 100 bars). Current close price is normalized using: (close - lowest_low) / (highest_high - lowest_low), producing values between 0 and 1 for standardized volatility analysis.
### Volatility Detection:
A 14-period standard deviation is applied to the normalized price series to measure price deviation from the mean. Higher standard deviation values indicate volatility expansion; lower values indicate consolidation. The indicator uses ta.highestbars() and ta.lowestbars() to identify when volatility peaks and troughs occur over the detection period (default 14 bars).
### Channel Formation Logic:
When volatility crosses from a high level to a low level (ta.crossover(upper, lower)), a consolidation phase begins. The indicator tracks the highest and lowest prices during this period, which become the channel boundaries. Minimum duration of 10+ bars is required to filter out brief volatility spikes. Channels are rendered as box objects with defined upper and lower boundaries, with colored zones indicating entry areas.
### Entry Signal Generation:
The indicator uses immediate touch-based entry logic. Entry zones are defined as a percentage from channel edges (default 20%):
- **Long Entry Zone**: Bottom 20% of channel (bottomBound + channelRange × 0.2)
- **Short Entry Zone**: Top 20% of channel (topBound - channelRange × 0.2)
Long signals trigger when candle low touches or enters the long entry zone. Short signals trigger when candle high touches or enters the short entry zone. Visual markers (arrows and labels) appear on chart, and configured alerts fire immediately.
### Cooldown Filter:
An optional cooldown period (measured in bars) prevents alert spam by enforcing minimum spacing between consecutive signals. If cooldown is set to 3 bars, no new long alert will fire until 3 bars after the previous long signal. Long and short cooldowns are tracked independently, allowing both directions to signal within the same period.
### ATR Volatility Filter:
The indicator includes a multi-timeframe ATR filter to avoid alerts during low-volatility conditions. Using request.security(), it fetches ATR values from a specified timeframe (e.g., 1-minute ATR while viewing 5-minute charts). The filter compares current ATR to a user-defined minimum threshold:
- If ATR ≥ threshold: Alerts enabled
- If ATR < threshold: No alerts fire
This prevents notifications during dead zones where mean reversion is unreliable due to insufficient price movement. The ATR status is displayed in the info table with visual confirmation (✓ or ✗).
### Take Profit Calculation:
Two TP methods are available:
**Fixed Points Mode**:
- Long TP = Entry + (TP_Ticks × syminfo.mintick)
- Short TP = Entry - (TP_Ticks × syminfo.mintick)
**Channel Percentage Mode**:
- Long TP = Entry + (ChannelRange × TP_Percent)
- Short TP = Entry - (ChannelRange × TP_Percent)
Default 50% targets the channel midline, a natural mean reversion target. These levels are displayed as visual lines with labels and included in alert messages for reference when manually placing orders.
### Stop Loss Placement:
Stop losses are calculated just outside the channel boundary by a user-defined tick offset:
- Long SL = ChannelBottom - (SL_Offset_Ticks × syminfo.mintick)
- Short SL = ChannelTop + (SL_Offset_Ticks × syminfo.mintick)
This logic assumes channel breaks invalidate the mean reversion thesis. SL levels are displayed on chart and included in alert notifications as suggested stop placement.
### Channel Breakout Management:
Channels are removed when price closes more than 10 ticks outside boundaries. This tolerance prevents premature channel deletion from minor breaks or wicks, allowing the mean reversion setup to persist through small boundary violations.
## INPUT PARAMETERS:
### Channel Settings:
- **Nested Channels**: Allow multiple overlapping channels vs single channel
- **Normalization Length**: Lookback for high/low calculation (1-500, default 100)
- **Box Detection Length**: Period for volatility detection (1-100, default 14)
### Scalping Settings:
- **Enable Long Scalps**: Toggle long alert generation on/off
- **Enable Short Scalps**: Toggle short alert generation on/off
- **Entry Zone % from Edge**: Size of entry zone (5-50%, default 20%)
- **SL Offset (Ticks)**: Distance beyond channel for stop (1+, default 5)
- **Cooldown Period (Bars)**: Minimum spacing between alerts (0 = no cooldown)
### ATR Filter:
- **Enable ATR Filter**: Toggle volatility filter on/off
- **ATR Timeframe**: Source timeframe for ATR (1, 5, 15, 60 min, etc.)
- **ATR Length**: Smoothing period (1-100, default 14)
- **Min ATR Value**: Threshold for alert enablement (0.1+, default 10.0)
### Take Profit Settings:
- **TP Method**: Choose Fixed Points or % of Channel
- **TP Fixed (Ticks)**: Static distance in ticks (1+, default 30)
- **TP % of Channel**: Dynamic target as channel percentage (10-100%, default 50%)
### Appearance:
- **Show Entry Zones**: Toggle zone labels on channels
- **Show Info Table**: Display real-time indicator status
- **Table Position**: Corner placement (Top Left/Right, Bottom Left/Right)
- **Long Color**: Customize long signal color (default: darker green for readability)
- **Short Color**: Customize short signal color (default: red)
- **TP/SL Colors**: Customize take profit and stop loss line colors
- **Line Length**: Visual length of TP/SL reference lines (5-200 bars)
## VISUAL INDICATORS:
- **Channel boxes** with semi-transparent fill showing consolidation zones
- **Colored entry zones** labeled "LONG ZONE ▲" and "SHORT ZONE ▼"
- **Entry signal arrows** below/above bars marking long/short alerts
- **TP/SL reference lines** with emoji labels (⊕ Entry, 🎯 TP, 🛑 SL)
- **Info table** showing channel status, last signal, entry/TP/SL prices, risk/reward ratio, and ATR filter status
- **Visual confirmation** when alerts fire via on-chart markers synchronized with notifications
## HOW TO USE:
### For 1-3 Minute Scalping with Alerts (NQ/ES):
- ATR Timeframe: "1" (1-minute)
- ATR Min Value: 10.0 (for NQ), adjust per instrument
- Entry Zone %: 20-25%
- TP Method: Fixed Points, 20-40 ticks
- SL Offset: 5-10 ticks
- Cooldown: 2-3 bars to reduce alert spam
- **Alert Setup**: Configure "Any Entry Signal" for combined long/short notifications
- **Execution**: When alert fires, verify chart visuals, then manually place limit order at entry zone with provided TP/SL levels
### For 5-15 Minute Day Trading with Alerts:
- ATR Timeframe: "5" or match chart
- ATR Min Value: Adjust to instrument (test 8-15 for NQ)
- Entry Zone %: 20-30%
- TP Method: % of Channel, 40-60%
- SL Offset: 5-10 ticks
- Cooldown: 3-5 bars
- **Alert Setup**: Configure separate "Long Scalp Entry" and "Short Scalp Entry" alerts if you trade directionally based on bias
- **Execution**: Review channel structure on alert, confirm ATR filter shows ✓, then enter manually
### For 30-60 Minute Swing Scalping with Alerts:
- ATR Timeframe: "15" or "30"
- ATR Min Value: Lower threshold for broader market
- Entry Zone %: 25-35%
- TP Method: % of Channel, 50-70%
- SL Offset: 10-15 ticks
- Cooldown: 5+ bars or disable
- **Alert Setup**: Use "New Channel Formation" to prepare for setups, then "Any Entry Signal" for execution alerts
- **Execution**: Larger timeframes allow more analysis time between alert and entry
### Webhook Integration for Semi-Automation:
- Configure alert webhook URL to connect with platforms like TradersPost, TradingView Paper Trading, or custom automation
- Alert message includes all necessary order parameters (direction, entry, TP, SL)
- Webhook receives structured data when signal fires
- External platform can auto-execute based on alert payload
- Still maintains manual oversight vs full strategy automation
## USAGE CONSIDERATIONS:
- **Manual Discipline Required**: Alerts provide opportunities but execution requires judgment. Not all alerts should be taken - consider market context, trend, and channel quality
- **Alert Timing**: Alerts fire on bar close by default. Ensure "Once Per Bar Close" is selected to avoid false signals during bar formation
- **Notification Delivery**: Mobile/email alerts may have 1-3 second delay. For immediate execution, use desktop popups or webhook automation
- **Cooldown Necessity**: Without cooldown, rapidly touching price action can generate excessive alerts. Start with 3-bar cooldown and adjust based on alert volume
- **ATR Filter Impact**: Enabling ATR filter dramatically reduces alert count but improves quality. Track filter status in info table to understand when you're receiving fewer alerts
- **Commission Awareness**: High alert frequency means high potential trade count. Calculate if your commission structure supports frequent scalping before acting on all alerts
## COMPATIBLE MARKETS:
Works on any instrument with price data including stock indices (NQ, ES, YM, RTY), individual stocks, forex pairs (EUR/USD, GBP/USD), cryptocurrency (BTC, ETH), and commodities. Volume-based features are not included in this indicator version. Multi-timeframe ATR requires higher-tier TradingView subscription for request.security() functionality on timeframes below chart timeframe.
## KNOWN LIMITATIONS:
- **Indicator does not execute trades** - alerts are informational only; you must manually place all orders
- **Alert delivery depends on TradingView infrastructure** - delays or failures possible during platform issues
- **No position tracking** - indicator doesn't know if you're in a trade; you must manage open positions independently
- **TP/SL levels are reference only** - you must manually set these on your broker platform; they are not live orders
- **Immediate touch entry can generate many alerts** in choppy zones without adequate cooldown
- **Channel deletion at 10-tick breaks** may be too aggressive or lenient depending on instrument tick size
- **ATR filter from lower timeframes** requires TradingView Premium/Pro+ for request.security()
- **Mean reversion logic fails** in strong breakout scenarios - alerts will fire but trades may hit stops
- **No partial closing capability** - full position management is manual; you determine scaling out
- **Alerts do not account for gaps** or overnight price changes; morning alerts may be stale
## RISK DISCLOSURE:
Trading involves substantial risk of loss. This indicator provides signals for educational and informational purposes only and does not constitute financial advice. Past performance does not guarantee future results. Mean reversion strategies can experience extended drawdowns during trending markets. Alerts are not guaranteed to be profitable and should be combined with your own analysis. Stop losses may not fill at intended levels during extreme volatility or gaps. Never trade with capital you cannot afford to lose. Consider consulting a licensed financial advisor before making trading decisions. Always verify alerts against current market conditions before executing trades manually.
## ACKNOWLEDGMENT & CREDITS:
This indicator is built upon the channel detection methodology created by **AlgoAlpha** in the "Smart Money Breakout Channels" indicator. Full credit and appreciation to AlgoAlpha for pioneering the normalized volatility approach to identifying consolidation patterns. The core channel formation logic using normalized price standard deviation is AlgoAlpha's original contribution to the TradingView community.
Enhancements to the original concept include: mean reversion entry logic (vs breakout), immediate touch-based alert generation, comprehensive alert condition system with customizable notifications, multi-timeframe ATR volatility filtering, cooldown period for alert management, dual TP methods (fixed points vs channel percentage), visual TP/SL reference lines, and real-time status monitoring table. This indicator version is specifically designed for manual traders who prefer alert-based decision making over automated execution.

Volume Spike AlertIndicator Features:
📊 Core Functionalities:
Exceptional Volume Detection:
Calculates volume in USD (volume × price)
Compares it against a 90-day average (3 months)
Configurable from 1 to 252 days
Visual Signals:
Green labels for bullish candles with high volume
Red labels for bearish candles with high volume
Displays excess percentage (e.g., +45.2%)
Dual Alert System:
AlertCondition: For manual alert configuration in TradingView
Alert(): Automated alerts with detailed information
⚙️ Available Settings:
Average Period: 1–252 days (default: 90 days)
Enable/Disable Alerts: Configurable checkbox
Show/Hide Labels: Visual control
Label Size: Tiny, Small, Normal, Large
Minimum Threshold: Minimum percentage required to trigger a signal
📋 Displayed Information:
On Labels:
Excess percentage (e.g., +67.3%)
Color based on candle direction
In the Table:
Current volume in millions USD
Average volume in millions USD
Excess percentage
Alert status (ACTIVE/NORMAL)
Calculation period
In Alerts:
Candle type (BULLISH 🟢 / BEARISH 🔴)
Symbol and current price
Current volume vs. average
Timeframe used
Key Levels with Alerts
Introducing the "Key Levels with Alerts" Indicator
This powerful and fully customizable indicator for the TradingView platform helps you easily identify and monitor crucial **daily, weekly, and monthly price levels** directly on your chart. Beyond just visual representation, the indicator offers advanced alert capabilities to notify you of any price breaks at these significant areas.
Key Levels Identified by the Indicator
This indicator calculates and displays six vital price levels based on the previous day's, week's, and month's closed candles:
1. **PDH (Previous Day High):** The highest price of the previous day.
2. **PDL (Previous Day Low):** The lowest price of the previous day.
3. **PWH (Previous Week High):** The highest price of the previous week.
4. **PWL (Previous Week Low):** The lowest price of the previous week.
5. **PMH (Previous Month High):** The highest price of the previous month.
6. **PML (Previous Month Low):** The lowest price of the previous month.
Core Features
* **Visual Line Display:** Each of these six levels is plotted as a **horizontal line** on your chart. These lines start from the current candle and extend forward for a specified number of candles (defaulting to 20 candles).
* **Complete Style Customization:** For every level (PDH, PDL, PWH, PWL, PMH, PML), you can **independently customize** the line's color, width, and style (solid, dashed, dotted) directly through the indicator's settings. This feature allows you to easily differentiate between the various levels.
* **Toggleable Labels:** You can choose whether to display text labels like "PDH", "PDL", "PWH", "PWL", "PMH", "PML" at the end of each line. The style of these labels will also automatically match their corresponding line colors.
* **Line Visibility Control:** Beyond just labels, you can also independently **show or hide the lines themselves** for PDH, PDL, PWH, PWL, PMH, and PML.
* **Price Break Alerts:** This is one of the indicator's most important features. You can set up alerts for each of these levels:
* **PDH Break Alert:** Triggers when the price moves above the **Previous Day High**.
* **PDL Break Alert:** Triggers when the price moves below the **Previous Day Low**.
* **PWH Break Alert:** Triggers when the price moves above the **Previous Week High**.
* **PWL Break Alert:** Triggers when the price moves below the **Previous Week Low**.
* **PMH Break Alert:** Triggers when the price moves above the **Previous Month High**.
* **PML Break Alert:** Triggers when the price moves below the **Previous Month Low**.
* **Clear Alert Messages:** Each alert message includes the **symbol or ticker name** (e.g., ` `) so you can quickly identify which asset the alert pertains to and which level has been broken.
* **Enable/Disable Alerts:** You have the flexibility to enable or disable each PDH, PDL, PWH, PWL, PMH, and PML alert independently via the indicator's settings.
Why This Indicator Is Useful
Daily, weekly, and monthly High and Low levels often act as **key support and resistance areas**. Traders use these levels to identify potential entry and exit points, set stop-loss and take-profit targets, and understand overall market sentiment. This indicator, with its clear visualization and timely alerts, helps you effectively leverage this crucial information in your trading strategies.

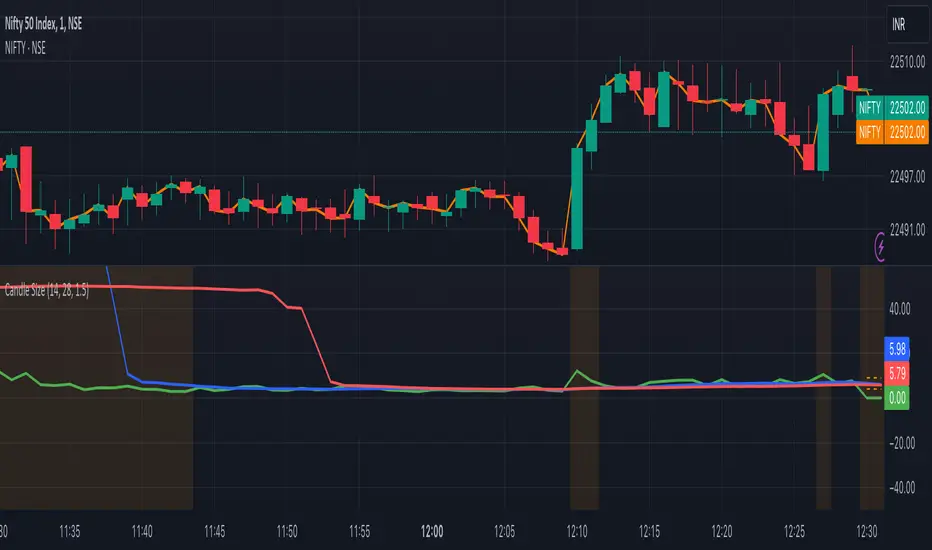
Candle Size with Moving Averages and AlertsOverview
The "Candle Size with Moving Averages and Alerts" indicator is designed to provide traders with a visual representation of the size of each candle. This is useful for identifying periods of high volatility or significant price movements. The indicator also offers moving averages of the candle sizes and customizable alert thresholds to notify traders of unusually large or small candles.
Key Features
Candle Size Plot: Displays the size of each candle on a separate panel.
Moving Averages: Optionally plot moving averages of the candle sizes with customizable lengths and colors.
Alert Thresholds: Define thresholds to get alerted when candle sizes are unusually large or small.
Customizable Colors: Choose colors for different elements of the indicator.
Alerts: Visual and background color alerts for significant candle sizes.
How to Use the Indicator
Adding the Indicator to Your Chart
Open TradingView and navigate to your chart.
Click on the "Indicators" button at the top of the chart.
Search for "Candle Size with Moving Averages and Alerts."
Click on the indicator to add it to your chart.
Customizing the Indicator
Once the indicator is added to your chart, click on the settings icon (gear icon) next to the indicator's name in the chart legend.
This will open the settings panel where you can customize various parameters of the indicator.
Settings and Parameters
Show Moving Averages
Checkbox: Enable or disable the display of moving averages on the candle size plot.
MA Length 1
Input: Set the length of the first moving average (default is 14).
MA Length 2
Input: Set the length of the second moving average (default is 28).
Alert Threshold
Input: Define the threshold for alerts as a multiple of the average candle size (default is 1.5).
MA Color 1
Color Picker: Choose the color for the first moving average (default is blue).
MA Color 2
Color Picker: Choose the color for the second moving average (default is red).
Candle Size Color
Color Picker: Choose the color for the candle size plot (default is green).
Alert Threshold Color
Color Picker: Choose the color for the alert thresholds (default is orange).
Understanding the Plots
Candle Size Plot
The main plot shows the size of each candle (high minus low) in green by default.
This helps you visualize the volatility and identify significant price movements.
Moving Averages
If enabled, two moving averages are plotted on the candle size chart to help you understand the average candle size over different periods.
MA 1 (blue by default) and MA 2 (red by default) provide a smoothed view of the candle sizes.
Alert Thresholds
The upper and lower thresholds are plotted as dashed lines (orange by default).
The upper threshold indicates an unusually large candle size, while the lower threshold indicates an unusually small candle size.
Alerts and Background Colors
When the candle size exceeds the upper threshold, an alert is triggered, and the background color changes to a semi-transparent orange.
When the candle size falls below the lower threshold, an alert is triggered, and the background color changes to a semi-transparent orange.
These visual cues help you quickly identify significant candle sizes.
Example Settings
MA Length 1: 14
MA Length 2: 28
Alert Threshold: 1.5
MA Color 1: Blue
MA Color 2: Red
Candle Size Color: Green
Alert Threshold Color: Orange
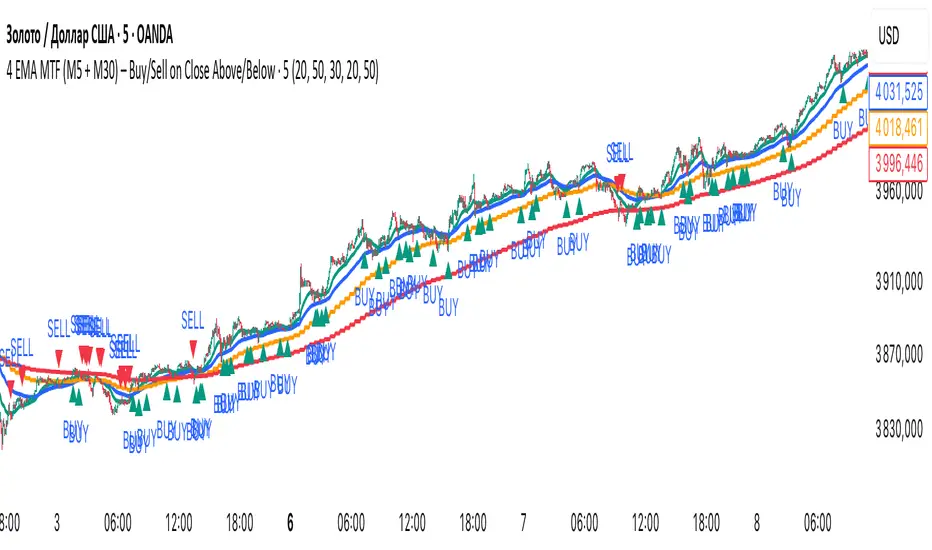
Andrei Marin4 EMA MTF (M5 + M30) – Buy/Sell on Close Above/Below🚀 4 EMA MTF (M5 + M30) — Trend Power Confirmation System
Catch the trend before it takes off.
This indicator fuses multi-timeframe momentum and precision trend alignment using 4 EMAs (2 from M5 + 2 from M30). When short- and mid-term trends lock in the same direction, you get clean, high-probability Buy and Sell signals — confirmed only on bar close, no repainting.
💡 The Concept
In trending markets, real consistency comes from multi-timeframe confluence.
This tool reads both your local M5 chart and the higher-timeframe M30 to detect moments when price breaks above or below all four EMAs — meaning both intraday and swing flows are aligned.
When the M5 and M30 EMAs agree, it’s not noise — it’s momentum.
✅ BUY → Price closes above all 4 EMAs
❌ SELL → Price closes below all 4 EMAs
🔒 No repaint: All conditions confirmed after bar close.
🔍 Features
🧭 4 EMA Fusion: EMA 20 & 50 on both M5 and M30 for double-layer confirmation.
⚡ Instant Visuals: Arrows mark fresh buy/sell signals only when trend alignment occurs.
🎨 Dynamic Background: Teal = bullish control, Red = bearish momentum.
🔔 Built-in Alerts: Receive instant notifications when new signals trigger.
🧩 Customizable: Change EMA lengths, higher-timeframe (HTF), or turn visuals on/off.
🧠 How It Works
Local EMAs (M5): Fast/Slow smoothing of short-term trend.
Higher-TF EMAs (M30): Pulled securely with request.security() and no repaint settings (lookahead_off).
Signals appear only once, when a new alignment is confirmed on close — eliminating fake flips.
⚙️ Inputs
Category Parameter Default Description
M5 Settings EMA rapide / EMA lente 20 / 50 Short-term trend layer
M30 Settings Timeframe HTF 30 Medium-term confirmation
M30 EMAs EMA rapide / EMA lente 20 / 50 Higher-timeframe trend filter
Display Show Labels / Background ON / ON Optional visuals
🧭 Why Traders Love It
🔹 Crystal-clear direction — no second guessing trend bias
🔹 No laggy repainting tricks — only confirmed data
🔹 Adaptable for all assets — Forex, Indices, Crypto, Metals
🔹 Perfect companion for scalpers and intraday swing traders
This is your trend alignment radar — simple, visual, and powerful.
🔔 Alerts
BUY ALERT: “Close above EMA20/50 (M5 + M30)”
SELL ALERT: “Close below EMA20/50 (M5 + M30)”
You can connect these alerts to bots, webhooks, or notifications — stay synced with every confirmed breakout.
⚠️ Notes
This is a confirmation tool, not a standalone entry system. Combine it with:
Structure breaks or liquidity sweeps
ATR-based stop losses
Volume or session filters
🌍 Summary
4 EMA MTF (M5 + M30) delivers multi-timeframe precision with clean, non-repainting signals that align your short-term and mid-term trends.
Designed for traders who demand clarity, momentum, and discipline.
💬 “When M5 and M30 agree — the trend just got serious.”
Bull Market Support Band Alert (20W SMA & 21W EMA) - Multi-Alert═══════════════════════════════════════════════════════════════════
🎯 WHAT THIS INDICATOR DOES:
═══════════════════════════════════════════════════════════════════
This indicator monitors the Bull Market Support Band (BMSB) - a popular trend-following system that uses the 20-week Simple Moving Average (SMA) and 21-week Exponential Moving Average (EMA) to identify major market trends. It alerts you when price crosses either moving average on any stock in your watchlist.
═══════════════════════════════════════════════════════════════════
📈 THE BULL MARKET SUPPORT BAND STRATEGY:
═══════════════════════════════════════════════════════════════════
- ABOVE both MAs = Bullish trend (consider holding/buying)
- BELOW both MAs = Bearish trend (consider caution/selling)
- CROSSING ABOVE = Potential trend change to bullish
- CROSSING BELOW = Potential trend change to bearish
Originally popularized by cryptocurrency analysts, the BMSB has proven effective across all markets for identifying major trend changes.
═══════════════════════════════════════════════════════════════════
⚡ KEY FEATURES:
═══════════════════════════════════════════════════════════════════
✅ Single alert monitors your ENTIRE watchlist
✅ Works on ANY timeframe (daily, 4H, 1H) while maintaining weekly MA accuracy
✅ Visual signals when crosses occur (green/red arrows)
✅ Real-time status table showing current values
✅ Background coloring for quick trend identification
✅ Customizable alert settings for crosses above/below
═══════════════════════════════════════════════════════════════════
🔔 HOW TO SET UP ALERTS:
═══════════════════════════════════════════════════════════════════
1. Add this indicator to your chart
2. Click Alert (alarm icon)
3. Select "BMSB Watchlist Alert" → "BMSB Cross Alert"
4. Choose your alert frequency:
• "Once Per Bar" = Immediate alerts (for active traders)
• "Once Per Bar Close" = Confirmed signals (fewer false alarms)
5. CHECK "Apply to all symbols in watchlist" ← IMPORTANT!
6. Select your watchlist and create
═══════════════════════════════════════════════════════════════════
⚙️ RECOMMENDED SETTINGS:
═══════════════════════════════════════════════════════════════════
📍 FOR SWING TRADERS:
- Chart: Daily timeframe
- Alert Trigger: Once Per Bar Close
- Both crosses enabled
📍 FOR ACTIVE TRADERS:
- Chart: 4H or Daily timeframe
- Alert Trigger: Once Per Bar
- Both crosses enabled
📍 FOR LONG-TERM INVESTORS:
- Chart: Weekly timeframe
- Alert Trigger: Once Per Bar Close
- Focus on crosses above
═══════════════════════════════════════════════════════════════════
📊 VISUAL ELEMENTS:
═══════════════════════════════════════════════════════════════════
- BLUE LINE = 20-week Simple Moving Average
- RED LINE = 21-week Exponential Moving Average
- GREEN ARROWS = Price crossed above BMSB
- RED ARROWS = Price crossed below BMSB
- GREEN BACKGROUND = Price above both MAs (bullish)
- RED BACKGROUND = Price below both MAs (bearish)
- STATUS TABLE = Current price position and MA values
═══════════════════════════════════════════════════════════════════
💡 PRO TIPS:
═══════════════════════════════════════════════════════════════════
1. The indicator calculates WEEKLY MAs regardless of your chart timeframe
2. Best used with liquid stocks/cryptos with good volume
3. Consider waiting for daily/weekly close for confirmation
4. Crosses are more significant after extended periods above/below
5. Works great with additional confirmation (volume, RSI, etc.)
═══════════════════════════════════════════════════════════════════
⚠️ IMPORTANT NOTES:
═══════════════════════════════════════════════════════════════════
- FREE accounts limited to 1 active alert
- Alerts check based on YOUR selected timeframe, not the weekly MA calculation
- False signals possible during ranging/choppy markets
- Not financial advice - use as one tool among many
═══════════════════════════════════════════════════════════════════
👨💻 AUTHOR'S NOTE:
═══════════════════════════════════════════════════════════════════
Built for traders who want to monitor multiple stocks efficiently without creating dozens of individual alerts. Perfect for identifying major trend changes across your entire portfolio with a single alert.
Tags: #BMSB #BullMarketSupportBand #20WeekSMA #21WeekEMA #TrendFollowing #MovingAverage #WatchlistAlert #MultiTimeframe #SwingTrading #TrendTrading

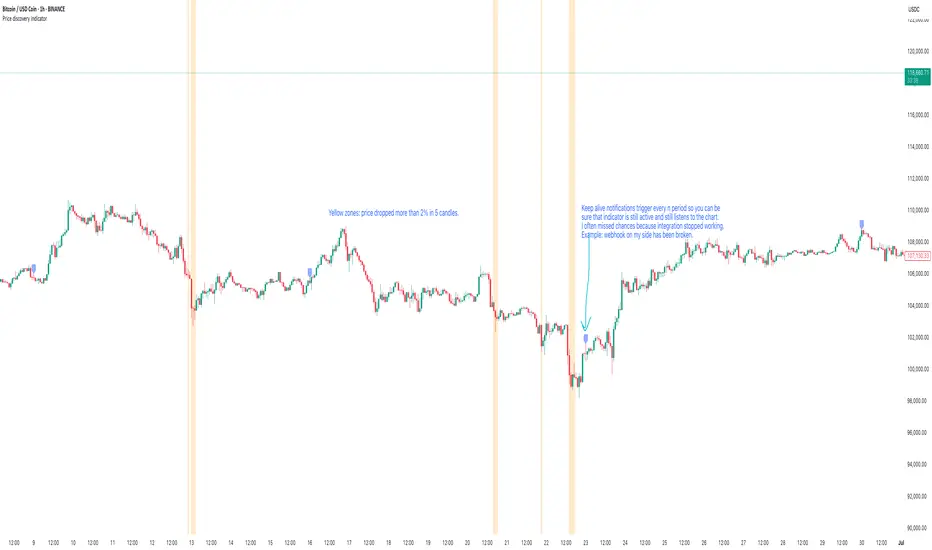
Price discovery indicatorGives an ability to show places where price drops more than n percent in x candles. Use cases: see dips of btc, get a notification when a stablecoin goes crazy, validate that webhook integration works as expected using keep alive messages.
Features included:
- Price dip alerts. Create an alert that sends a notification every time price dips more than expected (yellow zone at the chart).
- Percentage drop threshold. Define how many percents price should drop to trigger an alert and to show a yellow zone.
- Candles length threshold. Define within how many candles this drop should happen. If price drops in 2% within 10 candles, but this option is 5 - the alert will not be triggered because price dropped not as fast as expected.
- Templates of messages on price dip and price recovery. Set your message that should be triggered with alert.
- Keep alive feature. Set to trigger keep alive alerts every period. Can be helpful if you don't check charts often - this feature will trigger alert every period with "hey, the integration is alive" message. I use it to validate on weekly basis that tradingview triggers my alerts (example: you created an alert with expiration date and forgot to recreate it), that webhook integration receives these alerts, that the integration sends these alerts to telegram. Example: I expect to see this message every monday's morning, otherwise something is broken and I have to check what is wrong with my alerting system.
Volume & ATR Projection Tracker w/ Table & Alerts# README: Volume & ATR Projection Tracker (Pine Script Indicator)
## Overview
This Pine Script indicator for TradingView is designed to help traders analyze volume activity and potential short-term price volatility. It plots volume bars, calculates a moving average of volume, highlights unusual volume spikes (differentiating between up and down bars), and projects potential price ranges for upcoming hours based on Average True Range (ATR). It also provides a status table and configurable alerts.
**Disclaimer:** This indicator provides informational analysis and projections based on historical data and volatility. It does **not** provide guaranteed price predictions or financial advice. Trading involves substantial risk. Always do your own research and consult with a qualified financial advisor.
## Features
* **Volume Plotting:** Displays volume as a histogram in a separate panel.
* **Volume Moving Average:** Calculates and plots a configurable MA (SMA, EMA, WMA) of volume.
* **Unusual Volume Detection:** Identifies bars where volume significantly exceeds its moving average (based on a user-defined multiplier).
* **Differentiated Volume Analysis:**
* Colors volume bars differently based on whether unusual volume occurred on an up-bar (Close > Open), down-bar (Close < Open), or neutral bar (Close == Open).
* Plots different spike markers (up/down triangles) on the price chart for unusual volume on up/down bars.
* **ATR Volatility Projections:**
* Calculates the Average True Range (ATR) as a measure of recent volatility.
* Projects a potential price range (Close +/- ATR \* Multiplier) for a specified number of future hours.
* Plots these ranges as dashed lines and labels on the price chart.
* **Important:** These are volatility-based *ranges*, not directional predictions.
* **Status Table:** Displays a concise summary table on the chart including:
* Current Volume Status (Normal, High (Up), High (Down), High (Neut)).
* Current Volume compared to its MA (as a percentage).
* The projected ATR range for the next hour.
* **Configurable Alerts:** Provides alert conditions for:
* Unusual Volume detection.
* Volume crossing above its MA.
* Volume crossing below its MA.
* **Customizable Inputs:** Allows users to configure MA settings, volume threshold, ATR settings, projection hours, trading session times, and colors.
## How it Works
1. **Volume Analysis:**
* Calculates a Moving Average (SMA, EMA, or WMA) of the volume over a specified length (`MA Length`).
* Compares the current bar's volume to this MA. If `Volume > MA * Unusual Vol Multiplier`, the volume is flagged as "unusual".
* Checks if the unusual volume occurred on a bar where `Close > Open` (Up), `Close < Open` (Down), or `Close == Open` (Neutral).
* Colors the volume bars and plots spike markers based on this differentiated status.
2. **ATR Projections:**
* Calculates the ATR over a specified length (`ATR Length`).
* At the start of each hour *within the defined Trading Session*:
* Calculates an upper projection level: `Current Close + (Current ATR * ATR Multiplier)`.
* Calculates a lower projection level: `Current Close - (Current ATR * ATR Multiplier)`.
* Stores these levels for the specified number of `Projection Hours Ahead`.
* Draws dashed lines and labels on the price chart representing these hourly ranges for the future, but only if they are within TradingView's 500-bar drawing limit from the current bar.
3. **Status Table:**
* Updates on the last bar of the chart.
* Displays the current differentiated volume status, the percentage difference between current volume and its MA, and the calculated ATR range for the *next* hour.
4. **Alerts:**
* Uses `alertcondition()` to create trigger conditions based on `unusualVolumeBase`, `vol_cross_above`, and `vol_cross_below`. Users can create alerts based on these conditions in the TradingView UI.
## Input Settings
The indicator settings are organized into groups:
**Group 1: Volume Analysis Settings**
* **MA Length:** (Default: 20) Number of bars for the volume MA calculation.
* **MA Type:** (Default: SMA) Type of moving average (SMA, EMA, WMA).
* **Unusual Vol Multiplier:** (Default: 2.0) Threshold for detecting unusual volume (Volume > MA * Multiplier).
* **Show Volume Spikes:** (Default: true) Toggle visibility of triangle markers on the price chart.
* **Show Volume MA:** (Default: true) Toggle visibility of the MA line on the volume panel.
**Group 2: ATR Projection Settings**
* **ATR Length:** (Default: 14) Number of bars for the ATR calculation.
* **ATR Multiplier:** (Default: 1.5) Factor applied to ATR to determine the projection range width. Higher values create wider ranges.
* **Projection Hours Ahead:** (Default: 8) How many hours forward to calculate and display projections.
* **Show Projections:** (Default: true) Toggle visibility of projection lines and labels on the price chart.
**Group 3: Session & Colors**
* **Trading Session:** (Default: "0930-1600") Defines the hours during which projections are calculated. **Crucial:** Format is HHMM-HHMM based on the exchange timezone (see Timezone Note below).
* **Normal Vol Color:** (Default: blue) Color for volume bars when volume is not unusual.
* **Volume MA Color:** (Default: yellow) Color of the volume MA line.
* **Unusual Vol (Up Bar) Color:** (Default: light green) Color for unusual volume bars where Close > Open.
* **Unusual Vol (Down Bar) Color:** (Default: light red) Color for unusual volume bars where Close < Open.
* **Unusual Vol (Neutral Bar) Color:** (Default: light gray) Color for unusual volume bars where Close == Open.
* **Projection Line Color:** (Default: orange) Color of the dashed projection range lines.
* **Proj Label Bg Color:** (Default: semi-transparent gray) Background color for projection labels.
* **Proj Label Text Color:** (Default: white) Text color for projection labels.
## Timezone Note
The `Trading Session` input relies on a timezone setting within the `is_in_session` function in the code (currently hardcoded to `"UTC-4"` as an example for US Eastern Time). **You may need to edit the script code** to change this timezone string (e.g., `"America/New_York"`, `"Europe/London"`, `"Asia/Tokyo"`) to match the exchange time of the instrument you are trading. Consult Pine Script documentation for valid timezone strings.
## Limitations
* **Drawing Limit:** TradingView limits drawing objects (lines, labels) to a maximum of ~500 bars into the future from the current bar. On lower timeframes, the script automatically stops drawing projections that exceed this limit.
* **Projection vs. Prediction:** The ATR ranges are based on past volatility and are *not* price predictions. The market can easily move outside these projected ranges.
* **Alerts:** Alerts for price crossing the projected future levels are not implemented due to technical complexity in Pine Script.
## Disclaimer
Trading financial markets involves substantial risk of loss and is not suitable for all investors. The information provided by this indicator is for educational and informational purposes only and does not constitute financial advice, investment advice, trading advice, or any other sort of advice. You should not make any investment decision based solely on the information provided by this indicator. Past performance is not indicative of future results.
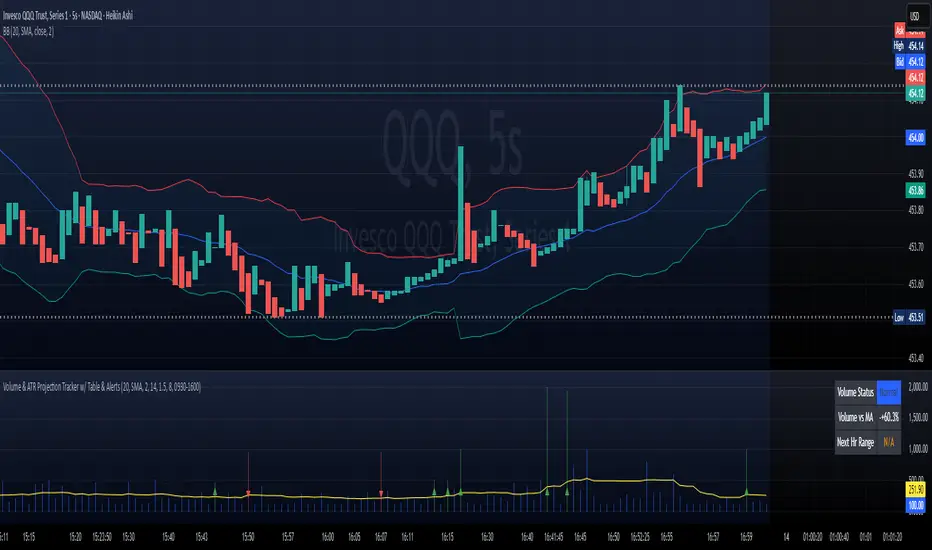
Min-Max | Buy-Sell Alert with LevelsMin-Max | Buy-Sell Alert with Levels
Description:
The Min-Max | Buy-Sell Alert with Levels indicator is a powerful tool designed to help traders identify key levels of support and resistance based on the previous day's high and low prices. It plots horizontal lines for the previous day's minimum (Min) and maximum (Max) prices, along with four intermediate levels (Stop Loss 1 to Stop Loss 4) calculated as equal percentage steps between the Min and Max.
This indicator is perfect for traders who want to:
Identify potential entry points when the price returns within the Min-Max range.
Set stop-loss levels based on the calculated intermediate levels.
Receive alerts for buy, sell, and stop-loss conditions.
Key Features:
Previous Day's Min and Max Lines:
Automatically plots the Min (red line) and Max (green line) of the previous day.
These levels act as dynamic support and resistance zones.
Intermediate Stop Loss Levels:
Calculates and plots four intermediate levels (Stop Loss 1 to Stop Loss 4) between the Min and Max.
Each level is equally spaced, representing potential stop-loss or take-profit zones.
Customizable Alerts:
Buy Alert: Triggered when the price returns within the Min-Max range after breaking below the Min.
Sell Alert: Triggered when the price returns within the Min-Max range after breaking above the Max.
Stop Loss Alerts: Triggered when the price reaches any of the four intermediate levels (Stop Loss 1 to Stop Loss 4).
Customizable Appearance:
Adjust the thickness, color, and style (solid, dashed, dotted) of the lines.
Customize the colors of the Stop Loss labels for better visualization.
Labels on the Chart:
Displays "Buy" and "Sell" labels on the chart when the respective conditions are met.
Labels for Stop Loss levels are also displayed for easy reference.
How to Use:
Add the indicator to your chart.
Customize the settings (line colors, thickness, and alert preferences) in the indicator's settings panel.
Use the Min and Max lines as dynamic support and resistance levels.
Monitor the intermediate levels (Stop Loss 1 to Stop Loss 4) for potential stop-loss or take-profit zones.
Set up alerts for Buy, Sell, and Stop Loss conditions to stay informed about key price movements.
Why Use This Indicator?
Simple and Effective: Focuses on the most important levels from the previous day.
Customizable: Tailor the indicator to match your trading style and preferences.
Alerts: Never miss a trading opportunity with customizable alerts for key conditions.
Settings:
Line Thickness: Adjust the thickness of the Min, Max, and intermediate lines.
Line Colors: Customize the colors of the Min, Max, and intermediate lines.
Line Style: Choose between solid, dashed, or dotted lines.
Stop Loss Label Colors: Customize the colors of the Stop Loss labels.
Alerts: Enable or disable alerts for Buy, Sell, and Stop Loss conditions.
Ideal For:
Day traders and swing traders.
Traders who rely on support and resistance levels.
Anyone looking for a clear and customizable tool to identify key price levels.
Disclaimer:
This indicator is for educational and informational purposes only. It does not constitute financial advice. Always conduct your own analysis and trade responsibly.
Get Started Today!
Add the Min-Max | Buy-Sell Alert with Levels indicator to your chart and take your trading to the next level. Customize it to fit your strategy and never miss a key trading opportunity again!
Custom Time Alert with Vertical Line📌 Detailed Explanation of the Custom Time Alert with Vertical Line in Pine Script v5
This script is a time-based alert system designed for TradingView. It allows traders to set a specific hour and minute for alerts and provides visual indicators on the chart, including a marker when the alert triggers and a vertical line at the alert time.
🔹 Main Features
Custom Alert Time → Users can specify the exact hour and minute for an alert.
Time Zone Offset Support → Users can manually adjust their local UTC offset to ensure alerts trigger at the correct time.
Real-Time Alert Condition → When the market reaches the set time, an alert notification is triggered.
Chart Visualization → A red marker appears when the alert is activated, and a blue vertical line is drawn at the alert time.
Automated Calculation → The script adjusts the alert time based on the user’s time zone settings.
🛠️ How It Works
User Input for Alert Time
The script allows users to enter their desired alert hour (0-23) and minute (0-59).
This ensures the alert triggers at the exact specified time.
Time Zone Offset Handling
Users enter their UTC offset (e.g., New York is -5, Tokyo is +9).
This ensures alerts work correctly regardless of the user’s location.
Time Calculation
The script adjusts the TradingView time by adding the time zone offset in milliseconds.
This converts the UTC-based TradingView time into the user’s local time.
Checking for a Time Match
The script constantly checks if the current hour and minute match the user-defined alert time.
If they match, the script activates an alert.
Triggering Alerts
The script uses TradingView’s alertcondition() function to create an alert.
When the time matches, TradingView sends a notification (e.g., pop-up, sound, or mobile alert).
Chart Markers for Visual Alerts
A red marker is displayed on the chart when the alert triggers.
A blue vertical line is drawn at the exact alert time.
📌 Example Use Cases
📈 1. Forex Traders Monitoring Market Opens
A forex trader who trades the London session wants an alert when the market opens at 8:00 AM UTC.
The trader sets:
Alert Hour = 8
Alert Minute = 0
Time Zone Offset = 0 (for UTC)
When the market reaches 8:00 AM UTC, the script triggers an alert.
📈 2. Stock Market Open Alerts
A trader in New York (EST) wants an alert at 9:30 AM Eastern Time (New York Stock Exchange open).
New York’s UTC offset is -5.
The trader sets:
Alert Hour = 9
Alert Minute = 30
Time Zone Offset = -5
The script ensures the alert triggers at 9:30 AM EST.
📈 3. Crypto Trader Watching a Specific Time
A crypto trader wants an alert for a specific strategy at 3:00 PM in Tokyo (UTC+9).
Tokyo’s UTC offset is +9.
The trader sets:
Alert Hour = 15
Alert Minute = 0
Time Zone Offset = +9
The script ensures the alert triggers exactly at 3:00 PM Tokyo time.
TIME Indicator – CET (hour-based) + Bias Forecast + Alerts [EN]TIME Indicator – CET + Bias Forecast + Alerts
What it does
Splits each day (CET/CEST) into 7 fixed time windows: 0–6, 6–9, 9–12, 12–15, 15–18, 18–22, 22–24.
Detects market regime (Bull/Bear/Neutral) automatically from an HTF EMA (configurable), or you can set the regime manually.
Maps each day-of-week × window to an expected behavior (Bull/Bear/Neutral/Chop) with strength 1–5 (your research schedule).
Backtests on-the-fly: logs each finished window’s return to compute:
Hit-rate (directional accuracy on Bull/Bear calls)
Average % move (log-return → %)
t-stat (significance)
Observation counts N
Visualizes results via:
Heatmap 7×7 (Days × Windows) with selectable metric (Hit-rate / Avg% / t-stat)
Day (paged) table
Split 2× (long) tables to fit small screens
Forecast panel: shows the next N windows (default 8) with labels and color tint based on category + strength. Uses CET midday anchoring to avoid day-shift bugs.
Regime logic
HTF EMA (length configurable) on a selectable timeframe (HTF for regime/tfStats).
“Bull” when price > EMA (optionally EMA slope > 0); “Bear” when price < EMA (slope < 0); else “Neutral”.
Tip: for 1h charts use tfStats=240 (4h) for a stable bias; for 2h charts consider 240–360; swing traders can go 360–720.
Color language
Green shades = Bull (strength 1–5)
Red shades = Bear (1–5)
Orange = Chop (1–5)
Gray = Neutral/Range (1–5)
Optional: neutral/chop can be tinted by current regime (setting).
Alerts (3 modes)
Every window (baseline) – fires at the start of each window, always (for manual verification).
Qualified window – fires at window start only if stats meet your thresholds: Min N, Min Hit-rate.
Hourly ping (CET) – optional every-hour reminder (also mid-window).
Alert message example
Monday 6–9 — Mild rise (strength 2) | Regime: Bull | Suggest: Long
Hit-rate: 87.4% (N=215) | Avg: 0.23%
Key implementation details
Uses CET/CEST consistently. “Today” is stabilized by CET midday to prevent DOW misalignment across session boundaries.
Windows are computed from CET hour, not exchange sessions, so it’s robust across assets/timezones as long as you want CET logic.
Statistics are maintained in arrays (7×7); each completed window updates N, sum of returns, sum of squares, directional hits, etc.
Heatmap cells compute metric + color strength dynamically; you can switch the displayed metric from the input.
Inputs (most useful)
Market regime: Auto (EMA) / Bull / Bear / Neutral
EMA length (Auto), HTF for regime (minutes), Require slope
Results view: Heatmap 7×7 / Day (paged) / Split 2× (long)
Heatmap metric: Hit-rate / Avg % / t-stat
Forecast: number of upcoming windows, color opacity, tint neutral by regime
Alerts: enable baseline/qualified/hourly, thresholds Min N, Min Hit-rate
How to use
Pick your chart TF (e.g., 1h). Set HTF for regime (e.g., 240) and EMA length (e.g., 100). Keep Require slope = ON for cleaner bias.
Start on Heatmap 7×7 to spot strong day×window pockets. Then use Forecast to see what’s next today/tomorrow.
Turn on ALERT: Every window to get a message at the start of every window; optionally add Qualified for filtered calls.
In TradingView Alerts dialog choose “Any alert() function call” to receive all alert types.
Limitations / notes
This is a statistical bias tool, not a signal generator. Combine with price action, liquidity zones, vol regime, news.
Hit-rates and averages depend on your symbol/timeframe history; results differ across assets and time ranges.
EMA-based regime is HTF-closed; bias flips only after the higher-timeframe bar confirms.
Changelog snapshot (current build)
Pine v6; fixed DOW alignment via CET midday; refactored forecast (next N windows), new baseline/qualified/hourly alerts, color-tinted neutral/chop, improved table layout and text sizing.
If you want, I can also write a short “How to request access” blurb for your private/hidden publication page.
Instructions to Traders
What this tool shows
Day split (CET/CEST): 0–6, 6–9, 9–12, 12–15, 15–18, 18–22, 22–24.
For each Day × Window it displays the expected behavior (Bull/Bear/Neutral/Chop) and strength 1–5 based on historical stats.
Heatmap metrics: Hit-rate, Avg % move, or t-stat.
Quick setup
Chart TF: start on 1h (works on 30m–2h too).
HTF for regime (EMA bias):
1h chart → 240 (4h) recommended
2h chart → 240–360
Swing (4h/1D) → 360–720
EMA length: 100 (default). Keep Require slope = ON for cleaner Bull/Bear bias.
View: start with Heatmap 7×7, then try Forecast to see the next windows.
Forecast panel
Shows the next N upcoming windows (default 8), with labels and color by category + strength.
Uses CET midday anchoring to keep weekdays correct (no “day shift” at midnight).
Alerts
Enable ALERT: Every window (no filters) to get a message at the start of every window.
Optionally enable ALERT: Only when N & Hit-rate ok (filtered alerts) and ALERT: Every hour (CET) ping (hourly reminder).
In TradingView’s Create Alert dialog, select “Any alert() function call” to receive all alert types.
Alert text includes: Day + Window, regime, suggestion (Long/Short/Wait), Hit-rate, N, Avg %.
How to use the bias
Treat it as a context/expectation map, not a blind signal.
Combine with structure (HH/HL, S/R), liquidity, volatility regime, and risk management.
Stronger shades (4–5) = stronger historical tendency; still validate with live price action.
Troubleshooting
Day names wrong? Ensure Timezone = Europe/Bratislava (CET/CEST) in inputs.
“No data / n/a”: load more chart history or switch to a symbol with longer data.
Regime feels too jumpy/laggy: adjust HTF for regime and/or EMA length.
Access / contact
If this script is private and you need access, send your TradingView username with the subject “TIMETrading access”.
For support/feedback: describe your symbol, chart TF, HTF setting, and a screenshot.
Disclaimer: Statistical tendencies ≠ certainty. This is educational research, not financial advice. Always use stops and size risk responsibly.
RSI‑MA Near‑Level AlertRSI‑MA Near‑Level Alert — Publication Description
Overview
RSI‑MA Near‑Level Alert plots a smoothed Relative Strength Index (RSI) line and sends automatic alerts whenever that line comes within a user‑defined distance of two key thresholds (default = 70 for overbought, 30 for oversold). It is designed for traders who want an early warning—before a classic 70/30 cross—so they can tighten stops, scale out, or prepare reversal setups.
How It Works
RSI Calculation – Uses the standard RSI (default length 14).
Smoothing – Applies a moving‑average (default Simple 10) to reduce noise.
Proximity Logic – On every bar, the script measures the absolute distance between the smoothed RSI line and each threshold.
If the distance ≤ the Proximity setting (default 1 point), the condition flips to true.
Built‑in Alert Triggers – Two alertcondition() calls are embedded:
“RSI MA near UPPER level”
“RSI MA near LOWER level”
Select either one (or both) from the TradingView alert dialog and choose your delivery method (popup, e‑mail, SMS, webhook).
Inputs
Input Default Purpose
RSI Length 14 Core momentum look‑back.
Smoothing MA Length 10 Length of the MA applied to RSI.
Upper Level 70 Overbought line.
Lower Level 30 Oversold line.
Alert Proximity (points) 1.0 How close (in RSI points) the MA must get to trigger.
All inputs are fully editable after you add the script to a chart.
Typical Use‑Cases
Pre‑emptive Exits – Get notified when momentum is stalling near 70 or 30 so you can lock in gains before a reversal.
Reversal Hunting – Combine the alert with price‑action patterns (pin bars, engulfing candles) for higher‑probability fades.
Breakout Confirmation – Increase Upper Level to 80 / Lower Level to 20 and lower Proximity to 0.5 for more aggressive trend‑following alerts.
Step‑by‑Step Alert Setup
Add the script to your chart.
Click the alarm‑clock‑plus icon (or press Alt + A).
In “Condition,” select RSI‑MA Near‑Level Alert.
Choose either RSI MA near UPPER level or RSI MA near LOWER level.
Pick Once Per Bar Close for confirmed signals or Once Per Bar for real‑time.
Select your preferred notification methods and click Create.
(Repeat for the opposite threshold.)
Customization Tips
Change Smoothing Type – Replace ta.sma() with ta.ema(), ta.rma(), etc., directly in the code if you prefer another MA.
Track Multiple Assets – Apply the indicator to each symbol in a multi‑chart layout and set independent alerts.
Narrow Range Play – Set Upper = 60, Lower = 40 and Proximity = 0.5 to monitor a quiet‑momentum band.
Disclaimer
This script is provided for educational purposes only. It does not constitute financial advice, and past performance is not indicative of future results. Always back‑test and validate on demo data before risking live capital. The author assumes no liability for trading losses or platform malfunctions.
First 15-Min Candle Detector [With Breakout Alerts]Indicator: First 15-Minute Candle Detector
Purpose
This indicator helps traders by identifying and marking the high, low, and mid-point of the first 15-minute candle of the market session. It also provides visual aids and alerts for price breakouts above or below these levels, making it ideal for intraday trading strategies.
This script is suitable for traders focusing on early session momentum or reversal strategies.
Key Features
Market Start Customization: Configure the market start time (hour and minute) to align with your trading session or exchange timezone.
Visual Aids:
Horizontal lines to mark the High , Low , and Mid-point of the first 15-minute candle.
Background highlighting to identify the first 15-minute candle.
Configurable colors and line widths for clear visuals.
Breakout Alerts:
Real-time alerts for breakouts above the high or below the low of the first 15-minute candle.
Customizable alert messages.
Alerts configured using alertcondition .
Dynamic Adjustments:
Adapts dynamically to timeframes of 15 minutes or lower.
Resets and recalculates at the start of each new session.
Inputs and Configurations
Market Settings:
Market Start Hour: Default is 9.
Market Start Minute: Default is 30.
Visual Settings:
Enable/disable background highlighting.
Set colors for the background, high line, low line, and mid-line.
Adjust line width (1 to 5).
Toggle the visibility of the mid-line.
Alert Settings:
Enable breakout alerts.
Set custom alert messages for high and low breakouts.
How It Works
// First 15-Minute Candle Detection
The indicator monitors the first 15-minute candle after the market opens based on the configured start time. It records the high , low , and calculates the mid-point of this candle.
// Visual Markings
Horizontal lines are drawn at the high, low, and mid-point of the first 15-minute candle, extending to the right for the rest of the session.
// Breakout Detection
The indicator checks for price breakouts above the high or below the low of the first 15-minute candle and triggers alerts if enabled.
// Dynamic Reset
The indicator resets values and deletes previous session lines at the start of each new session.
Conditions and Alerts
Breakout Conditions:
High Breakout: The closing price exceeds the high of the first 15-minute candle.
Low Breakout: The closing price falls below the low of the first 15-minute candle.
Alert Triggers: Configurable alerts notify you of breakouts in real-time.
Use Cases
Intraday Traders: Ideal for early-session momentum or reversal strategies.
Breakout Traders: Helps identify entry points when price breaks key levels.
Visual Clarity: Simplifies tracking important session levels.
Limitations
Works only on 15-minute or lower timeframes.
Requires accurate market start time configuration.
