[Coingrats] Trading strategie v1 [BETA]//=================================================================================================
THIS IS A BETA VERSION AND FREE TO USE FOR EVERYONE.
BECOME BETA TESTER, PLACE A COMMENT. FEEDBACK IS VALUED.
WHEN THE BETA PERIOD IS EXPIRED THIS SCRIPT WILL BE ADAPTED TO A FREE VERSION
FOR THE BETA TESTERS (DON'T FORGET YOUR COMMENT) THERE IS A LIFETIME OFFER FOR THE PREMIUM
I DEVELOPED THIS STRATEGY TO QUICKLY DISCOVER TREND CHANGES OR WHERE INDECISION IS PRESENT
DO NOT TRADE BLINDLY, BUT CHECK THE FINDINGS THAT YOU SEE ON THE CHART
USE WITH HOLLOW CANDLES ONLY!!!!
ALL PROCESSED IN ONE INDICATOR, ALSO WITH A FREE TRADINGVIEW ACCOUNT YOU CAN USE HIM.
FOR CONFIRMTION YOU CAN ADD THE INDICATORS RSI AND MACD
WE ARE ALSO DEVELOPING OUR OWN CRYPTORADAR THAT CAN GIVE YOU VARIOUS SIGNALS ON TELEGRAM.
CHECK THE WEBSITE MYCRYPTORADAR.COM
//=================================================================================================
//INFO DIVERGENCE STRATEGIE
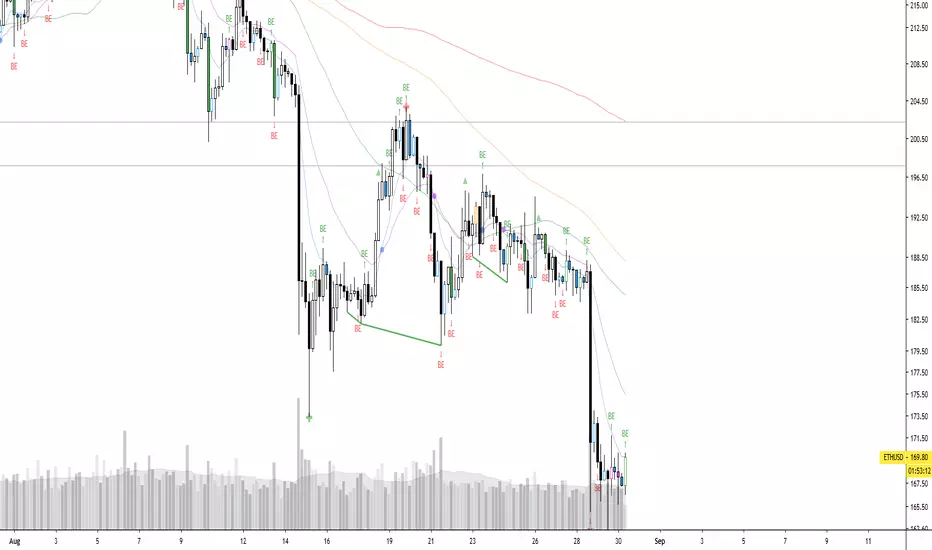
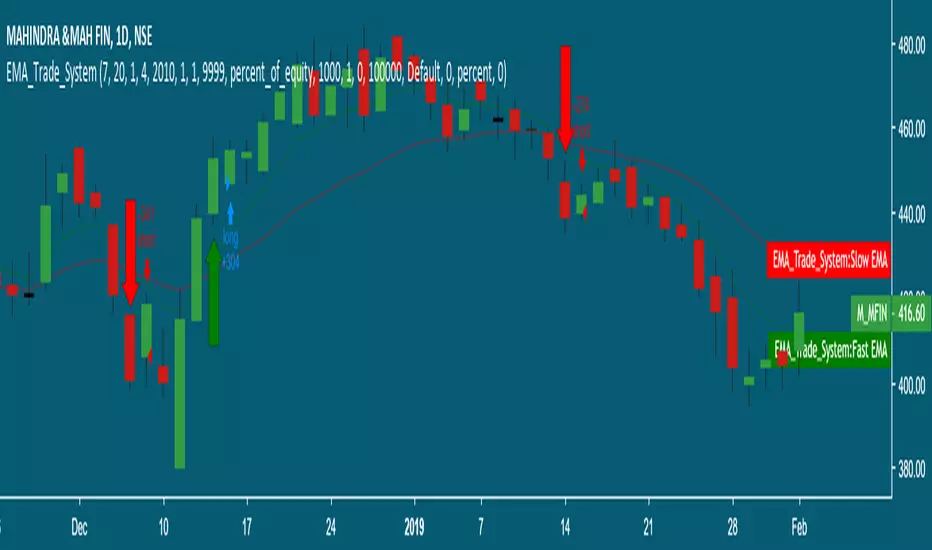
- When there is a line visible the bull(green)/bear(red) divergence is legit. Go long or short
- When there is a green triangle above a candle, take some profits on the bull divergence
- When there is a red triangle below a candle, take some profits on the bear divergence
- You can play with the settings but i think this are the best settings.
- Standard settings work best on higher timeframe (4H or higher)
//INFO PIVOT REVERSAL STRATEGIE
- When there is a green cross under a candle = possible signal to go long
- When there is a red cross above a candle = possible signal to go short
//INFO S/R LINES AND TRENDLINES
- Automatic set S/R levels on the timeframe on your chart
- In the settings you can enable trendlines on your chart
- Calculation mode = strict. You get a clean chart with major S/R lines
- Calculation mode = loose. You get a chart with more S/R lines. It helps to find orderblocks
- Top and bottom fractal source. Choose what you like for setting the S/R lines
//INFO CANDLE STRATEGIE
- Paints outside candles green
- Paints inside candles blue
- Paints highwave candles purple
- Paints morning star patterns red
- Paints evening star patterns grey
- Marked bullish engulfing with a green BE mark
- Marked bearish engulfing with a red BE mark
//INFO EMA - SMA
- You have the choice of 5x EMA and 3X SMA lines
- Including crossover alerts for all crossovers
- Standard only crossover EMA8 - EMA21, Golden cross & Death cross (SMA) signals are enabled
- Signal// EMA8 - EMA21 crossover marked a bleu/purple dot on the crossover
- Signal// Golden cross marked a golden cross on the crossover
- Signal// Death cross marked a red cross on the crossover
- In the settings you can set your own crossover alerts
Komut dosyalarını "GOLD" için ara
Directional Momentum Flux StrategyDirectional Momentum Flux (DMF) is a compound indicator designed to surface signals of projected change in directional momentum. The primary goal is to identify possible momentum inflection points and signal them before they happen, which is reached by applying a set of well-known high-level indicators (e.g. DEMA, RSIs, CCIs and VWAP), lower-level indicators (e.g. BOP, PPO and RMOMO), and some special sauce brewed in-house by yours truly.
This strategy is invite-only. Invitations are offered for a one-time fee of $250 payable in several cryptocurrencies (ETH, BTC, DASH, XMR or ZEC). Once you've got an invitation, you will automatically receive updates forever*.
DMF was designed to work across multiple asset classes. Extensive backtesting has been performed over multiple sample series (not just during the bull runs, for example) and against a randomized pool of assets. But don't take my word for it, I've included some time-based backtesting support tools to make it easy-peasy for you to validate the results yourself!
Under the hood, DMF is powered by numerous indicators, including:
✓ Double EMA & Composite SMA;
✓ Double RSI (fast & slow, variable);
✓ Composite StochRSI & VWAP (StochRSI+, two series);
✓ Composite Commodity Channel Index (CCI+, two series);
✓ Volume-Weighted Balance of Power (BOP itself was adapted from BOP_LB, kudos to LazyBear);
✓ Percentage Price Oscillator (PPO, split, two series);
✓ Range-adjusted Momentum Oscillator (RMOMO, my fancy MOM variant);
It crunches all that data and generates signals which are issued in two ways:
✓ Vertical Bands (or VBs) - Entry/Exit windows as vertical bands that remain "lit" (e.g. the background of a series of candles is semi-opaque white) while the top-level signals are showing sufficiently strong BUY signals. These windows are the primary entry/exit targets and can be relied upon with sufficient risk mitigation (e.g. a reasonable stop-loss or other scale-out exit mechanism). A VB followed immediately by an egg is as good as gold.
✓ Eggs - Entry/Exit validation signals that confirm the condition indicated by VBs. A lit VB without an egg in the same or next candle session is considered to be valid , but not safe (see above warning). Waiting for an egg can improve performance at the risk of missing the best possible entry point. Consider your risk tolerance and act accordingly.
Basic Instructions:
✓ Configure The Settings! The defaults are pretty good, but don't be scared to try variations. For example, by default SHORT positions are disabled. You might want to enable them if your risk tolerance allows them. (IMO there's gold on both ends of the rainbow. 🌈)
✓ Pay attention to the VBs. If you see a lit band being placed in an otherwise dark area, it's a projected inflection point. This is expected to be validated and confirmed in the same or immediately following period with an egg. You can enter a LONG position at this time.
✓ Pay attention to the eggs. If you see an egg, it's a confirmation that the VB changes in the same or immediately preceding candle period is valid. If you did not enter or exit your position at the point of the VB shift, now is the time to do so.
✓ Watch for the end of a VB period and be prepared to exit your position quickly as the next egg may be accompanied by a large directional momentum inflection.
Things to Note:
📉 - DMF is designed for day trading with aggressive position TTLs (15m was the upper bound during development and strategy testing). It appears to issue valid signals for other intervals, but it was not designed for >15m and YMMV. Don't go manually opening a LONG with no exit strategy and go to sleep... it probably won't work out to your benefit. You should be prepared to exit positions at any time. (Pro tip: automation is your friend!)
💸 - DMF indicator is not free from risk. As with all investment strategies, it is crucial to exercise caution and only trade with funds you are comfortable losing. DMF does not offer any form of guarantee or warranty, implied or otherwise. If you lose money, your house, your 401K... that's on you. (Pro tip: don't risk anything you're not ready to lose, because losses are part of the game and you WILL have them.)
🤔 - By using this indicator, you understand that any and all risks are the sole and complete responsibility of the end user (yeah, that's you). Don't use it if you're not 100% clear that you know exactly what you're doing. (Pro tip: always ask questions if you're feeling confused.)
⏱ - * Forever in this context means that, where room for improvement exists, I will improve it over time and you'll get all updates until I stop making them. (Pro tip: nobody lives forever.)

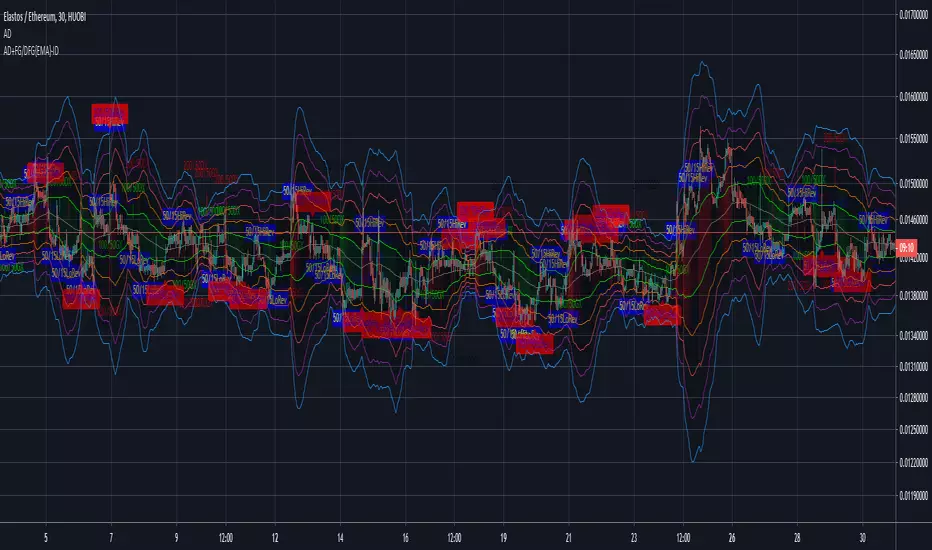
AEONDRIFT with FG & DFG {EMA} indicatorsAEONDRIFT with {EMA} implementation of FUSIONGAPS (FG) and DIFFERENTIAL FUSIONGAPS (DFG) derived indicators.
~JuniAiko
(=^~^=)v~
Check out the other analytical tools that I had published.
AEONDRIFT:

DBT MoMo v.4DBT MOMO
Introduction: The MoMo is a TradingView indicator designed to evaluate momentum and give the user signals according to momentum shifts, strength, extensions, traps, and divergence. It’s an all in one oscillator that will make reading price action near term and long term much easier.
Part One: Strength
The MoMo consist of two major parts. A 3-candle back formula and a 24-candle back formula. The 3-candle back is called the Price Line (the histogram on the MoMo). The 24-candle back is called the Trend Line (the line on the MoMo). Both lines are placed into a range from 20 to -20. It can go higher than 20 or lower than -20, but this is extremely rare and short lived.
A positive number indicates a bullish bias, a negative number indicates a bearish bias. When the Price or Trend line are ascending while below 0 this indicates that the bearish momentum is weakening. When the Price or Trend line are descending while above 0 this indicates that the bullish momentum is weakening.
In a strong trend the Trend Line will likely flatten out around 15 or -15. While the Trend Line is flat the Price Line will likely shift rapidly, this can lead to bull and bear traps, we will discuss this in the Trap section.
A rare, but powerful signal from the MoMo is when the Price and Trend Lines “pinch” and begin to move in the same direction. If this is happening the trader should be looking to follow the direction of these lines.
Part Two: Extensions
When both Price and Trend Lines are above 10 or below -10 this will begin to signal an extension.
Purple: Indicates the bears are extended to the downside and a pullback or trend reversal upward is likely.
Gold: Indicates the bulls are extended to the upside and a pullback or trend reversal downward is likely.
When only the Trend Line is above 10 the MoMo will shade the upper range red. This indicates the Trend is becoming bullish or entering an extension. If the Trend Line cannot maintain above 10 for long and breaks below 10 this indicates it’s an extension and trend will most likely continue downward.
When only the Trend Line is below -10 the MoMo will shade the upper range green. This indicates the Trend is becoming bearish or entering an extension. If the Trend Line cannot maintain below -10 for long and breaks above -10 this indicates it’s an extension and trend will most likely continue upward.
When the green or purple shading have turned off take the lowest point, this is considered a support level or a local bottom.
When the red or gold shading have turned off take the highest point, this is considered a resistance level or a local top.
The trader can preemptively trade the purple or gold warnings but be warned these warnings can go on for a long time if the trend is very strong. It is the same mentality of an overbought or oversold RSI, except the MoMo extensions have a much higher strike rate.
To avoid preemptively trading these extensions the trader should wait for confirmation on the Price Line and on price action. The Price Line (histogram) should be moving upward during a purple extension to begin showing a bottom. The Price Line (histogram) should be moving downward during the gold extension to begin showing a top.
Part Three: Traps
The relation between the Price Line and Trend Line can create trading signals for bull and bear traps. When the Trend Line is flattened out around 15 or -15, indicating a strong trend is in place, and the Price Line is rapidly moving towards the midline this may indicate a trap is forming.
When the Trend Line is flat around 15 and the Price Line begins moving towards 0, if the Price Line reaches 0 or close to 0 and the Trend Line is still flat, a trap has begone. Once the Price Line shifts from decreasing (red) to increasing (green) the trap is playing out. Therefore, the trader should look to exit short positions or enter long positions.
When the Trend Line is flat around -15 and the Price Line begins moving towards 0, if the Price Line reaches 0 or close to 0 and the Trend Line is still flat, a trap has begone. Once the Price Line shifts from increasing (green) to decreasing (red) the trap is playing out. Therefore, the trader should look to exit long positions or enter short positions.
Part Four: Divergences
The MoMo is exceptional at finding divergences with the Price Line and occasionally the Trend Line.
To find a divergence with the MoMo the trader must look for when the histogram is not following price action completely.
Bullish Divergence: Price makes a lower low, MoMo makes a higher low.
Bearish Divergence: Price makes a higher high, MoMo makes a lower high.
Hidden Bull Divergence: Price makes a higher low, MoMo makes a lower low.
Hidden Bear Divergence: Price makes a lower high, MoMo makes a higher high.
For Access or Questions: Private message us. Thank you.


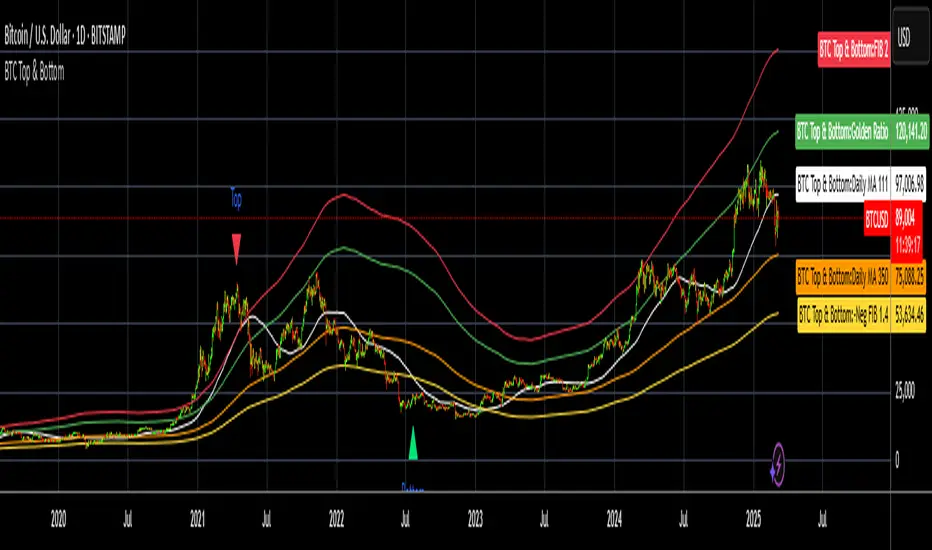
BTC Top and Bottom PickerBTC Top and Bottom Picker
This study predicts BTC tops and bottoms using Bitstamp's daily close data/
It is based on Philip Swift's The Golden Ratio Multiplier post on Medium
In a nutshell:
The top is calculated when 111 daily SMA crossing 350 daily SMA
The bottom is calculated by dividing 350 daily SMA by 1.4
If you like this, please like and share it and follow me.
4 EMA en 1 Indicador y Cruce Dorado 50:200 Luis AlvarezA disposicion de todos este humilde aporte, donde hay comparacion de las EMAS mas importantes para una vision integral del movimiento del mercado
@LuisMerida @malkarma2

Moving Average Cross PointPlot label at the GoldenCross point and DeadCross Point.
=============================
ゴールデンクロスとデッドクロスの地点に、それぞれ「GC」「DC」の吹き出しを表示します。

Ultra Trabalza EMA/MA + Crosses & Rejections
EMA/MA crosses
Bullish cross = green "^"
Bearish cross = red "x"
Golden cross (50EMA > 200EMA) = Golden circle
Death cross (50EMA < 200EMA) = Red circle
Rejections
Bullish Wick through support = Gold candle
Bearish Wick through resistance = Purple candle

SMA 20, 50, 200This Script provides the 50 and 200 day moving average to provide a way to keep track of the classic Death Cross and Golden Cross. The 20 day moving average is just used as an early prediction of what the 50 day may do so you can keep and eye on it. If you are the kind of person that freaks out at sudden changes in the graphs it is probably best to just turn the 20 day off.
A Golden Cross is when the 50 day MA raises above the 200 day MA. This indicates the start of a Bull Market. This is the best time to buy as the market commonly will increase over the next few months or even years.
A Death Cross is when the 50 day MA drops below the 200 day MA. This indicates the start of a Bear Market. This is the best time to sell as the market will commonly decrease at least 20 percent or more over the next couple months or more.
I am not a financial advisor and this is just a tool to help you make your own decisions with your investments. My information is just based on common knowledge.

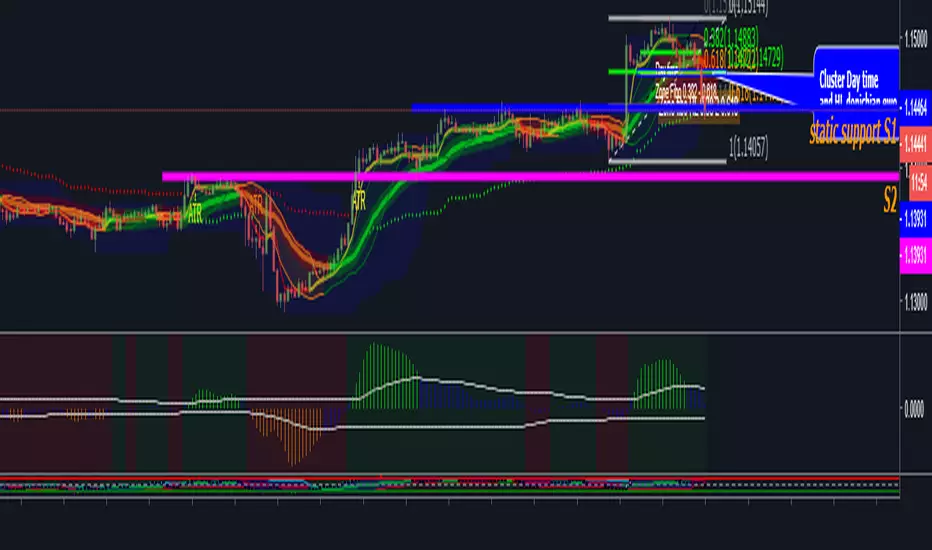
PpSignal Personal TemplateThis is my personal template strategy, I follow the tendency, with
-Donichian: I can se the high and low price.
-CFB: ha can see the trend short.
-Tigger MA: i can see the long trend.
-BB: I can see the short trend and the volatily.
-Ewo break band and Rsi Donicihan channel, the trend and oversold and overbought.
-PPSignal Scalper Double Cross Signal and EWO Smooth V4.0 for the background trend.
PpSignal Candle converter and psignal golden fibo zone.
dmw_3SMACross3 SMA set to 5 10 20 used to find the crossing points for pattern reversals or breakouts.
