Correlation Coefficient - DXY & XAUPublishing my first indicator on TradingView. Essentially a modification of the Correlation Coefficient indicator, that displays a 2 ticker symbols' correlation coefficient vs, the chart presently loaded.. You can modify the symbols, but the default uses DXY and XAU, which have been displaying strong negative correlation.
As with the built-in CC (Correlation Coefficient) indicator, readings are taken the same way:
Positive Correlation = anything above 0 | stronger as it moves up towards 1 | weaker as it moves back down towards 0
Negative Correlation = anything below 0 | stronger moving down towards -1 | weaker moving back up towards 0
This is primarily created to work with the Bitcoin weekly chart, for comparing DXY and Gold (XAU) price correlations (in advance, when possible). If you change the chart timeframe to something other than weekly, consider playing with the Length input, which is set to 35 by default where I think it best represents correlations with Bitcoin's weekly timeframe for DXY and Gold.
The intention is that you might be able to determine future direction of Bitcoin based on positive or negative correlations of Gold and/or the US Dollar Index. DXY has been making peaks and valleys prior to Bitcoin since after March 2020 black swan event, where it peaked just after instead. In the future, it may flip over again and Bitcoin may hit major highs or lows prior to DXY, again. So, keep an eye on the charts for all 3, as well as the indicator correlations.
Currently, we've moved back into negative correlation between Bitcoin and DXY, and positive correlation with Bitcoin and Gold:
Negative Correlation b/w Bitcoin and DXY - if DXY moves up, Bitcoin likely moves down, or if DXY moves down, Bitcoin likely moves up (or if Bitcoin were to move first before DXY, as it did on March 2020, instead)
Positive Correlation b/w Bitcoin and Gold - Bitcoin and Gold will likely move up or down with each other.
DXY is represented by the green histogram and label, Gold is represented by the yellow histogram and label. Again, you can modify the tickers you want to check against, and you can modify the colors for their histograms / labels.
The inspiration from came from noticing areas of same date or delayed negative correlation between Bitcoin and DXY, here is one of my most recent posts about that:
Please let me know if you have any questions, or would like to see updates to the indicator to make it easier to use or add more useful features to it.
I hope this becomes useful to you in some way. Thank you for your support!
Cheers,
dudebruhwhoa :)
"GOLD" için komut dosyalarını ara

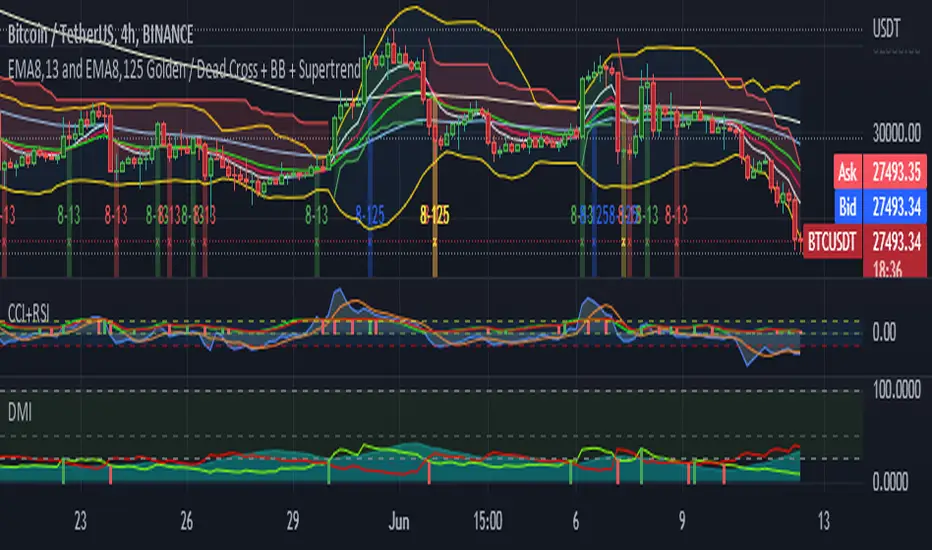
5EMA(8,13,21,55,125) w/ EMA8-13 + EMA8-125 GC/DC Signal-by TerryThis Script are Combined 5 EMAs Indicator with Golden / Death Cross EMA 8 -13 and EMA 8 - 125 within Green or Red Column Line as Default Signal. This Indicator also combined with Ballinger Band and Super Trend Channel.
If you have like this Indicator, please add to your favorite Indicator, and If You Don't, Don't be like a man without woman :) ... God Bless You All
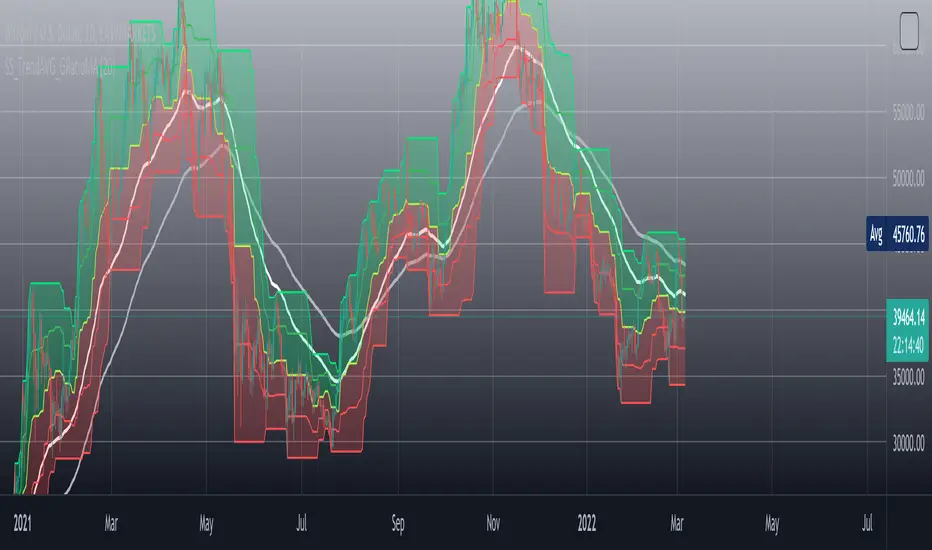
[SS]_TrendAVGZones_and_GoldenRatioMAThe _TrendAVGZones_and_GoldenRatioMA is an indicator that is composed first of a channel made of three price averages ( base average, middle lower and middle upper ) in red is the previous corrections average and in green the previous rises average. So that way we the setting of stop loss targets and price targets can be set up at first glance. It adjusts to any timeframe so no worries 'bout that.
Also I added two exponential moving averages ( white and silver lines ) on the chart which I modified their equations by multiplying as it follows :
is the simple modification I added to fine tune it's precision and after some trials and errors I finally found a perfect spot. Now I tried it with historical data of Bitcoin and when the two Golden Ratio EMA crosses there's a big move coming imminently : if the white one is on top of the silver one the trend is bullish inversely the white one finds itself under the silver line then it needs to cross to expect a reversal.
rphi = 0.6180339887498948 = is the conjugate root of the golden ratio also called the silver ratio
phi = 1.6180339887498948 = golden ratio
It should be used to find short to mid term price targets selling as well as buying ones. If you're a long term trader I suggest using trend lines analysis in combination with it.
I hope to make this indicator a community owned indicator so don't hesitate to perfect it so we can build the best tool traders can hope for ! Together we will no longer ask wen lambo? we will get it!
IF you've got any question you can always DM me
take care of yourselves you future millionaires :D
-SS
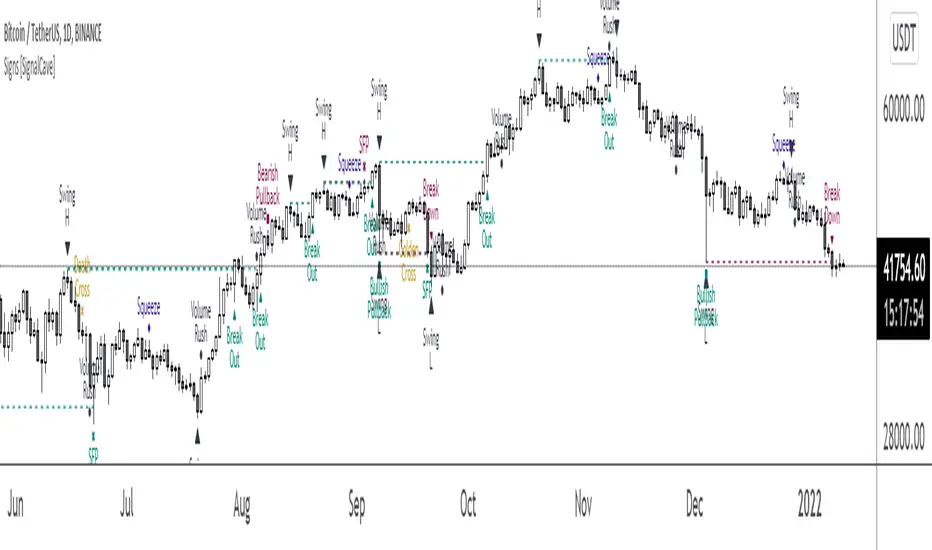
Signs [SignalCave]Swings, Engulfs, Golden & Death Crosses, Price Squeezes, Pullbacks, Breakout & Breakdowns, Volume Rushes
A swing low is when price makes a low and is immediately followed by consecutive higher lows. Likewise, a swing high is when price makes a high and is followed by consecutive lower highs.
Swing Failure Pattern (SFP) is a type of reversal pattern that can be used as buy or sell signals.
Engulfing candles tend to signal a reversal of the current trend in the market. This specific pattern involves two candles with the latter candle 'engulfing' the entire body of the candle before it.
On this indicator, bullish engulfs visible only on downtrend and oversold conditions. Bearish engulfs visible only on uptrend and overbought conditions.
The death cross and golden cross are technical analysis terms for when a moving average (MA) intersects with another from either above or below.
The cross, depending on which it is, can signal the start of a new trend or the end of one.
Squeeze signs signifies low volatility, market preparing itself for an explosive move up or down direction.
Bullish Pullbacks are widely seen as buying opportunities after an asset has experienced a large upward price movement. Most pullbacks involve an asset's price moving to an area of technical support , such as a moving average, before resuming their uptrend.
Bearish Pullbacks are widely seen as selling opportunities after an asset has experienced a large downward price movement. Most pullbacks involve an asset's price moving to an area of technical resistance , such as a moving average, before resuming their downtrend.
A breakout refers to when the price of an asset moves above a resistance area, breakdown refers to when the price of an asset moves below a support area.
Breakouts/breakdowns indicate the potential for the price to start trending in the breakout direction.
For example, a breakout to the upside from a chart pattern could indicate the price will start trending higher.
Volume rush signs appears when the trading volume increases more then a usual period. It can be useful with combining breakout signals as a confirmation.
Alerts are available for various conditions such as "Bullish/Bearish SFP, New Swing High/Low, Breakout/Breakdown, Bullish/Bearish Engulf, Golden & Death Cross, Bullish/Bearish Pullbacks, Squeeze, Volume Rush"
Type asset name on symbol search area.
Adjust your timeframe that you wish to track.
Click "Create Alert" .
Select one of the condition that you wish to get inform from create alert panel.
Select "Once Per Bar Close" option.
Click "Create" .
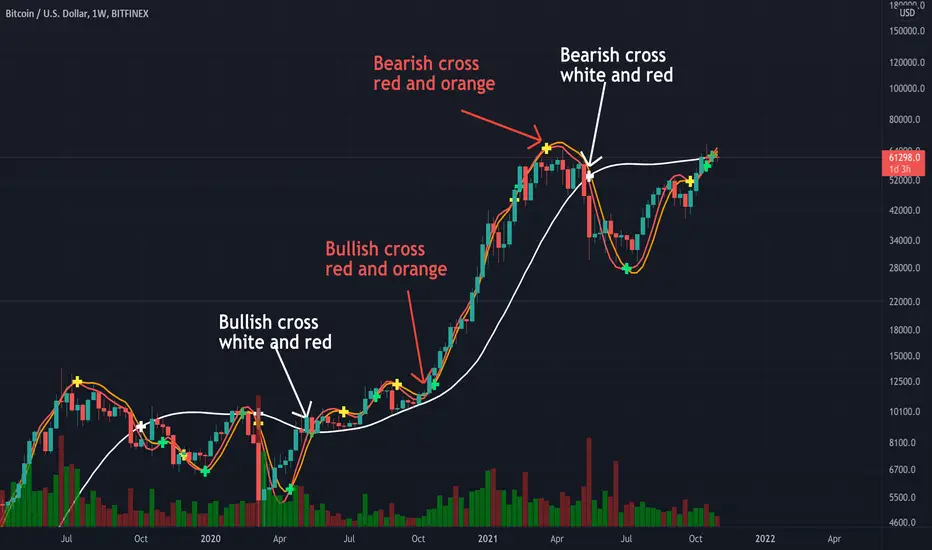
Triple Modified Hull Moving Average Cross By <Zakaria>Triple Modified Hull Moving Average Cross By
What is this?
this is a modified formula for Hull moving average, it is more accurate and predicts the golden and death cross earlier.
How to use?
Work better in high time frames (1D,1W)
the white line vs the red and the orange lines :
1 - when the white line crosses the red and the orange lines from the bottom the price will go down . Death cross!
2 - when the white line crosses the red and the orange lines from the top the price will go up . Golden Cross!
the red line vs the orange line :
1- when the orange line crosses the red line from the bottom the price will go down . Death cross!
2 - when the orange line crosses the red line from the top the price will go up . Golden Cross!
p.s: the lag between these two lines will be very small. use it in the 1W time frame to predict where exactly the bull market will end.
You can input your personalized values if you want!
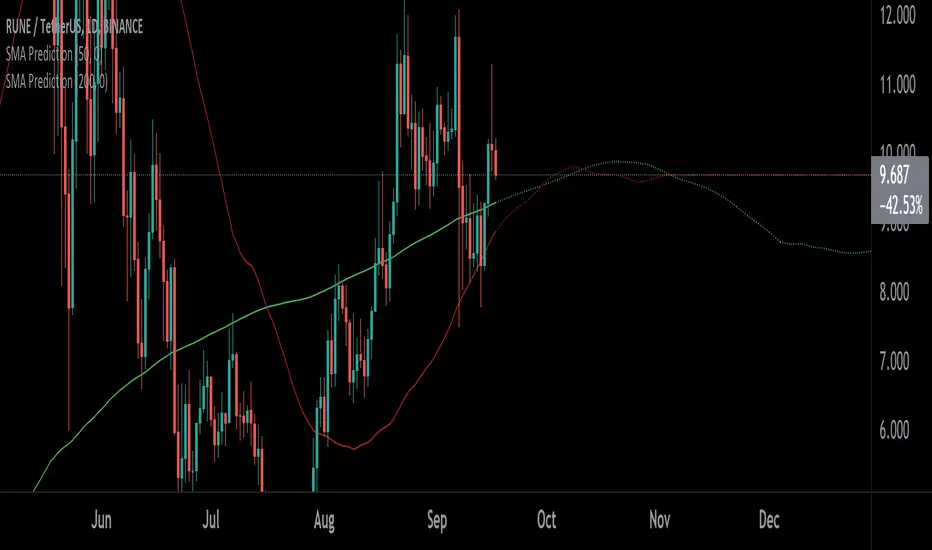
SMA PredictionThis indicator predicts future moving average (SMA) values assuming the prices remains at configured level (-50% to +50%).
It can be used to predict golden/death crosses as well - when two of these indicators are on - one configured for length 50 and one for length 200.
[blackcat] L5 Zen MasterLevel: 5
Background
L5 Zen Master is my favorite main chart indicator. I have been studying Zen Theory for long and keeping improving related home-baked private indicators. Zen Theory is less known out side of China. This situation is very similar to when Nilson did not introduce Japanese candlesticks worldwide. At that time, traders in other parts of the world rarely heard of Japanese candlesticks. This situation occurs again. When most Chinese bookstores and libraries are full of books on Zen Theory trading techniques, the rest of the world may not know this trading technique based on mathematical derivation axioms.
As for the author of the theory, he/she is as mysterious as Satoshi Nakamoto who created Bitcoin. People don't even know his/her gender, because he/she likes to call himself/herself a "woman" when he/she publishes original trading techniques on his/her blog. No one knows his/her name, only his/her nickname: "Preaching Zen in Tangles" (缠中说禅). People respectfully call him/her "Zen Master" (缠师). Zen Theory is based on geometric structures like Bill Williams' Fractals and ZigZag, but it is very host to MTF applications. In addition, there are unique insights on moving averages, this moving average technology is called Zen Kiss (缠论吻).
Function
It combine several novel indicators together but mainly focus on Zen Theory(缠论主图), including Zen Strokes (自动画笔) 和 Zen Kiss (缠论均线) Moving Averages. To Better understand the market geometry structure, I developped featured Fibonacci Space Indicator which is based on Semi-LOG and Fibonacci Time Window Indicator to help juge trend movements independently. Also, I integrated Better Volume Indicator(BVI) and Range Action Verification Index (RAVI) as well for volume and bias monitoring.
Indicator Set
Zen Stroke (Auto ZigZag, 自动画缠论笔)
Zen Kiss Moving Averages (缠论均线)
Fibonacci Space Indicator with Golden Ratios based on Semi-LOG (黄崇半对数)
Fibnacci Time Window Indicator with red/green background colors
Dynamic Fibnacci Space Arrows to indicate support and resistance immediately
Better Volume Indicator (BVI) with painted bars to juge trend strength
Range Action Verfication Index (RAVI) for large time frame for exetreme conditions warning
Inputs
BVI lookback period --> 5 as default
EnableBVIBarColors --> True as default
Show Zen Stroke --> True as default
Show Fib Space based on Semi-LOG --> True as default
Zen Fractals Lookback Period --> 377 as default
Key Signal
Zen Stroke
Yellow line section for up stroke
Blue line section for down stroke
Zen Kiss MA
Yellow MA for fast line (Cowgirl line)
Fuchsia MA for slow line (Cowboy line)
Fib Space w/ Golden Ratios
Low, 11.4%, 23.6%, 38.2%, 50%, 61.8%, 78.6%, 88.6%, High
Fib Time Window
Green background color for top indicator based on time window
Red background color for bottom indicator based on time window
Dynamic Fib Space Arrows
Green arrows for support
Red arrows for resistance
Better Volume Indicator
Yellow bar color --> low volume --> trend ends, commonly before trend reversals
Red bar color --> climax up volume --> very bullish and next bar may continue to be bullish
White bar color --> climax down volume --> very bearish and next bar may continue to be bearish
Green bar color --> churn volume --> Long and short forces play fierce games within a small price range
Fuchisia bar color --> climax churn volume --> Long and short forces play fierce games within a large price range
Range Action Verfication Index
Yellow background color for extremely negative bias, indicating bottom zone
Fuchsia background color for extremely positive bias, indiacting top zone
Pros and Cons
ONLY suitable for discretionary trading, and does NOT support automatic trading system/bots with alerts.
Intuitive and effective, the output signal is more reliable after multi-indicator resonance
Remarks
My second L5 indicator published
Closed-source
Invite-only
Redeem Fee Life Lock Guarantee
Although I take the efforts to inform the script requesters that the best way to promote trading skills is to learn from the open source scripts I released by themself and to improve their PNIE script programming skills, there are still many people asking how to obtain or pay to use BLACKCAT L4/L5 private scripts. In fact, I do not encourage people to use Tradingview Coins ( TVC ) / Cryptocurrency to redeem the right to use BLACKCAT L4/L5 scripts. However, redeeming private script usage rights through TV Coins/ Cryptocurrency may be an effective way to force more people to learn PINE script programming seriously. And then I can concentrate on answering more valuable community questions instead of being overwhelmed by L4/L5 scripting permission reqeusts.
I would like to announce a ‘Redeem Fee Lock Guarantee’ program to further simplify the L4/L5 indicator/strategy utility offering and distinguish itself from the competition. ‘Redeem Fee lock guarantee’ is one of the major initiatives by BLACKCAT as a part of overall value packaging designed to guard BLACKCAT’s followers’ against cost-overruns and operational risks usually borne by them when it comes to PINE script innovation ecosystem. The TVCs redeemed for L4/L5 a follower signs up for with BLACKCAT is their guaranteed lifetime locked in TVC Quantity/ cryptocurrency, with no special conditions, exclusions and fine print whatsoever. Based on this scheme, I can constantly refine, expand, upgrade and improve PINE script publishing to ensure the very best experiences for my followers. The 'Redeem Fee Lock Guarantee' is a step in the direction of rewarding the valuable followers. NOTE: Every L4/L5 script redeeming service is ONLY limited to TVC or Cryptocurrency ("Win$ & Donate w/ This" Addresses displayed on script page) redeeming which the 1st signed up TVC Qty/ equivalent cryptocurrency is the lifetime offered TVC Qty/ equivalent crypto.
How to subscrible this indicator?
The script subscription period only has two options of one month or one year, and its price is floating. The latest price of the script subscription is proportional to the number of likes/agrees this script has already received. Therefore, the price of subscribing to this script shows an increasing trend, and the earliest subscribers can enjoy the price of lifetime lock to this script. As the number of likes / agrees of this script increases, the subscription fee for one month and one year will also increase linearly. Whatever, the first subscription price of the use will be locked for life.
Monthly subscription and annual subscription can be done either by tradingview coins ( TVC ) or by converting into equivalent cryptocurrency at the exchange rate (1TVC=0.01USD) for redeem.
TVC payment needs to pay TVC directly in the comments under this script. Every time I authorize a new user, I will update the latest number of subscribed users and latest price for next subscription under the script comment. If there are any conflicting scenario happened to the rules and my update. My updated price based on the rule will be the final price for next subscription. The following subscribers need to pay the corresponding amount of TVC or cryptocurrency in accordance with the latest number of users and price announced by me in accordance with the rules published.
TVC redemption is the method I strongly recommend, and I hope you can complete the redemption in the comment area of this script. This is like a blockchain structure, each comment is a block, each subscription is a chain, which is conducive to open and transparent publicity and traceability to avoid unnecessary disputes.
Monthly Subscription Charges
500TVC <50 Agrees (A)
50A<850TVC<100A
100A<1000TVC<150A
150A<1350TVC<200A
200A<1500TVC<250A
250A<1850TVC<300A
300A<2000TVC<350A
350A<2350TVC<400A
400A<2500TVC<450A
450A<2850TVC<500A
500A<3000TVC<550A
550A<3350TVC<600A
600A<3500TVC<650A
650A<3850TVC<700A
700A<4000TVC<750A
750A<4350TVC<800A
800A<4500TVC<850A
850A<4850TVC<900A
900A<5000TVC<950A
950A<5350TVC<1000A
1000A<5500TVC<1050A
And so on...
Annual Subscription Charges
5000TVC <50 Agrees (A)
50A<8500TVC<100A
100A<10000TVC<150A
150A<13500TVC<200A
200A<15000TVC<250A
250A<18500TVC<300A
300A<20000TVC<300A
350A<23500TVC<400A
400A<25000TVC<450A
500A<28500TVC<550A
500A<30000TVC<550A
550A<33500TVC<600A
600A<35000TVC<650A
650A<38500TVC<700A
700A<40000TVC<750A
750A<43500TVC<800A
800A<45000TVC<850A
850A<48500TVC<900A
900A<50000TVC<950A
950A<53500TVC<1000A
1000A<55000TVC<1050A
And so on...

Crypto EMA+MA+MACS by hobbeLeThis is an indicator that includes several EMAs and MAs (Used in Cryptotrading).
In addition, the Golden and Death Cross are also displayed.
Used MAs
MA 7 - Orange Line
MA 21 - Yellow Line
MA 25 - Grey Line
MA 99 - Blue Line
MA 200 - Green Line
Used EMAs
EMA 200 - Grey Dotted Line
EMA 222 - Pink Dotted Line
Golden Cross
Crossover MA25 + MA200
Death Cross
Crossunder MA25 + MA200
What is a Moving Average (MA) ?
A moving average (MA) is a widely used indicator in technical analysis that helps smooth out price action by filtering out the “noise” from random short-term price fluctuations.
Moving average is a trend-following, or lagging, indicator because it is based on past prices. The most common applications of moving averages are:
to identify the trend direction
to determine support and resistance levels
The two basic and commonly used moving averages are the simple moving average ( SMA ), which is the arithmetic average of a security over a defined number of time periods, and the exponential moving average ( EMA ), which gives greater weight to more recent prices.
What is a Golden Cross?
The golden cross is a candlestick pattern that is a bullish signal in which a relatively short-term moving average crosses above a long-term moving average. The golden cross is a bullish breakout pattern formed from a crossover involving a security's short-term moving average (such as the 15-day moving average) breaking above its long-term moving average (such as the 50-day moving average) or resistance level. As long-term indicators carry more weight, the golden cross indicates a bull market on the horizon and is reinforced by high trading volumes.
What Is a Death Cross?
The death cross is a technical chart pattern indicating the potential for a major selloff. The death cross appears on a chart when a stock’s short-term moving average crosses below its long-term moving average.
Source; Investopedia

Ultimate Moving Averages (SMA & EMA)Welcome to the Ultimate Moving Average indicator.
Never again spend time looking for EMA / SMA indicators when you can have them all in this single indicator.
Options include :
Daily Chart: Classic Golden / Death Cross - 50/D and 200/D SMA
Daily Chart: 3-day Golden / Death Cross - 150/D and 600/D SMA
Daily Chart: 140/D SMA
Daily Chart: 700/D SMA
Daily Chart: 1458/D SMA
Daily Chart: Golden Ratio Multiplier
Any Chart: Scalping
9 SMA
10 SMA
20 SMA
21 SMA
30 SMA
34 SMA
50 SMA
80 SMA
100 SMA
200 SMA
8 EMA
10 EMA
13 EMA
20 EMA
21 EMA
26 EMA
30 EMA
34 EMA
50 EMA
55 EMA
80 EMA
89 EMA
100 EMA
200 EMA

LIVIDITIUM [BTC] {PREMIUM}The LIVIDITIUM is a set of indicators centered around a series of parallel bands call the LVDT guide bands, defined by lines call the LVDT levels. Major LVDT levels have thicker line-widths.
LVDT levels are constructed from a mathematical conjugation of the complex golden ratio solutions.
>> Useful to determine critical levels, indicates possible support levels, as well as major and minor tops/bottoms.
Look at historical interactions to work out key levels for any particular chart, and adjust the displacement offset value to get the LVDT levels to conform better to a particular chart at a particular time-frame.
Major BUY/SELL indicators for top/bottom levels were added specifically for BTCUSD and optimised for the 1D chart (disabled at lower time-frames). These are based on the interaction of the candlestick with various emas and smas as well as with the LVDT levels.
A scoring algorithm also analyses the significance of major and minor death crosses, base on the presence of other indicators in its vicinity to suggest potential local buy/sell prices, and should still work relatively well at lower time-frames.
Various triggers are also implemented, including golden/death cross indicators, as well as pivot and potential reversal points -- labelled with either text-markers, or colored vertical bands.
Signal markers that are only valid for the BTCUSD chart are automatically disabled when LIVIDITIUM is being used on other charts.
~ * ~ * ~ * ~ * ~ * ~ * ~ * ~ * ~ * ~ * ~ * ~ * ~ * ~ * ~ * ~ * ~ * ~ * ~ * ~ * ~
Note:
In no way is this intended as a financial/investment/trading advice. You are responsible for your own investment/trade decisions.
Please exercise your own judgement for your own trades base on your own risk-aversion level and goals as an investor or a trader. The use of OTHER indicators and analysis in conjunction (tailored to your own style of investing/trading) will help improve confidence of your analysis, for you to determine your own trade decisions.
Please PM me for access information.

Rhaps SMAEMA Combo v1.1There's many versions of this sort of thing around the Tradingview library, but i guess we all like things to our own specifications.
So this is my take on the SMA and EMA version combined.
Bunch of SMA's & EMA's, with labels, and G&D Cross Labels and Alerts.
These values can of course be changed to any you may prefer.
Rhapsodyy's Combo SMAEMA's v1.1
SMA's with Painted Labels : 10/30/50/80/200
EMA's with Painted Labels : 21/50/89/200/377
50SMA / 200SMA Golden & Death Crosses on Current Timeframe & Alerts
Daily 50SMA / 200SMA Golden & Death Crosses overlayed onto Current Timeframe & Alerts
50EMA / 200EMA Golden & Death Crosses on Current Timeframe & Alerts
Daily 50EMA / 200EMA Golden & Death Crosses overlayed onto Current Timeframe & Alerts

[SignalFI] IchiEMA PrimeIchiEMA Prime is a brand new type of moving average that combines several attributes from several successful trading systems.
At it's core, its provides a highly reactive Ichimoku Baseline as the centerline which is then wrapped in price bands based on ATR, standard deviations, and the golden ratio (1.618) and golden pocket (.618/6.5) ratios.
The script has been tuned for all timeframes, and creates more signals on lower timeframes, and the signals get more powerful as they are applied to higher timeframes.
This script is meant to be used within a system and in combination with the PRIME series of indicators.
SignalFI was created to help traders and investors to effectively analyze the market based on the Golden Mean Ratio (Fibonacci numbers), plan a trade and ultimately execute it. To help inform and educate market decisions we developed a set of Trading Indicators which are available on TradingView.
SignalFI indicators are just that, indicators. Our indicators are generally configured to use completely historical data (negating repaint), and we advise all alerts created with SignalFI indicators to be fired upon "close" of the current candle. Our indicators can provide valuable context and visualization support when performing market analysis and executing buy and sell decisions. However. we are not financial experts, and all information presented on this site or our other media outlets are for educational purposes only.
For subscription information, visit www.signalfi.net and follow us on twitter: @signalfi_

Trabalza Special
EMA/MA crosses
Bullish cross = green "^"
Bearish cross = red "x"
Golden cross (50EMA > 200EMA) = Golden circle
Death cross (50EMA < 200EMA) = Red circle
Rejections
Bullish Wick through support = Gold candle
Bearish Wick through resistance = Purple candle
Bull entries
1st candle to open and close above EMA/MA
marked by "*" above candle, colour co-ordinated to match moving average
Bear entries
1st candle to open and close below an EMA/MA
Marked by "!" below candle, colour co-ordinated to match moving average
Trabalza EMA/MA + crosses,rejections,entries
EMA/MA crosses
Bullish cross = green "^"
Bearish cross = red "x"
Golden cross (50EMA > 200EMA) = Golden circle
Death cross (50EMA < 200EMA) = Red circle
Rejections
Bullish Wick through support = Gold candle
Bearish Wick through resistance = Purple candle
Bull entries
1st candle to open and close above EMA/MA
marked by "*" above candle, colour co-ordinated to match moving average
Bear entries
1st candle to open and close below an EMA/MA
Marked by "!" below candle, colour co-ordinated to match moving average

Ultra Trabalza EMA/MA + crosses,rejectionsEMA/MA crosses
Bullish cross = green "^"
Bearish cross = red "x"
Golden cross (50EMA > 200EMA) = Golden circle
Death cross (50EMA < 200EMA) = Red circle
Bullish Wick through support = Gold candle
Bearish Wick through resistance = Purple candle

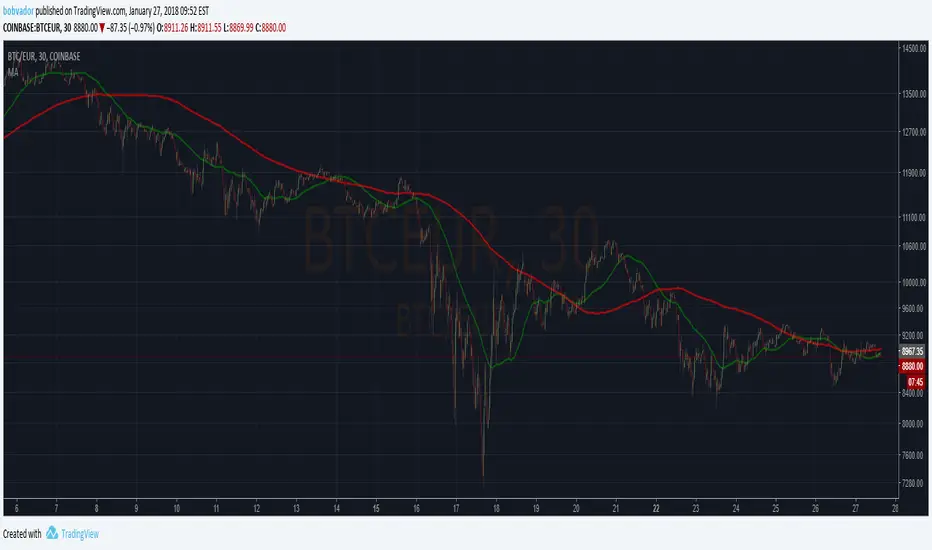
Moving AverageJust a simple script to put two MA on the same chart and find golden/death crosses.
Default on 50/200.
Williams Fractals / Goldilocks Edition / [NPR21]This indicator, Williams Fractals — Goldilocks Edition , is a high-visibility technical analysis tool designed to identify key price reversal points on your chart. It is a refined version of the classic Williams Fractal, optimized for modern dark-themed trading environments with an emphasis on clarity and precise visual anchoring.
Indicator Description
The indicator identifies local price peaks (Highs) and valleys (Lows) using a specific look-back and look-forward period. Unlike standard fractals that can be difficult to read, this version features:
Enhanced Contrast: Darkened background labels (Deep Teal for Buy, Deep Red for Sell) that make the white and yellow text highly legible.
Long "V" Stems: Integrated arrow extensions that bridge the gap between the label and the candle, pointing precisely to the pivot point to remove any ambiguity during high volatility.
Customizable Spacing: User-defined offsets that allow the labels to sit comfortably above or below price action without overlapping other indicators.
How to Use It
Identify Reversals: A BUY signal appears under a local low, suggesting a potential upward move. A SELL signal appears above a local high, suggesting a potential downward move.
Support & Resistance: Use the fractal points to draw horizontal support and resistance lines.
Trend Confirmation: Fractals are most effective when used in conjunction with other indicators (like the EMA or WMA visible in your setup) to confirm trend direction.
Wait for Confirmation: Remember that a fractal is only "confirmed" after $n$ bars have closed to the right of the signal.
Understanding the "Periods (n)" Setting
The frequency of signals is entirely dependent on your Periods (n) input.
Lower Values (e.g., n=2): The indicator will find many local pivots, resulting in more frequent signals. This is useful for scalping or lower timeframes but may lead to more "noise".
Higher Values (e.g., n=5 or 10): The indicator requires a more significant peak or valley to trigger, resulting in fewer, more significant signals. This is better for identifying major trend shifts.

Cosmic Emergence v5.1: Golden Ratio & Signal FrameworkTitle: Cosmic Emergence v5.1: Golden Ratio & Signal FrameworkDescription
Description :
The Cosmic Emergence v5.1 is a high-fidelity ontological signal system that measures the "Crystallization" of market consciousness. By utilizing a Golden Ratio-weighted engine, it translates complex volatility and momentum into a single index ($\Psi_U$) to identify phase transitions between chaos and order.
Key Features:
Golden Ratio Engine: A harmonic synthesis of Momentum (60%) and Smart Volatility (40%) to calculate the Market Consciousness Index.
Entity State Analysis: Distinguishes between "Crystallized" (Orderly/Trend) and "Chaotic" (Fluid/Range) regimes.
Future Projection Horizon: Visualizes the expected path of price realization through a dynamic future cloud.
Ontological Signals: Precise BUY/SELL labels triggered by consciousness crossovers, backed by narrative alerts.

Price vs Moving Average Cross (Golden & Death Signals)This indicator detects price crossings against multiple moving averages, not crossings between moving averages themselves.
🔹 Core Concept
A Golden Signal occurs when the price (close) crosses above a selected moving average.
A Death Signal occurs when the price (close) crosses below a selected moving average.
⚠️ This is NOT a moving-average-to-moving-average crossover indicator.
It is a price-to-moving-average crossover indicator.
📈 Moving Average Settings
The indicator uses three independent moving averages, each configurable by the user:
1️⃣ Moving Average 1 (Golden Signal)
Default: 20-period
Type: EMA or SMA
Signal:
Price crossing above MA → Golden Signal
2️⃣ Moving Average 2 (Golden Signal)
Default: 50-period
Type: EMA or SMA
Signal:
Price crossing above MA → Golden Signal
3️⃣ Moving Average 3 (Death Signal)
Default: 100-period
Type: EMA or SMA
Signal:
Price crossing below MA → Death Signal
🔔 Signal Logic
Signal Type Condition
Golden Cross 1 Close price crosses above MA 1
Golden Cross 2 Close price crosses above MA 2
Death Cross Close price crosses below MA 3
Each signal is evaluated independently.
📊 Visual Representation
Green Up Arrow → Price crosses above MA 1
Purple Up Arrow → Price crosses above MA 2
Red Down Arrow → Price crosses below MA 3
All moving averages are plotted directly on the price chart.
🎯 Practical Use Cases
Identifying trend initiation points
Confirming pullback breakouts
Acting as an entry timing assistant
Using MA 3 as a trend filter / exit warning
⚠️ Important Notes
This indicator may generate false signals in sideways or ranging markets.
Best used in combination with:
Higher-timeframe trend confirmation
Volume indicators
Support & resistance levels
🧠 Summary
✔️ Price ↔ Moving Average crossover
❌ Moving Average ↔ Moving Average crossover
This indicator is designed for trend-following traders who want clear and simple price confirmation signals.
원하시면
“True MA Golden Cross version”
Scalping-optimized version (3m / 5m)
Trend + Momentum filtered version

GMMA fill (v5) + Golden Crossover HighlightsGMMA Fill (v5) + Golden Crossover Highlights
This setup combines the Guppy Multiple Moving Average (GMMA) Fill version 5 with Golden Crossover signals to identify strong trend continuation and potential breakout points. GMMA provides layered moving averages for short- and long-term trend analysis, while the Golden Crossover highlights bullish momentum shifts, making it ideal for spotting entry opportunities in trending markets.


Global Market Scanner [Armi Goldman]Concept
This indicator is designed to provide a comprehensive "Bird's Eye View" of the global financial economy. Instead of focusing on a single chart, this dashboard allows traders to monitor capital rotation across every major asset class simultaneously. By tracking the Money Flux (daily percentage change) of these markets, users can instantly identify if the market environment is "Risk-On" (flowing into assets) or "Risk-Off" (fleeing to cash/bonds).
Features
The dashboard displays a real-time table in the top-right corner tracking 9 key sectors:
US M2 Money Supply: The broad measure of liquidity availability.
US Dollar (DXY): The global currency baseline.
Global Stocks (VT): World equities performance.
Crypto Market: Total cryptocurrency market capitalization.
Commodities: Gold, Silver, and Crude Oil (WTI).
Real Estate: Vanguard Real Estate ETF (VNQ).
Bonds: US Aggregate Bond Market.
How it Works
The script utilizes request.security() to fetch data from multiple asset classes regardless of the chart you are currently viewing.
Flux Calculation: The "Flux" column calculates the daily percentage change (Close - Open) / Open. This reveals the immediate direction of capital flow for the current session.
M2 Trend: For the Money Supply, the script calculates a 30-day rate of change to determine if the Fed is effectively "Inflating" (adding liquidity) or "Tightening" (removing liquidity).
Status Logic: The status column uses conditional logic to assign readable labels (e.g., "INFLOW" vs "OUTFLOW" or "STRONGER" vs "WEAKER") based on the positive or negative value of the Flux.
How to Use
Risk-On Signal: If Stocks, Crypto, and Real Estate show green "INFLOW" status while the Dollar (DXY) is red, capital is deploying into risk assets.
Flight to Safety: If Gold and Bonds are green while Equities are red, investors may be hedging against fear.
Cash is King: If DXY is strong (Green) and almost all other assets are red, liquidity is drying up and moving into Cash.
Liquidity Watch: Monitor the US M2 Supply. A simplified view is that when M2 is "Inflating," it provides a long-term tailwind for asset prices.
Tickers Used
Liquidity: ECONOMICS:USM2
Currency: TVC:DXY
Equities: AMEX:VT (Total World Stock ETF)
Real Estate: AMEX:VNQ (Vanguard Real Estate)
Bonds: AMEX:AGG
Commodities: TVC:GOLD, TVC:SILVER, TVC:USOIL
Crypto: CRYPTOCAP:TOTAL
Disclaimer This tool is for informational purposes only and does not constitute financial advice.

🟡 GOLD 4H HUD v12 — Time-Safe Nuclear Edition🟡 GOLD 4H HUD v12 — Time-Safe Nuclear Edition
A full–scale Smart Money Concepts (SMC) analytics engine designed exclusively for XAUUSD on the 4-Hour timeframe.
This script combines market structure, liquidity, displacement, order blocks, imbalance, volume profile, SMT divergence, and institutional behavior modeling into a single unified HUD.
Built with a time-safe architecture, all structural elements (OB/FVG/Sweep) are stored by timestamp to minimize repainting and preserve event integrity.
📌 Core Features (12 Modules + Full HUD)
1 — Market Structure Engine
Automatically detects:
HH / HL / LH / LL
BOS (Break of Structure)
MSS (Market Structure Shift)
CHOCH (Change of Character)
Real swing pivots & trend state
2 — Sweep Engine (Liquidity Grab Detection)
Identifies institutional liquidity grabs:
Break + reclaim of highs/lows
ATR-filtered invalidation
Displacement-backed sweeps
3 — Time-Safe FVG Engine
Detects Bullish/Bearish Fair Value Gaps
ATR-tolerant FVG logic
Automatic right-extension
Auto-delete when filled or invalid
4 — Time-Safe Order Block Engine
Demand & Supply OB detection
Strength classification (Weak vs Strong)
FVG-overlap confirmation
Timestamp-locked (non-repainting)
5 — Volume Profile Engine (HVN / LVN / POC)
Real-time micro-profile:
High Volume Node (HVN)
Low Volume Node (LVN)
Point of Control (POC)
6 — SMT Engine (Gold vs DXY Divergence)
Smart Money Divergence built-in:
Bullish SMT
Bearish SMT
Directional confirmation with zero lag
7 — Displacement Engine
Measures institutional impulse:
Body-based impulse detection
Multi-leg continuation signals
FVG continuation moves
Generates displacement score
8 — Premium / Discount Model
Auto-classifies price into:
Discount (Buy zone)
Premium (Sell zone)
9 — SMC Trend Engine (Score-Based)
Combines 10+ factors:
Structure
FVG
OB power
Displacement
POC positioning
SMT conditions
Outputs:
BULL / BEAR / RANGE
Full scoring system
10 — Institutional Imbalance Model (IMB Engine)
Combines:
PD zones
Sweep direction
Displacement
SMT
OB strength
CHOCH/MSS
A complete institutional bias filter.
11 — Entry Engine (Signal Fusion Model)
Entry conditions fuse:
Sweep
CHOCH
Displacement
OB strength
FVG alignment
SMT confirmation
Also outputs:
Suggested SL/TP
Entry score
12 — Trendline Engine
Auto-draws:
HL → HL bullish trendlines
LH → LH bearish trendlines
+ Full Nuclear HUD
Displays:
Market structure
Trend direction
SMT / CHOCH / MSS
FVG / OB zones
HVN / LVN / POC
Liquidity strength
Entry model
Liquidity Magnet direction
SL/TP map
A complete institutional dashboard in one place.
⚠ Usage Requirement
This script is designed ONLY for the 4H timeframe.
✨ Summary
GOLD 4H HUD v12 — Time-Safe Nuclear Edition
is not just an indicator.
It is a full institutional-grade SMC analysis system, built specifically for Gold.
If you trade XAUUSD on the 4H timeframe —
this is your complete market intelligence HUD
