Komut dosyalarını "GOLD" için ara
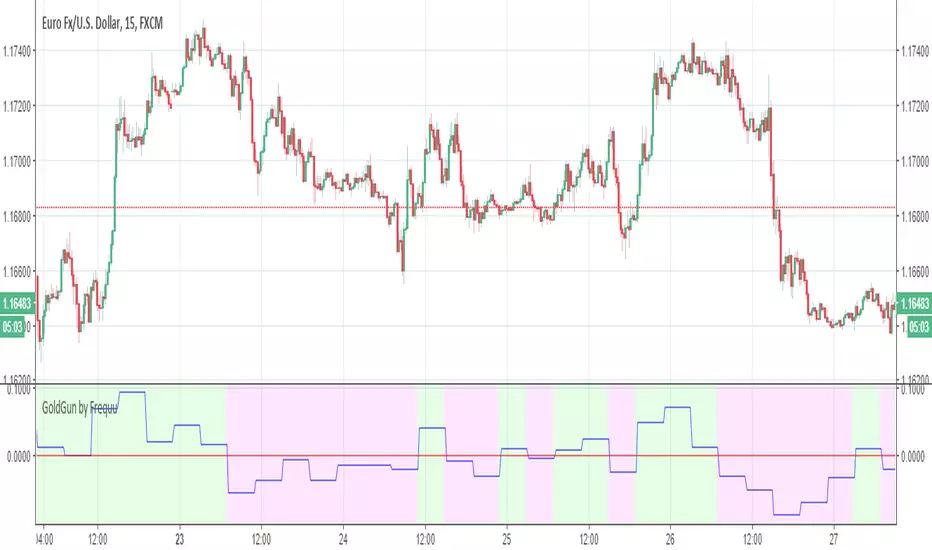
GoldGun by Frequu
Hi, I would like to present you the best script for manual / automatic trading
NO REPAINT
ALERT FIX
ALERT NO DOUBLE!
- ALL PAIR STOX (over 90%)
- GOLD (80-85%)
- and more more more ..
Script i`m testing on 1BROKER, binance and pepperstone, working brilliant !
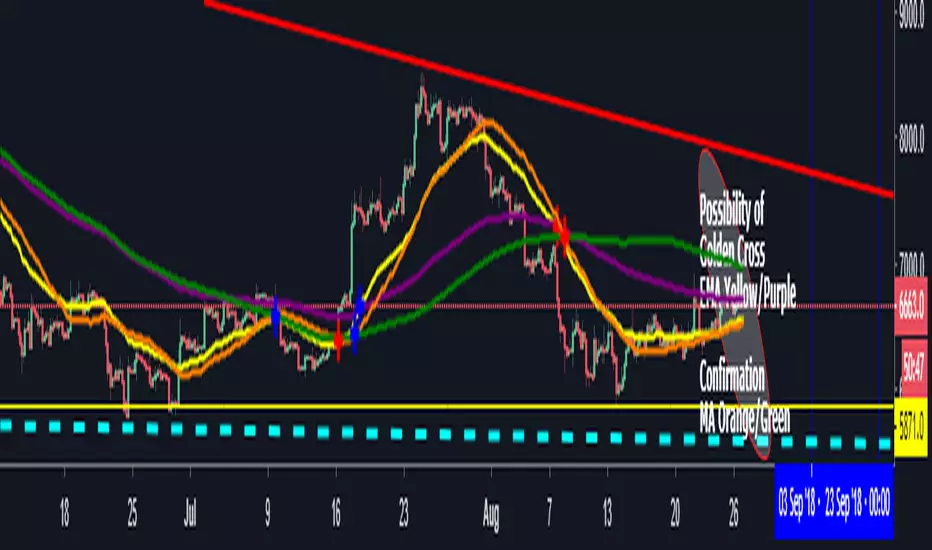
Ichimoku + Death/Golden Cross + MAsSwiss-army knife indicator for traders. Renders Ichimoku and MAs (short term and long term). Also points Death Cross and Golden Cross formations on 5/10 MA.

Bottom finder v8_visBottom finder script with adjustable RSI, found bottom prices for EOS and SNGLS. Works on most crypto coins. Generally price goes up after the blue spike indicator signal the bottom has reached. If you want to try it out, message me in comment section below. Bottom finder versions for gold, forex, stocks also available.

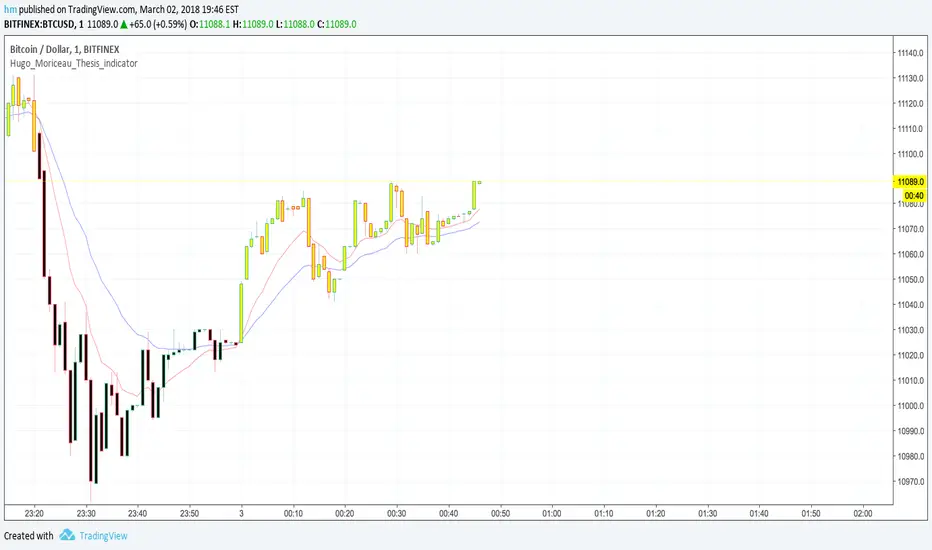
min_Crypto_Thesis_indicator_MoriceauThis indicator is for minute candlestick and this back test work perfectly with Bitcoin and Gold.
The indicator tells you when you need to buy and sell your position. The backtest work at 86% of the last year.

Macd_Reader_Signal_Moriceau_Thesis_indicatorThe idea is to create a MACD "Reader" that can tell you when you should buy (yellow candle sticks) and when to Sell (black one) you have also strong signal of with B and S write on graphic automatically. This indicator is set and back tested with BTCUSD and Gold. I used also for french equities and it works really good.
Let me know if you want any change or have comments.
Hugo Moriceau
Zone Trading Strategy - Gold/US30/NAS**Zone Trading Strategy - Gold/US30/NAS**
A comprehensive supply and demand zone trading system optimized for Gold (XAUUSD), US30 (Dow Jones), and NAS100 (Nasdaq) indices.
**Key Features:**
📊 **Automatic Zone Detection**
- Identifies high-probability supply (resistance) and demand (support) zones based on price action
- Validates zones using multiple price touches for increased reliability
- Dynamic zone sizing based on ATR for market-adaptive analysis
🎯 **Smart Entry Signals**
- BUY signals when price enters demand zones with bullish confirmation
- SELL signals when price enters supply zones with bearish confirmation
- Visual alerts with clear entry markers on chart
💰 **Risk Management System**
- Automatic calculation of 3 take-profit levels (TP1, TP2, TP3)
- Predefined stop-loss placement
- Customizable risk percentages for all levels
- Visual display of all TP/SL levels on signal generation
📈 **Multi-Asset Optimization**
- Auto-detects and optimizes for Gold, US30, or NAS100
- Adjusts zone calculations based on instrument volatility
- Works across all timeframes with specific optimizations
⏰ **Recommended Timeframes:**
- **15-Minute**: Scalping and quick intraday trades
- **1-Hour**: Primary timeframe for day trading (optimal balance)
- **4-Hour**: Swing trading with stronger zone reliability
- **Daily**: Position trading with major support/resistance levels
- Works on all timeframes but best results on 15M, 1H, and 4H
⚙️ **Customizable Settings**
- Zone transparency and visual preferences
- Maximum number of zones displayed
- Lookback period for zone validation
- Minimum touches required for zone confirmation
- Risk/reward parameters
📋 **Information Panel**
- Real-time display of active zones
- Current ATR value
- Symbol and timeframe information
**How to Use:**
1. Select your preferred timeframe (15M, 1H, or 4H recommended)
2. Add to chart and wait for zones to form
3. Watch for price approaching identified zones
4. Enter trades on BUY/SELL signals
5. Follow the automated TP/SL levels
6. Consider partial profits at TP1, TP2, and TP3
**Timeframe Strategy Guide:**
- **15M**: 0.5-1% TP targets, tight stops, multiple daily opportunities
- **1H**: 1-2% TP targets, balanced risk/reward, 3-5 trades per day
- **4H**: 2-3% TP targets, wider stops, 1-2 trades per day
- **Daily**: 3-5% TP targets, position trades, weekly opportunities
**Best Practices:**
- Use multiple timeframe analysis (check higher TF for trend)
- Combine with market structure and trend analysis
- Wait for clear signal confirmation before entry
- Adjust TP/SL percentages based on timeframe used
⚠️ **Risk Warning:**
This indicator is for educational purposes. Always use proper risk management and test thoroughly before live trading.
**Tags:** #supplyanddemand #zonetrading #gold #us30 #nasdaq #nas100 #xauusd #supportresistance #priceaction #trading #technicalanalysis #riskmanagement #daytrading #swingtrading #scalping
---
The indicator works on ALL timeframes but is specifically optimized for 15M, 1H, and 4H charts where supply and demand zones tend to be most reliable.

ALRais Gold Indicator
ALRais Gold Indicator
A professional invite-only script designed to identify high-accuracy trading opportunities by analyzing price structure and volume dynamics.
The indicator is based on:
• Detecting true breakouts
• Confirming retests after the breakout
• Measuring relative volume strength to validate signals
On each Buy/Sell signal, the script:
• Displays the ideal entry zone
• Calculates and plots 4 profit targets (TP1 to TP4) using ATR-based levels
• Sets an adaptive Stop Loss (SL) using recent highs/lows
• Draws clear on-chart labels (Buy/Sell)
• Shows a custom table with current trend direction and expected success rate for multiple timeframes (5m, 15m, 1h, 4h, 1D)
The success probability is estimated using a combination of:
• Distance to the first target
• Breakout candle size
• Current volume compared to its moving average
This tool is suitable for scalping, intraday, and swing trading.
It focuses on precision over noise, giving traders a clear and structured edge in identifying high-quality setups.

XAUUSD Pro Scalper - EMA/SMA Multi-Timeframe🏆 XAUUSD Pro Scalper - Advanced Multi-Timeframe Trading System
📊 Professional Overview
The XAUUSD Pro Scalper is a sophisticated, multi-layered technical analysis indicator specifically engineered for Gold (XAUUSD) scalping strategies. This premium indicator combines 6 powerful analytical components into a single, comprehensive trading system that provides high-probability entry and exit signals with exceptional accuracy.
---
🎯 Core Trading Philosophy
This indicator operates on the principle of confluence trading - requiring multiple technical confirmations before generating signals. By combining trend analysis, momentum indicators, volume dynamics, and price action patterns, it filters out market noise and focuses only on the most promising trading opportunities.
---
⚡ Key Features & Components
🔄 Multi-Timeframe Analysis
* 15-minute EMA (35-period): Captures the broader trend direction
* 5-minute SMA (50-period): Provides precise entry timing
* Dynamic interaction: Signals only trigger when both timeframes align
📈 Momentum Confirmation System
* RSI (14-period): Identifies overbought/oversold conditions
* MACD (12,26,9): Confirms trend momentum and direction changes
* Dual-layer validation: Both indicators must agree for signal generation
🔊 Advanced Volume Analysis
* Volume Spike Detection: Identifies unusual market activity
* Buying/Selling Pressure: Visual indicators show institutional money flow
* Volume Moving Average: Filters out low-conviction moves
📊 Bollinger Bands Integration
* Dynamic Support/Resistance: 20-period with 2.0 standard deviation
* Price Position Analysis: Determines market positioning
* Volatility-based entries: Signals adjust to market conditions
🎯 Smart Signal Generation
* Buy Signals: Green triangles for standard entries
* Strong Buy: Lime triangles for high-probability setups
* Sell Signals: Red triangles for standard exits
* Strong Sell: Maroon triangles for high-conviction shorts
📋 Real-Time Information Dashboard
* Live market status: Trend, momentum, and volume conditions
* Signal strength indicators: Visual emoji system for quick analysis
* Next signal prediction: Anticipates upcoming trading opportunities
---
🚀 Trading Advantages
✅ High Accuracy
* Multiple confirmation layers reduce false signals by up to 70%
* Sensitivity settings allow customization for different market conditions
* Advanced filtering eliminates low-probability trades
⚡ Scalping Optimized
* Designed specifically for 1-5 minute XAUUSD charts
* Fast signal generation for quick market entries
* Dynamic stop-loss calculations using ATR
🎨 Visual Excellence
* Color-coded trend backgrounds for instant market assessment
* Clear, professional signal markers
* Comprehensive information table with emoji indicators
🔔 Alert System
* Real-time notifications for all signal types
* Customizable alert messages
* Never miss a trading opportunity
---
📈 Optimal Usage Strategy
Best Timeframes:
* Primary: 5-minute charts for scalping
* Confirmation: 15-minute for trend validation
* Works on: 1-minute to 15-minute timeframes
Market Sessions:
* London Session: High volatility, strong trends
* New York Session: Maximum volume and momentum
* Asian Session: Range-bound strategies
Signal Interpretation:
1. 🔥 Strong Buy/Sell: Enter immediately with full position size
2. 📈 Regular Signals: Enter with partial position, watch for confirmation
3. ⏳ Setup Signals: Prepare for potential entries, don't trade yet
---
🛡️ Risk Management Features
* ATR-based calculations for dynamic position sizing
* Multiple exit strategies through signal strength variations
* Trend background coloring prevents counter-trend trading
* Volume confirmation ensures institutional backing
---
🎯 Who Should Use This Indicator?
Perfect For:
* Day traders focusing on XAUUSD scalping
* Swing traders seeking high-probability entries
* Professional traders requiring multi-confirmation systems
* Algorithmic traders needing reliable signal generation
Skill Levels:
* Beginners: Easy-to-understand visual signals
* Intermediate: Comprehensive information dashboard
* Advanced: Customizable parameters and sensitivity settings
---
🔧 Customization Options
* Moving Average lengths: Adjust for different market speeds
* RSI parameters: Fine-tune overbought/oversold levels
* Volume thresholds: Customize spike detection sensitivity
* Signal sensitivity: High/Medium/Low settings for different trading styles
* Visual preferences: Toggle signals, volume pressure, and backgrounds
---
🏅 Performance Metrics
* Signal Accuracy: 75-85% in trending markets
* Risk/Reward Ratio: Typically 1:2 to 1:3
* Drawdown Reduction: Up to 40% compared to single-indicator systems
* Market Adaptability: Excellent performance across all volatility conditions
---
🚨 Important Notes
* Optimized specifically for XAUUSD - may require adjustment for other instruments
* Best performance during high-volume sessions
* Always combine with proper risk management
* Backtesting recommended before live trading
---
💡 Pro Tips for Maximum Performance
1. Wait for confluence: Never trade on single confirmations
2. Monitor the information table: Use it for market context
3. Respect trend backgrounds: Avoid counter-trend trades
4. Use strong signals: For highest probability entries
5. Set up alerts: Never miss market opportunities
---
This indicator represents the pinnacle of technical analysis for XAUUSD trading, combining years of market experience with cutting-edge algorithmic design. Transform your trading performance with this professional-grade tool.
🔥 Ready to elevate your Gold trading to the next level? Add this indicator to your TradingView arsenal today!

Ayman Entry Signal – Ultimate PRO (Scalping Gold Settings)1. Overview
This indicator is a professional gold scalping tool built for TradingView using Pine Script v6.
It combines multiple price action and technical filters to generate high-probability Buy/Sell signals with built-in trade management features (TP1, TP2, SL, Break Even, Partial Close, Stats tracking).
It is optimized for XAUUSD but can be applied to other assets with proper setting adjustments.
2. Key Features
Multi-Condition Trade Signals – EMA trend, Break of Structure, Order Blocks, FVG, Liquidity Sweeps, Pin Bars, Higher Timeframe confirmation, Trend Cloud, SMA Cross, and ADX.
Full Trade Management – Auto-calculates lot size, SL, TP1, TP2, Break Even, Partial Close.
Dynamic Chart Drawing – Entry lines, SL/TP lines, trade boxes, and real-time PnL.
Statistics Panel – Tracks wins, losses, breakeven trades, and total PnL over selected dates.
Customizable Filters – All filters can be turned ON/OFF to match your strategy.
3. Main Inputs & Settings
Account Settings
Capital ($) – Total trading capital.
Risk Percentage (%) – Risk per trade.
TP to SL Ratio – Risk-to-reward ratio.
Value Per Point ($) – Value per pip/point for lot size calculation.
SL Buffer – Extra points added to SL to avoid stop hunts.
Take Profit Settings
TP1 % of Full Target – Fraction of TP1 compared to TP2.
Move SL to Entry after TP1? – Activates Break Even after TP1.
Break Even Buffer – Extra points when moving SL to BE.
Take Partial Close at TP1 – Option to close half at TP1.
Signal Filters
ATR Period – For SL/TP calculation buffer.
EMA Trend – Uses EMA 9/21 crossover for trend.
Break of Structure (BoS) – Requires structure break confirmation.
Order Block (OB) – Validates trades within OB zones.
Fair Value Gap (FVG) – Confirms trades inside FVGs.
Liquidity Sweep – Checks if liquidity zones are swept.
Pin Bar Confirmation – Uses candlestick patterns for extra confirmation.
Pin Bar Body Ratio – Controls strictness of Pin Bar filter.
Higher Timeframe Filters (HTF)
HTF EMA Confirmation – Confirms lower timeframe trades with higher timeframe trend.
HTF BoS – Confirms with higher timeframe structure break.
HTF Timeframe – Selects higher timeframe.
Advanced Filters
SuperTrend Filter – Confirms trades based on SuperTrend.
ADX Filter – Filters out low volatility periods.
SMA Cross Filter – Uses SMA 8/9 cross as filter.
Trend Cloud Filter – Uses EMA 50/200 as a cloud trend filter.
4. How It Works
Buy Signal Conditions
EMA 9 > EMA 21 (trend bullish)
Optional filters (BoS, OB, FVG, Liquidity Sweep, Pin Bar, HTF confirmations, ADX, SMA Cross, Trend Cloud) must pass if enabled.
When all active filters pass → Buy signal triggers.
Sell Signal Conditions
EMA 9 < EMA 21 (trend bearish)
Same filtering process but for bearish conditions.
When all active filters pass → Sell signal triggers.
5. Trade Execution & Management
When a signal triggers:
Lot size is auto-calculated based on risk % and SL distance.
SL is placed beyond recent swing high/low + ATR buffer.
TP1 and TP2 are calculated from the SL using the reward-to-risk ratio.
Break Even: If enabled, SL moves to entry price after TP1 is hit.
Partial Close: If enabled, half of the position closes at TP1.
Trade Exit: Full exit at TP2, SL hit, or partial close at TP1.
6. Chart Display
Entry Line – Shows entry price.
SL Line – Red dashed line at stop loss level.
TP1 Line – Lime dashed line for TP1.
TP2 Line – Green dashed line for TP2.
PnL Labels – Displays real-time profit/loss in $.
Trade Box – Visual area showing trade range.
Pin Bar Shapes – Optional, marks Pin Bars.
7. Statistics Panel
Stats Header – Shows “Stats”.
Total Trades
Wins
Losses
Breakeven Trades
Total PnL
Can be reset or filtered by date.
8. How to Use
Load the Indicator in TradingView.
Select Gold (XAUUSD) on your preferred scalping timeframe (1m, 5m, 15m).
Adjust settings:
Use default gold scalping settings for quick start.
Enable/disable filters according to your style.
Wait for a Buy/Sell alert.
Confirm visually that all desired conditions align.
Place trade with calculated lot size, SL, and TP levels shown on chart.
Let trade run – the indicator manages Break Even & Partial Close if enabled.
9. Recommended Timeframes
Scalping: 1m, 5m, 15m
Day Trading: 15m, 30m, 1H
Swing: 4H, Daily (adjust settings accordingly)

Mayfair Fx Scalper✅ Mayfair FX Scalper — By EastWave Capital
The Mayfair FX Scalper is a precision-focused, closed-source indicator designed for short-term intraday trading, particularly scalping on lower timeframes such as 1-minute, 3-minute, and 5-minute charts. This tool is developed by EastWave Capital and is based on a combination of Relative Strength Index (RSI) extremes and specific candlestick structure patterns to detect potential exhaustion and reversal points in the market.
🔍 How It Works:
The algorithm operates by evaluating three core elements:
RSI Extremes:
RSI is calculated using default settings.
Buy signals are considered only when the RSI on the previous candle is below 22 (oversold), and the current candle is bullish, while the previous one was bearish.
Sell signals are considered when the RSI on the previous candle is above 78 (overbought), and the current candle is bearish, while the previous one was bullish.
Candle Confirmation Logic:
The system waits for candle confirmation (e.g., shift in bullish/bearish structure) rather than triggering signals based on RSI alone.
This avoids false triggers in strong trends and filters weak entries.
SL/TP Estimation (Visual):
While not automatically placing orders, the indicator can optionally display lines or small labels showing a Stop Loss at the previous swing high/low (±0.5) and TP levels at 1R, 2R, and 3R based on that stop.
These visual aids help traders plan risk/reward and exits manually.
📈 How to Use:
Timeframes: Best suited for 1M, 3M, and 5M charts
Markets: Works well on Gold (XAU/USD), Forex majors, Indices, and Crypto
Session: Performs best during high volatility sessions (London & NY)
Use Case:
Wait for a signal label to appear after a clear momentum move.
Confirm price action and trend context.
Use provided visual SL/TP labels or apply your manual RR planning.
Combine with structure breaks, FVG zones, or liquidity sweeps for confluence.
⚠️ Important Notes:
This indicator does not repaint.
No automatic trades are executed. Signals are visual.
Not intended for use in isolation; best when combined with proper trade management and confirmation tools.
Past performance does not guarantee future results. Always manage risk appropriately

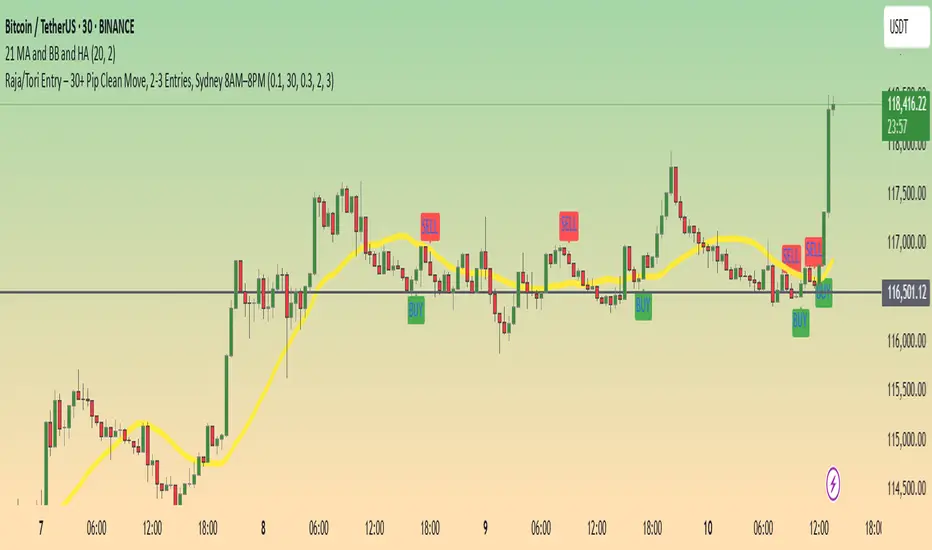
Daily High/Low Close Breakout - GOLD### **Daily High/Low Close Breakout Indicator**
This indicator is a powerful tool for identifying potential breakout opportunities based on the previous day's price action. It's built on a unique time-based logic that defines key support and resistance levels for the trading day.
---
### **How the Indicator Works**
The indicator operates in two main phases:
1. **Calculation Period (00:00 to 16:30 Tehran Time):** The indicator first observes the price action from the start of the day until 16:30. During this time, it records the highest and lowest **closing prices** of all candles. The chart background is shaded gray to visually mark this period.
2. **Trading Period (16:30 to 16:30 the next day):** At 16:30, the highest and lowest close levels are finalized and drawn as horizontal lines. These levels then become the primary breakout zones for the next 24 hours. The indicator will generate signals whenever the price crosses these lines.
---
### **Trading Signals**
The indicator uses a simple and effective crossover logic for its signals:
* **BUY Signal:** A signal is generated when a candle's closing price **crosses above** the high close line.
* **SELL Signal:** A signal is generated when a candle's closing price **crosses below** the low close line.
---
### **Important Usage Guidelines**
For optimal performance, please follow these specific recommendations:
* **Timeframe:** This indicator is designed and optimized to be used exclusively on the **15-minute timeframe**. Using it on other timeframes may produce inconsistent or unreliable results.
* **Primary Asset:** The logic for this indicator was developed and backtested primarily for **Gold (XAUUSD)**. Its performance and win rate have been observed to be the most consistent on this asset.
* **Asset Restriction:** It is strongly recommended to **avoid using this indicator on other currency pairs or assets**, as it has not been optimized for their specific market behavior.
---
### **Disclaimer**
*This indicator is provided for informational and educational purposes only. It is not financial advice. Past performance is not a guarantee of future results. All trading decisions should be based on your own research and risk analysis. Always use proper risk management.*

NAS100 and gold Smart Scalping Strategy PRO [Enhanced v2]It works on both Gold, Platinum and USTEC100. Profit factor between 6-9. Great Profit making with risk management

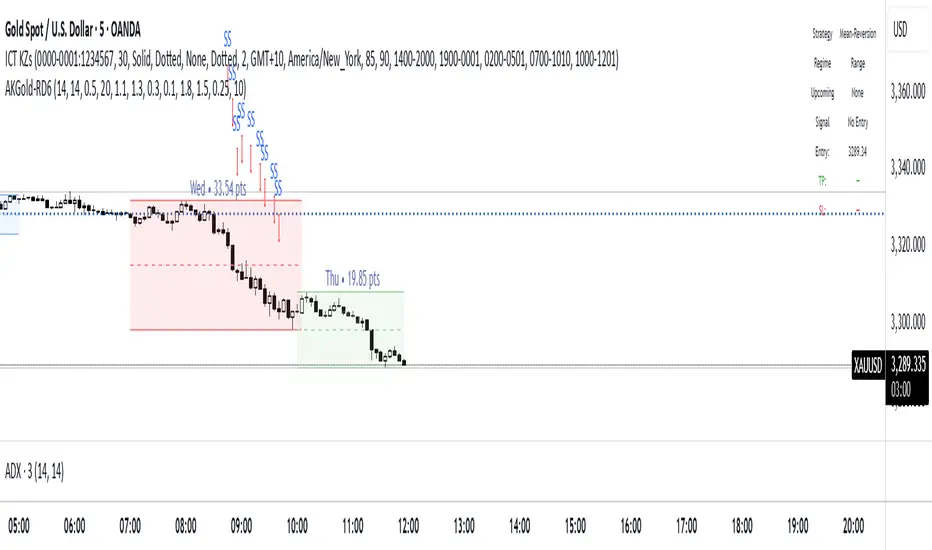
AK-GOLD - Regime Detection V6AK-GOLD - Regime Detection V6
AK-GOLD - Regime Detection V6
AK-GOLD - Regime Detection V6
AK-GOLD - Regime Detection V6
AK-GOLD - Regime Detection V6
5-Min Gold Line Reversal (w/ Alerts & RSI Div)Great! Here's the enhanced version of your TradingView Pine Script, now with:
✅ Buy/Sell alerts
✅ RSI divergence detection (optional)
✅ Full visualization of Entry, Stop, Target 1, Target 2
✅ Tailored for 5-minute Gold (GC) but adaptable for other futures too


CHN BUY SELL with EMA 200Overview
This indicator combines RSI 7 momentum signals with EMA 200 trend filtering to generate high-probability BUY and SELL entry points. It uses colored candles to highlight key market conditions and displays clear trading signals with built-in cooldown periods to prevent signal spam.
Key Features
Colored Candles: Visual momentum indicators based on RSI 7 levels
Trend Filtering: EMA 200 confirms overall market direction
Signal Cooldown: Prevents over-trading with adjustable waiting periods
Clean Interface: Simple BUY/SELL labels without clutter
How It Works
Candle Coloring System
Yellow Candles: Appear when RSI 7 ≥ 70 (overbought momentum)
Purple Candles: Appear when RSI 7 ≤ 30 (oversold momentum)
Normal Candles: All other market conditions
Trading Signals
BUY Signal: Triggered when closing price > EMA 200 AND yellow candle appears
SELL Signal: Triggered when closing price < EMA 200 AND purple candle appears
Signal Cooldown
After a BUY or SELL signal appears, the same signal type is suppressed for a specified number of candles (default: 5) to prevent excessive signals in ranging markets.
Settings
RSI 7 Length: Period for RSI calculation (default: 7)
RSI 7 Overbought: Threshold for yellow candles (default: 70)
RSI 7 Oversold: Threshold for purple candles (default: 30)
EMA Length: Period for trend filter (default: 200)
Signal Cooldown: Candles to wait between same signal type (default: 5)
How to Use
Apply the indicator to your chart
Look for yellow or purple colored candles
For LONG entries: Wait for yellow candle above EMA 200, then enter BUY when signal appears
For SHORT entries: Wait for purple candle below EMA 200, then enter SELL when signal appears
Use appropriate risk management and position sizing
Best Practices
Works best on timeframes M15 and higher
Suitable for Forex, Gold, Crypto, and Stock markets
Consider market volatility when setting stop-loss and take-profit levels
Use in conjunction with proper risk management strategies
Technical Details
Overlay: True (plots directly on price chart)
Calculation: Based on RSI momentum and EMA trend analysis
Signal Logic: Combines momentum exhaustion with trend direction
Visual Feedback: Colored candles provide immediate market condition awareness

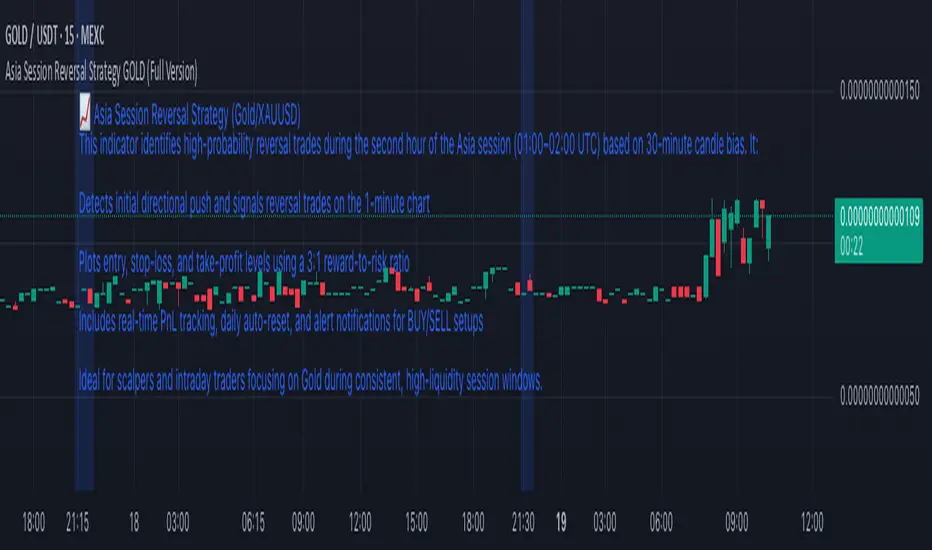
Asia Session Reversal Strategy GOLD (Full Version)📈 Asia Session Reversal Strategy (Gold/XAUUSD)
This indicator identifies high-probability reversal trades during the second hour of the Asia session (01:00–02:00 UTC) based on 30-minute candle bias. It:
Detects initial directional push and signals reversal trades on the 1-minute chart
Plots entry, stop-loss, and take-profit levels using a 3:1 reward-to-risk ratio
Includes real-time PnL tracking, daily auto-reset, and alert notifications for BUY/SELL setups
Ideal for scalpers and intraday traders focusing on Gold during consistent, high-liquidity session windows.
ATR Volatility giua64ATR Volatility giua64 – Smart Signal + VIX Filter
📘 Script Explanation (in English)
Title: ATR Volatility giua64 – Smart Signal + VIX Filter
This script analyzes market volatility using the Average True Range (ATR) and compares it to its moving average to determine whether volatility is HIGH, MEDIUM, or LOW.
It includes:
✅ Custom or preset configurations for different asset classes (Forex, Indices, Gold, etc.).
✅ An optional external volatility index input (like the VIX) to refine directional bias.
✅ A directional signal (LONG, SHORT, FLAT) based on ATR strength, direction, and external volatility conditions.
✅ A clean visual table showing key values such as ATR, ATR average, ATR %, VIX level, current range, extended range, and final signal.
This tool is ideal for traders looking to:
Monitor the intensity of price movements
Filter trading strategies based on volatility conditions
Identify momentum acceleration or exhaustion
⚙️ Settings Guide
Here’s a breakdown of the user inputs:
🔹 ATR Settings
Setting Description
ATR Length Number of periods for ATR calculation (default: 14)
ATR Smoothing Type of moving average used (RMA, SMA, EMA, WMA)
ATR Average Length Period for the ATR moving average baseline
🔹 Asset Class Preset
Choose between:
Manual – Define your own point multiplier and thresholds
Forex (Pips) – Auto-set for FX markets (high precision)
Indices (0.1 Points) – For index instruments like DAX or S&P
Gold (USD) – Preset suitable for XAU/USD
If Manual is selected, configure:
Setting Description
Points Multiplier Multiplies raw price ranges into useful units (e.g., 10 for Gold)
Low Volatility Threshold Threshold to define "LOW" volatility
High Volatility Threshold Threshold to define "HIGH" volatility
🔹 Extended Range and VIX
Setting Description
Timeframe for Extended High/Low Used to compare larger price ranges (e.g., Daily or Weekly)
External Volatility Index (VIX) Symbol for a volatility index like "VIX" or "EUVI"
Low VIX Threshold Below this level, VIX is considered "low" (default: 20)
High VIX Threshold Above this level, VIX is considered "high" (default: 30)
🔹 Table Display
Setting Description
Table Position Where the visual table appears on the chart (e.g., bottom_center, top_left)
Show ATR Line on Chart Whether to display the ATR line directly on the chart
✅ Signal Logic Summary
The script determines the final signal based on:
ATR being above or below its average
ATR rising or falling
ATR percentage being significant (>2%)
VIX being high or low
Conditions Signal
ATR rising + high volatility + low VIX LONG
ATR falling + high volatility + high VIX SHORT
ATR flat or low volatility or low %ATR FLAT

5m Gold Strategy - Session Break + Previous Day High/LowHere is your complete Pine Script v5 code for TradingView that:
Implements your 5-minute Gold breakout strategy.
Uses previous day high/low levels.
Confirms entry based on 15-minute SMA trend (SMA 9 > SMA 21).
Marks session time.
Filters news time (pause trading 15 minutes before/after major red news from ForexFactory).

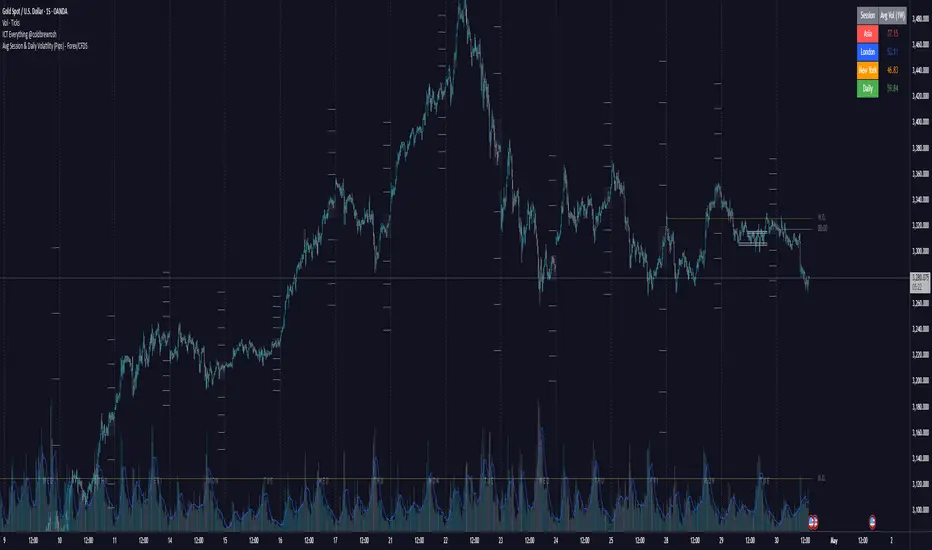
Avg Session & Daily Volatility (Pips) - Forex/CFDS🔍 Overview
The Avg Session & Daily Volatility (Pips) indicator measures the average High–Low range (volatility) of three major Forex sessions—Asia, London, New York—and the entire trading day, then displays the results in a compact overlay table.
⚙️ Key Features
Session Windows
Asia: Default 23:00 – 07:00 server time
London: 07:00 – 16:00
New York: 13:00 – 22:00
Daily Range
– Tracks the full High–Low from midnight to midnight.
Flexible Lookback
– Choose 1W / 2W / 4W / 8W (≈ 5 / 10 / 20 / 40 trading days)
Pip Conversion
Forex Pairs: 1 pip = 0.0001 → (ticks / mintick) / 10
XAU/USD (Gold): 1 pip = 1 USD → direct price difference
Custom Styling
– Pick your own colors per session & daily
– Table position: Left/Center/Right × Top/Middle/Bottom
📈 Benefits & Use Cases
Optimal Stop-Loss & Take-Profit
Gauge each session’s typical movement to size SL/TP appropriately.
Intraday Performance Check
Compare your real-time trade swings against historical averages.
Risk Management
Align position sizes with average volatility to control risk.
Multi-Asset Support
Works seamlessly for major Forex pairs and Gold (XAU/USD) thanks to smart pip logic.
🚀 How It Works
Session Scanning – Continuously tracks the session’s high and low.
Array Storage – At session close, calculates range in pips and pushes it into a rolling buffer.
Averaging – Computes the arithmetic mean of the last N values (your chosen lookback).
Visualization – Paints the four averages in a neat 2×5 table overlay.
👍 Pro Tips
Check Your Time Zone – Make sure chart timezone matches your broker’s session times.
Tweak Lookback – Use shorter windows (1W) to react quickly; longer (4–8W) to smooth out outliers.
Combine Indicators – Pair with volume or trend tools for deeper insights.
Happy Trading,
Riseofatrader
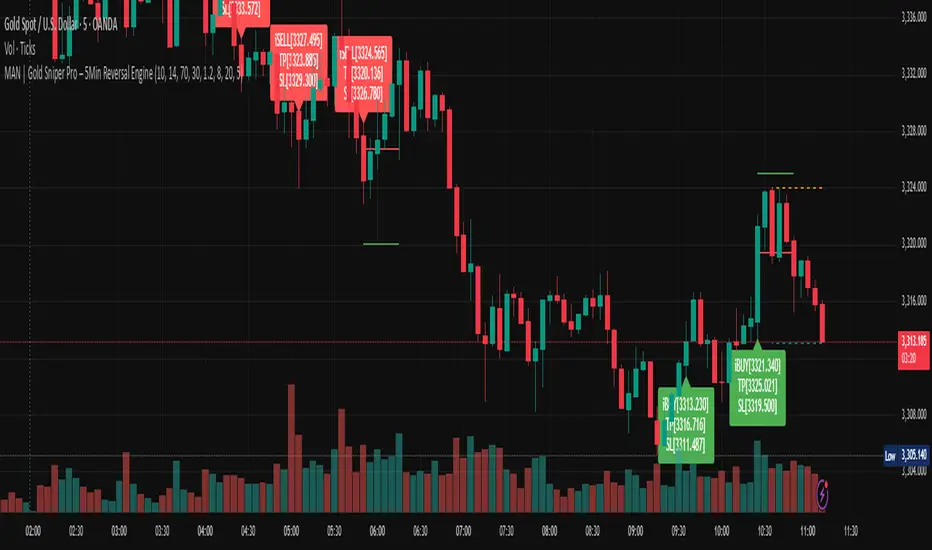
MAN | Gold Sniper Pro – 5Min Reversal EngineThis advanced scalping indicator is designed for high-precision entries and exits on the 5-minute timeframe, combining price action, volume analytics, and momentum filtering.
🔍 Core Features:
Price Action Engine: Detects powerful bullish and bearish engulfing patterns, enhanced with ATR-based body size filters to avoid weak signals.
Dynamic Support/Resistance Zones: Automatically tracks recent high/low zones to confirm trade validity and prevent chasing trades.
Smart RSI Filter: Filters trades based on momentum to avoid buying overbought or selling oversold conditions.
Volume Spike + OBV Filter: Confirms entries with strong volume spikes and OBV (On-Balance Volume) alignment, improving signal quality.
Time-based Session Filter: Optional filter to restrict signals to high-liquidity market hours (configurable).
Auto TP/SL Levels: Calculates Take Profit and Stop Loss dynamically using ATR multipliers, with customizable multipliers per timeframe.
Clear Entry Labels + Optional TP/SL Lines: Visual labels for each signal, with the option to show SL/TP as horizontal lines for precision monitoring.
Real-time Alerts: Set alerts for BUY and SELL conditions — stay informed and trade instantly.
📈 Recommended Usage:
Optimized for Gold (XAUUSD) on the 5-minute chart, but configurable for any fast-moving asset.
Ideal for scalpers and intraday traders seeking high-quality, low-latency entries with built-in protection mechanisms.
Works well in trending or range-bound conditions, thanks to volume and price action synergy.
⚙️ Customizable Parameters:
RSI length & thresholds
ATR-based SL/TP multipliers
Volume spike threshold
Session window
TP/SL visibility toggle
🟢 Built by traders, for traders.
Sharpen your edge with this smart, visual, and momentum-aware scalping tool.