RSI multitimeframe SMA crossoverStrategy based on the multi timeframe equally weighted RSI moving averages turned into single average and then cross of the 2 combined outputs, seems to be promising, default settings work good on 5m chart(better entry) but very filtered trade amount. If you want to use it on different timeframes be my guest and mess with adjustments, pretty much every aspect of strategy is adjustable, idea is same. If somebody liked the idea and able to improve it - share with me :)
Hareketli Ortalamalar
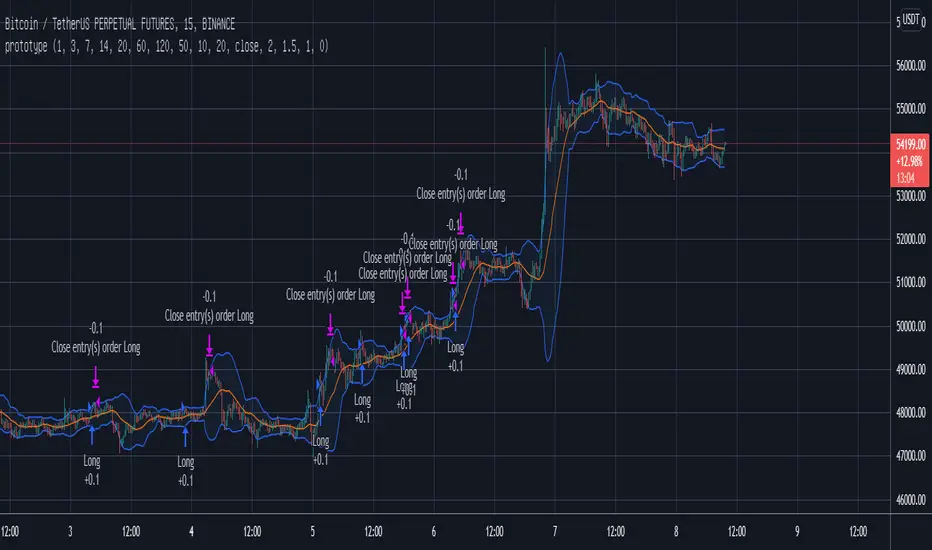
Larry Williams 3 Period EMAs strategyLarry R. Williams explains this strategy in his book "Long-Term secrets to Short-Term trading", it consists of using two 3-period EMAs, one representing the Highs and the other the Lows.
When the price falls below the 3-period Lows EMA we have a long signal.
The trade is closed when the price closes above the 3-period Highs EMA . BINANCE:BTCUSDT


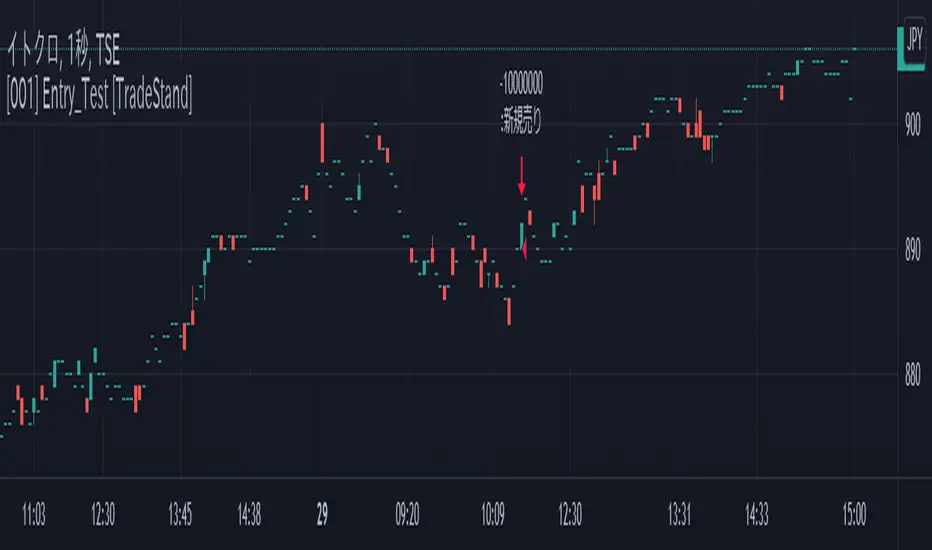
[001] Entry_Test [TradeStand]Entry_Exit_Test .
------------------------------------
Function description
------------------------------------
You can automatically receive an entry alert when the conditions you specify are met.
Settlement alerts can be sent automatically when the conditions you specify are met.
Three types of moving averages can be displayed.
------------------------------------
Entry and Settlement Conditions
------------------------------------
Trade Mode: Select the trade you wish to execute.
Date and time: Enter the date and time you wish to execute the trade.
Number of seconds: If you want to specify the number of seconds, please enter it.
Daily MA: The 5, 25, and 75 day moving averages are displayed.
------------------------------------
------------------------------------
Entry_Exit_Test .
------------------------------------
■機能説明
------------------------------------
あなたが指定した条件を満たした時に、エントリーアラートを自動的に配信することが出来ます。
あなたが指定した条件を満たした時に、決済アラートを自動的に配信することが出来ます。
3種類の移動平均線を表示することが出来ます。
------------------------------------
■エントリー・決済条件
------------------------------------
・トレードモード:実行したいトレードを選択します
・日時:実行したい日時を入力、または選択します
・秒数:秒数まで指定したい場合は入力してください
・日足MA:5、25、75日移動平均線が表示できます

[002] DAY_MA_Pass [TradeStand]Cond_for_Day_MA
------------------------------------
Function description
------------------------------------
You can automatically receive an entry alert when the conditions you specify are met.
Settlement alerts can be sent automatically when the conditions you specify are met.
Three types of moving averages can be displayed.
------------------------------------
Entry and Settlement Conditions
------------------------------------
Trade Mode: Select the trade you wish to execute.
Date and time: Enter the date and time you wish to execute the trade.
Number of seconds: If you want to specify the number of seconds, please enter it.
Daily MA: The 5, 25, and 75 day moving averages are displayed.
Daily MA Trade: Select for this function
Select MA: Select the moving average you want to use as a reference.
Select conditions: Select the current position relative to the moving average
------------------------------------
------------------------------------
Cond_for_Day_MA
日足移動平均線を基準としたエントリー・決済
------------------------------------
■機能説明
------------------------------------
あなたが指定した条件を満たした時に、エントリーアラートを自動的に配信することが出来ます。
あなたが指定した条件を満たした時に、決済アラートを自動的に配信することが出来ます。
3種類の移動平均線を表示することが出来ます。
------------------------------------
■エントリー・決済条件
------------------------------------
選択した時間に、移動平均線を「超えているか」「割っているか」で
エントリー・決済を実行できます。
・トレードモード:実行したいトレードを選択します
・日足MA表示:5、25、75日移動平均線が表示できます
・実行日時:実行したい日時を入力、または選択します
・秒数:秒数まで指定したい場合は入力してください
・日足MA基準トレード:この機能の「OFF/ON」を選択します
・指定 日足移動平均線:基準となる日足移動平均を選択します
・条件:移動平均線に対する現在の位置関係を選択します
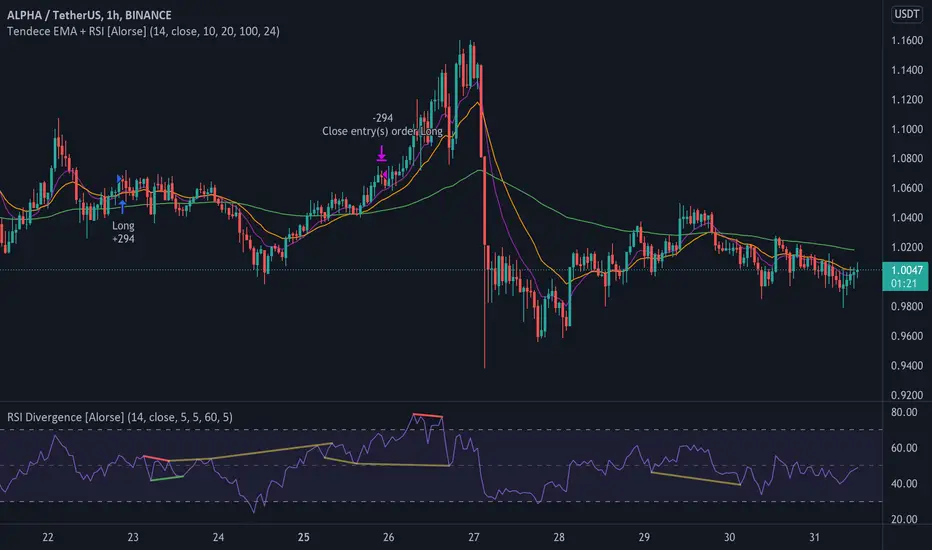
Tendency EMA + RSI [Alorse]A very simple and highly effective strategy LONG & SHORT that combines only 2 indicators:
RSI
3 Moving Average Exponential (EMA)
LONG Entry conditions are:
EMA 20 cross over EMA 10
EMA 10 is above EMA 100
LONG Exit conditions are:
RSI greater than 70
Or when X number of candles have passed and the trade is in profit. (Check Settings)
SHORT Entry conditions are:
EMA 20 cross under EMA 10
EMA 10 is below EMA 100
SHORT Exit conditions are:
RSI is less than 30
Or when X number of candles have passed and the trade is in profit. (Check Settings)
Indicators & Conditions Test Framework [DTU]Hello All,
This script is a framework to build strategies by combining indicators and conditions (long, short, exits). You are able to analyze your strategies in realtime by changing the input parameters related to indicators, conditions and their combinations.
OVERVIEW
With this Study/Strategy framework, you will be able to create strategy conditions, display them on the chart, and test them using existing indicators as well as external and custom indicators that you can add.
The main purpose of the Framework is to choose your indicators to be used in the conditions and test your strategy by producing your "Long, short, Exit long, Exit short" combinations.
Although may be, it can be a bit difficult and complicated at first start, but you can understand the logic on its use in a very short time.
Notes:
I removed external links off descriptive images and video to be comply with Trading view violation House Rules
Since I am new in the community and still trying to understand the pine script language I can make errors and violations on my script. Please Inform me on any issue that I made..
HOW TO
STEP 1: SETTINGS ______________________________________________________________________________________________________
SOURCE, TIMEFRAME, SECURITY
Select the Source, timeframe and Secure type that your indicators will use.
Here, the Secure entry consists of 3 parts and the f_security function is used to determine it.
a)Secure
This option is defined as reducing repaint in tradingview calculations as much as possible. The following function is used.
request.security(_symbol, _res, _src , lookahead=barmerge.lookahead_on)
b)Semi Secure
While this option can reduce repaint in tradingview calculations as much as possible, it is less secure. The following function is used.
request.security(_symbol, _res, _src )
c)Repaint
This option turns on the repaint feature. The following function is used.
request.security(_symbol, _res, _src ) : na
Ind Source:
You can the source that indicators will use their own calculations
Ext Source:
You can import external Indicator sources from here . It appears on condition/combination area as "EXT".
To export the External indicator plot it with a title. It will be visible in source dropdown input
PERIOD , ALERTS...
Period:
Determine your strategy testing period by selecting start and end date/time
(!!! According to your tradingview subscription, it takes the last 5000, 10000.. bars.
The extra bar option may cause problems such as not appearing in the calculations or errors).
Plot Alerts:
Plot condition result as alerts arrows on the chart's bottom for "LONG" and the top for "SHORT" entries, exits
Close on opposite:
When selected, a long entry gets closed when a short entry opens and vice versa
Show Profit:
It appears if script is in strategy mode (not in study) this can display current or open profit for better reanalyzing your strategy entry exit points. (Currently under development)
PLOT TYPE OPERATIONS
This option has 4 entries
a) Mult
Sets the multiplier for the selected Plot Type (stochastic, Percentrank, Org Range (-1,1) ) except for "Original" in the range (-1,1).
EXAMPLE: When 1000 is selected, the indicator in the range of (-1,1) will appear in the range of (-1000, 1000) on the screen.
b) Shift
It determines the shift that will appear on the screen for the selected Plot Type (stochastic, Percentrank,Org Range (-1,1) ) in the range (-1,1) other than "Original".
EXAMPLE: When Shift:35000 and mult:1000 are selected, the indicator will appear in the range (34000, 36000) on the screen.
c) Smooth
This option (only for Stochastic & PercentRank) allows to smooth the indicator to be displayed.
Here, tradinview ta.swma function is used.
b) hline
Adjusts the horizontal lines to appear on the screen according to the mult factor for the range (-1,1)
The lines represent the values (-1, -05, 0, 05, 1)
STEP 2: INDICATORS ______________________________________________________________________________________________________
You need to choose indicators that you can use in strategy conditions.
Here, the indicators come from the dturkuler/lib_Indicators_DT open script library defined in the code
In addition, you can add the indicators that you will create in the area defined in the code to this list..
You can also import external indicators and test them with other variables on the system..
You can choose a maximum of 5 indicators that you can use in total. (can be increased in new versions)
Indicators are categorized in 3 main sections
Indicator Selection:
You can select your indicators from this area
a)Moving Averages
These are indicators such as EMA, SMA that you can show on the stock. They come from the library.
These indicators are fed from Settings/source. Only the length value can be used as a parameter.
In addition, line colors can be changed..
As of now, there are 28 indicators in the library in total and 5 indicators are left as future use for this field for now.
b)Other Indicators
These are different indicators from the stock value such as RSI, COG. They come from the library. These indicators are fed from Settings/source.
Only the length value can be used as a parameter. In addition, line colors can be changed.
As of now, there are 24 indicators in the library in total and 5 indicators are left as a future use for this field for now.
c)Custom Indicators
These indicators are the ones you can create by programming yourself in the source code..
The area at the bottom of the settings screen is reserved for the parameters of this type of indicators.
Indicator Length:
You can update your selected indicator length value from here. (Not: it doesn't work for custom indicators since they have their parameter on cust. Ind. input screen )
Indicator Plot Type:
Next to the indicators, there is an input selection field about how they will be displayed on the screen.
a)Original
The indicator is displayed on the screen with its current values. It is an ideal solution for displaying moving average indicators such as (EMA, SMA) over current stock.
Since the values of indicators such as (RSI, COB) are low (-100,100 : -1.1), they appear at the bottom of the screen and make analysis difficult.
For this reason, other options may be more suitable for these.
b)Stochastic
The indicator is displayed on the screen with stochastic calculation in the range of -1.1.
It uses the stochastic(50) calculation method to spread indicators such as (RSI, COB) over the range (-1,1).
Indicators in this selection can be fixed and monitored under stock on the screen with the parameters under the Plot Type section.
You can see the original values of the relevant indicator on the Data Window screen.
(!!! Do not use the values on the chart in your condition calculations. Instead, get the values from Data Window)
c)PercentRank
The indicator is displayed on the screen with stochastic calculation in the range of -1.1. .
Since the values of indicators such as (RSI, COB) are low (-100,100 : -1.1), they appear at the bottom of the screen and make analysis difficult.
Indicators in this selection can be fixed and monitored under stock on the screen with the parameters under the Plot Type section.
You can see the original values of the relevant indicator on the Data Window screen
((!!! Do not use the values on the chart in your condition calculations. Instead, get the values from Data Window)
d)Org Range (-1,1)
If your indicator is in the range of -1.1, your indicator will be displayed on the screen with its original calculation in the range of -1.1.
Indicators in this selection can be fixed and monitored under stock on the screen with the parameters under the Plot Type section.
You can see the original values of the relevant indicator on the Data Window screen.
(!!! Do not use the values on the chart in your fitness calculations. Instead, get the values from Data Window)
STEP 2 NOTES:
STEP 3: CONDITIONS ______________________________________________________________________________________________________
After choosing the indicators you will use in the conditions, you move on to the "CONDITIONS" section.
There are 4 conditions type here.
• LONG ENTRY CONDITION
• SHORT ENTRY CONDITION
• LONG CLOSE CONDITION
• SHORT CLOSE CONDITION
The use of each condition is the same.
There are 3 combinations you can use in each condition. (can be increased in new versions)
a)COMBINATIONS
There are 3 combinations you can use in each condition. (can be increased in new versions)
Each combination are build from 4 parts
1)1st Indicator
If set to "NONE" this combination will not be used on calculations. You can select
IND1-5: from indicators (See above),
EXT: value from externally imported indicator
Stock built-in values: close, open...
2)Operator
Selected Operator compares 1st Indicator with the 2nd one. You can select different operators such as
crossover, crossunder, cross,>,<,=....
3)2nd Indicator
This indicator will be compared with the 1st one via selected Operator. You can select
IND1-5: from indicators (See above),
VALUE: a float value defined in the combinations value parameter
EXT: value from externally imported indicator
Stock builtin values: close,open...
4)Value
When the 2nd indicator field is "VALUE", value area compares the entered value.
ex: 1st indicator="open", op=">", 2nd indicator="VALUE", value=3000.12 means is(close>3000.12)
In other conditions, it compares the previous values of the indicator.
ex: 1st indicator="open", op=">" 2nd indicator is "close" and value is 2 means is(open>close )
EXAMPLES:
indicator 1= "IND1", Operator=">", indicator 2= "IND2" => is(IND1>IND2)
indicator 1= "IND1", Operator=">", indicator 2= "VALUE", "0.1" => is(IND1>0.9)
indicator 1= "IND2", Operator="crossover", indicator 2= "IND1" => is(IND2 crossover IND1) : like a=ta.crossover(IND2, IND1)
indicator 1= "IND1", Operator="<", indicator 2= "close" => is(IND1>close)
indicator 1= "IND1", Operator="<", indicator 2= "EXT" => is(IND1>EXT) , EXT mean external imported indicator that define on settings section
indicator 1= "IND1", Operator="<", indicator 2= "IND1", Value="1" => is (IND1>IND1 )
b)JOIN COMBINATIONS
Each combination in Condition is compared with the next one via JOIN operator
The join operator can be selected as AND or OR.
Examples:
1st combination= is(IND1>0.9) true
2nd combination= is(IND2 crossover IND1) false
1st combination "AND" 2ndcombination" => false (is(IND1>0.9) AND is(IND2 crossover IND1))
1st combination "OR" 2nd combination" => true (is(IND1>0.9) OR is(IND2 crossover IND1))
STEP 3 NOTES:
When the 2nd indicator field is "VALUE", value area compares the entered value. In other conditions, it compares the previous values of the indicator.
In cases where "VALUE" is not selected, integer values must be entered in this field. (float should not be entered. ie 1, 2 should be entered)
!!!If the 1st indicator is "NONE" in the combination, that combination is cancelled.
Each combination returns true/false, allowing the selected value to be compared with another value
Example: EMA(21)>EMA(50) returns true under all conditions or (EMA(21) crossover EMA(50)) returns true when passed.
You can use , Value of 5 indicators (IND1-IND5) or (VALUE) that you have defined in combinations or import indicator (EXT) or stock values (close, open, high...) in your calculations.
combination Compares the 1st indicator with 2nd indicator via the operator.
STEP 4: CUSTOM INDICATORS ______________________________________________________________________________________________________
There is an area in the code for designing Custom Indicators.
Here you can design your own indicators and use them in the framework.
You can also create unlimited parameters for your indicators in the SETTINGS custom indicator field.
For now, only 3 Custom indicators have been defined.
Examples are entered in the code for custom indicators.
STEP 4 NOTES:
Including / updating custom to the code is explained in the source code
• LIMITATIONS:
!!! According to your tradingview subscription, it takes the last 5000, 10000.. bars. More bar options may cause problems such as not appearing in the calculations or errors.
• RAMBLINGS:
• NOTES [ /i]
This Script can be used as an indicator if the last strategy parts in the code are commented out and converted to the initial strategy study.
It was originally prepared for my use with my own strategy framework and has export functions accordingly.
When integrated to my own strategy framework it brings many more features over strategy definition of trades.
• TODO [ /i]
TODO: Add tooltips to the settings screen
TODO: Add double triple, Quatr factor for all indicators (convert any indicator to factor2-4 facotr. ex: EMA to DEMA, TEMA, QEMA...)
TODO: Add factorized Fibo avg range indicator (good for trend definition and entry exit points)
TODO: Add bands to the indicator and conditions
TODO: Add debug window for exporting indicator's parameters
TODO: Add isRising(value) isFalling(value), is...(value) .... to combinations (they can be used as custom indicator also
TODO: Reassess condition entry screen for user friendly GUI
TODO: Increase # conditions from 3 to 4
TODO: Reassess strategy entries, exit and close (should be improved)
TODO: Add Alerts, Condiional alerts for indicator (study) part
TODO: Create export function v3 for Pinecoders Indicator framework
• THANKS:
For Pine script format docs RicardoSantos .
For Pine script coding standards Pinecoders .
For moving average script used on library s RodrigoKazuma .

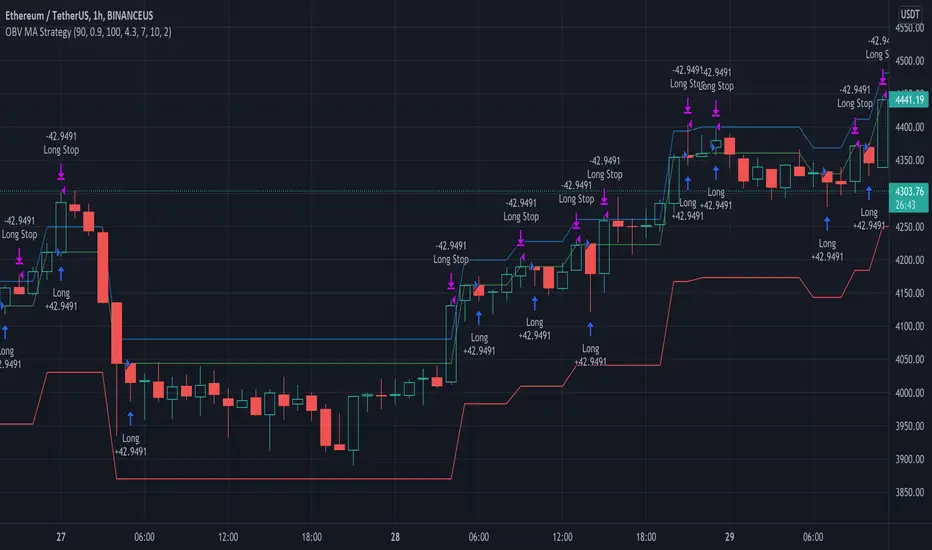
OBV MA StrategyThe On Balance Volume + Moving Average Strategy
Parameters: 1H candles, ETHUSDT on BINANCEUS, commission percent uses Binance's maker/taker fees of 0.075%
Strategy: I create a 30 day moving average of the On Balance Volume "obvSma = ta.sma(ta.obv, 30)." Then I use the following buy conditions:
OBV crosses above the OBV moving average
The obv drops x% below the OBV moving average (buy a dip)
The OBV moving average is rising, the OBV is greater than the OBV moving average and the OBV is rising
The first buy condition is attempting to buy into an uptrend. When the OBV rises above the OBV moving average, people are buying and it's a good time to enter the trade.
The idea behind the second buy condition is to buy a dip so make sure you are careful to not set it too shallow or you'll end up buying the dip before the dip before the dip. :) I recommend 10% or more.
The third buy condition is there in case our trailing stop takes us out of a trade but the trend is still rising, we don't want to miss out on that profit so if the OBV is above the OBV moving average, the average is rising and the OBV is rising, we are likely in the middle of an uptrend and we should buy in.
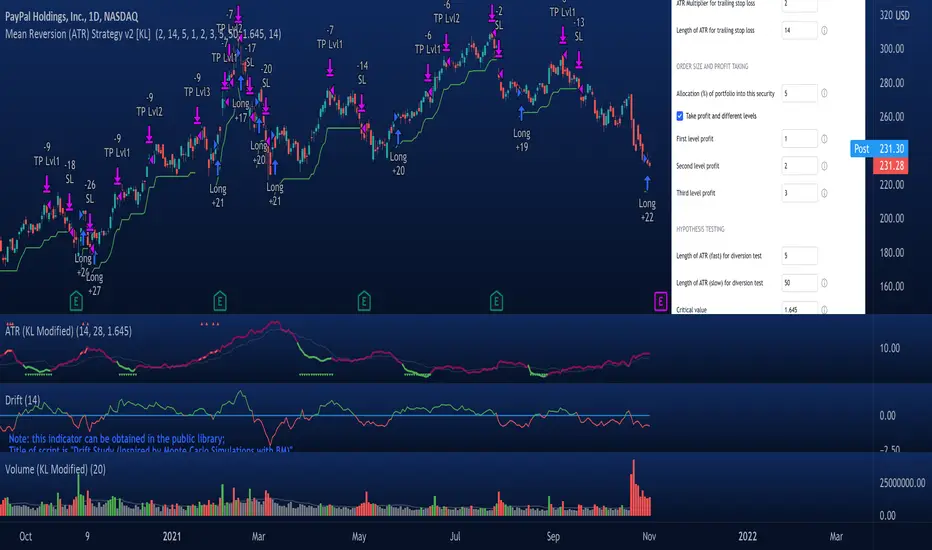
Mean Reversion Strategy v2 [KL]Description :
This strategy will enter a position when the following conditions are met:
a) Main signal: When source data (ATR) diverts from its moving average value, and
b) Confirmation: If predicted direction of trend is favorable.
Assumptions :
During periods of high price volatility, ATR diverts from its moving average value. Eventually, ATR should revert. But since just knowing the magnitude of increase/decrease of ATR does not indicate a trend signal, we need to introduce a model to predict the current trend.
In short:
• Trend Prediction : This strategy calculates the expected logarithmic return of the security (the "Drift") and considers prices to be moving in uptrend if the drift curve is upward sloping.
• Assessment of ATR diversion : To determine "yes/no" regarding whether ATR at a given point in time has diverted, this script conducts a two-tailed hypothesis test at each candlestick period. The null hypothesis (H0) is that the fast moving average value should equal the slow moving average value (say, denoted as H0: atr14 == atr28; it is assumed that atr28 is more meaningful for the purpose of describing the current trend because it has a larger sample size). Investopedia has an article summarizing this topic .
Exit Condition :
When trailing stop loss hits.
Previous version :
This strategy is based on Version 1 published back in September . This older version considers +/- one standard deviation to be the critical values relative to average ATR when testing whether ATR has diverted from the mean. This does not take Standard Error ("SE") into account. As a result, the threshold is often too wide and it generates too many entry signals.
TradingGroundhog - Strategy & Wavetrend V2#-- Public Strategy - No Repaint - Fractals - Wavetrend --
Here I come with another script, a nice and simple strategy based on fractals and Wavetrends.
#-- Synopsis --
A simple idea, on a small time frame (15 min) we buy when the opening price goes below a Bottom fractals and sell when it goes over a Top fractals, but in order to avoid bad and evil downtrends, we use Wavetrends based on a Daily time frame. From it, Tops and Bottoms are extracted. If the opening price goes above Wavetrend Tops, no trades will be conducted during the day. If the price goes below Wavetrend bottoms, no trades will be executed from 1 to N days, until a new Wavetrend bottom is generated.
I developed the strategy using BTC /EUR 15 MIN BINANCE but it can be applied to many other cryptos, I don't know for forex or others. You can use it for long term and automated trading, I implemented the Wavetrend indicator to do so, or for short term if you have spot a long coming uptrend. Test it, look at its profit and long or short period on your crypto of choice.
#-- Graph reading --
And now, how to read it ?
Wavetrends:
Red Backgrounds are associated to No Trade periods. These periods occur when the price goes below a Wavetrend bottom or above a Wavetrend Top. They are here to limit the loss.
Blue Gradient lines represent the past Tops. For each bar, only the increasing values of the Wavetrend tops are acquired. Going from light to dark blue based on the age of the Tops. Thus, if on line goes from dark to light, this means the price is approaching a previous Wavetrend top. In the opposite, if it darken, thus the price say 'buy buy' and go dropping.
Yellow Gradient lines represent the past Bottoms. They are based on the same principe that the blue lines.
Fractals:
Yellow Flags occur when the opening price goes below a Bottom fractal , it means Buy.
White Flags appear when the opening price goes over a Top fractal , it means Sell.
#-- Parameters --
*** Parameters have been intensively optimized using 10 cryptocurrency markets in order to have potent efficiency for each of them. I would recommend to only change the Can Be touch parameter. For the others, I don't recommend any modifications. The idea behind the script is to be able to switch between markets without having to optimize parameters, less work, easy to target active crypto and therefor limit the risks. ***
Can be touch :
'Combined Smoothness' : The number of open individuals used by the Wavetrend. (6 or 9, often 9 is better but with less volatile crypto it will be 6)
'Filter fractals' : Activate or Disable the filtering fractal operation. If Enable, buy during less risky periods. (Disable is often better)
Can be touch but not necessary :
'VolumeMA' : The Volume corrector used by the fractals
'Extreme window' : The number of price individuals to look for if we want to remove extreme fractals.
Not to touch :
'Limit_candle to look on' : Number of candles to use to compute the Wavetrend Tops and Bottoms.
'Length top bottom drawn' : Size of the lines
'Long Sop Loss (%)' : The minimal difference of price between a Fractal bottom and the opening price to buy.
#-- Time frame --
Should be used with the following time frames depending on the necessity:
1 MIN
3 MIN (Interesting for short term profit, may need some parameter ajustements)
5 MIN
15 MIN (Preferred for long term profit, the script was developed on it)
#-- Last words --
The script can be set up to send Tradingview signals to 3comma just by adding comment = " " in strategy.close_all() and strategy.entry().
Good trades !
Disclaimer (As it should always be one to any script)
***
This script is intended for and only to be used for personal purposes only. No such information provided by it constitutes advice or a recommendation for any investment or trading strategy for any specific person. There is no guarantee presented or implied as to the accuracy of specific forecasts, projections, or predictive statements offered by the script. Users of the script agree that its original developer does not take responsibility for any of your investment decisions. Please seek professional advice before trading.
***
# Here are the results from the 1rst of July 2021 with 100% of equity on the BTC /EUR 15 Min and with a capital of 1 000 EUR.
# As I saw, it goes from +20% to more than +100% depending on the selected crypto. Sometimes it's negative but it's quite rare on crypto using the EUR.

Simple Ema_ATR Strategy HulkTradingSimple EMA strategy, based on ema55+ema21 and ATR(Average True Range) and it enters a deal from ema55 when the other entry conditions are met
Basically long and short conditions
If long:
1) close must be less than open (because we are searching for a pullback)
2) emaFast(21) must be bigger than emaSlow(55) - for a trend detection
3) Difference between emaFast and emaSlow must be greater than ATR(14) - for excluding flat
For short conditions are opposite
Stop levels and take profits, based on ATR multiplier.
You can change it in input field.
I recommended values between 1 and 4, not more.
This strategy was tested on pairs BTCUSDT and ETHUSDT and have a nice results.

Scalping Trading System bot Crypto and StocksThis is a trend trading strategy scalping bot that can work with any type of market. However I concluded my tests so far with Crypto, Stocks and Forex, and with optimizations always could be found some profitable settings.
Indicators
SImple Moving Average
Exponential Moving Average
Keltner Channels
MACD Histogram
Stochastics
Rules for entry
long= Close of the candle bigger than both moving averages and close of the candle is between the top and bot levels from Keltner. At the same time the macd histogram is negative and stochastic is below 50.
short= Close of the candle smaller than both moving averages and close of the candle is between the top and bot levels from Keltner. At the same time the macd histogram is positive and stochastic is above 50.
Rules for exit
We exit when we meet an opposite reverse order.
This strategy has no risk management inside, so use it with caution !

RSI StrategyThis RSI strategy is different than most in that it doesn't pick a buy signal based on the RSI rising above a specific number (usually 30). Instead, it creates a 14 day exponential moving average of the Relative Strength Index and uses the following two conditions together to trigger a buy:
Entry conditions:
Condition1: Rising of the RSI's moving average for (user defined) candles in a row
Condition 2: The RSI is < 70
The reasoning behind condition 1 is that we are trying to buy into a rising trend, the moving average helps to confirm the trend, whereas the RSI rising above a specific number (usually 30) gives us no real indication that the asset will increase and produces less wins overall. The reasoning behind condition 2 is to avoid buying at the top of a climb.
Exit conditions:
Condition 1: The RSI moving average is falling
Condition 2: Close < Trailing stop activation Level
Condition 3: We have at least (user defined) % profit
The reasoning behind sell condition 1 is a falling RSI moving average (down trend starting). The close has to be under the trailing stop activation level, if we've triggered the trailing stop, we want the trailing stop to do it's job and not exit the trade until the trailing stop takes us out. The reasoning behind condition 3 is to not exit without at least some profit (user defined).

Juicy TrendThis script is simple.
It uses EMA and HMA crosses to find entries and exits.
There is an option for sourcing Heikin Ashi based entries/exits.
There is an option for Stop Loss percentage.
It is made for finding Long entries on the 45min chart.
You can optimize the signals by adjusting the moving average lengths.
The default settings are for BTC/USDT 45min.
Suggestion, reduce the Stop Loss percentage for smaller / more volatile assets.

Forex Fractal EMA ScalperThis is a forex scalper designed for very short timeframes 1-5 min max.
At the same time due to the short timeframe, is recommend to re optimize it weekly .
Its components are
Fractals
Triple EMA with different lengths
Rules for entry:
For long : we have an up fractal and all 3 ema are in ascending order
For short: we have a down fractal and all 3 ema are in descending order.
Rules for exit
We exit when we either get a reverse order or when we hit the take profit or stop loss calculated in fixed pips.

PowerX Strategy BacktestThis script implements the Power X trading strategy by Markus Heitkoetter and Rockwell Trading. The strategy is described in detail in "The PowerX Strategy: How to Trade Stocks and Options in Only 15 Minutes a Day" written by Markus Heitkoetter.
The Power X trading strategy uses RSI, Slow Stochastic and MACD indicators. When RSI and Slow Stochastic are both greater than 50 and MACD crosses up the signal line, it signals an up-trend. If RSI and slow stochastic are both less than 50 and MACD crosses down the signal line, it signals a down-trend. Other conditions signal no trend. There is an official version of this indicator available: PowerX Strategy Bar Coloring OFFICIAL VERSION.
This script opens a long entry with an up-trend momentum and a short entry with down-trend momentum. Trades are exited when profit target or stop loss is reached. Profit target and stop loss are calculated based on 7 days Average Daily Range (ADR). If the momentum is lost, a trade is exited the next day. The quantity of assets to buy/sell is calculated based on the stop loss to limit the risk to a user defined percentage of the initial capital.
There is another implementation of the Power X trading strategy available by therealhaolu: Power X Strategy Back-test. However, according to the comments this script seems to have some flaws.

Supertrend + Stoch StrategyA strategy using ema , supertrend and stochastic .
Long entry conditions:
1. EMA 25 > EMA 50 and EMA 100 > EMA 100.
2. Supertrend indicator is green.
3. Stochastic k line cross over d line.
Long stop: the lowest price of the last k

Auto Fib Golden Pocket Band - Strategy with Buy Signalsthis strategy is based on the Indicator "Auto Fib Golden Pocket Band - "Autofib Moving Average"
it's the same as the indicator but with:
- the strategy tester included
- several entry Signal filter
- Dynamic SL

Bollinger band & Volume based strategy V2this script is upgraded version of previous one the major change is deleted script which find a highest price after entry the last of strategy is same.
If current volume is above daily average volume, and three bollinger band`s Standard Deviation, 1 and 1.5 and 2 if the current lowest price is bigger then 1 stdev and current closed is bigger then 1.5 stdev and the last,highest price is above 2.0 stdev, it defined current market is bullish and had momentum.
and the Short will entered when ma60 and ma120 is undercrossed it work as prevent current price is way lower then entry price.
**this script is working in 15min Only in BTC market or USDT**
** basic equity setting is 500$, set your own**
**if you will use this in real-trade,plz comment the result to me**
Ps: i wanna know why my script is only working well in 15 min tick, anyone who has similar phenomenon or if you had a answer about it, please comment me.

Arch1tect's New Toy (Strategy Tester Version)Description:
The version of Arch1tect's New Toy indicator with Strategy Tester added.
This indicator tries to predict market trends by simply utilising 2 moving averages crossovers.
How it works:
Buy signals are triggered when the faster MA crosses over the slower MA from the downside to the upside.
Sell signals are triggered when the faster MA crosses under the slower MA from the upside to the downside.
How to use:
Take buys when buy signal is triggered AND close existing sell position
Take sells when sell signal is triggered AND close existing buy position
Note:
Settings are optimised for XAUUSD on the M1 chart.
Extra:
Alerts are included.
You can toggle between EMA, WMA and SMA to your liking.
Indicator version:

SirSeff's EMA RainbowThis strategy uses divergences between three exponential moving averages and their slope directions as well as crosses between the price and these moving averages to switch between a long or short position. The strategy is non-stop in the market and always either long or short.\
This trend trading strategy uses exponential moving averages of 10, 20, 50, 100, 150, 200 to gauge the price action cycle if it is on Stage 2 aka Mark up famously coined by Dr.Wykcoff.
It opens a position when the closing price crosses above the 10ema and all the exponential moving averages are stacked up together. Stacked-up Moving averages are used by Mark Minervini and Oliver Kell.
I close a position at an 8% trailing stop from the opened position which makes the succeeding buy orders as scaling up or averaging up from an established bullish trend.
All trading involves high risk; past performance is not necessarily indicative of future results. Hypothetical or simulated performance results have certain inherent limitations. Unlike an actual performance record, simulated results do not represent actual trading. Also, since the trades have not actually been executed, the results may have under-or over-compensated for the impact, if any, of certain market factors, such as lack of liquidity. Simulated trading programs in general are also subject to the fact that they are designed with the benefit of hindsight. No representation is being made that any account will or is likely to achieve profits or losses similar to those shown.

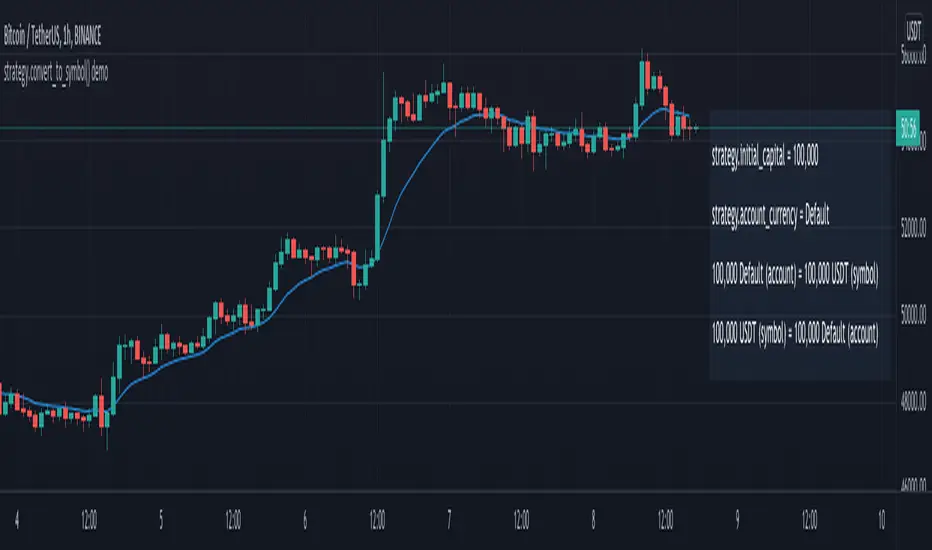
strategy.convert_to_symbol() demoA strategy demonstrating the new strategy.convert_to_symbol() and strategy.convert_to_account() functions introduced in Pine v5.
Try selecting a custom "Base Currency" under Properties to see how the conversion works.
Note: The conversion functions seem to work as expected on BTCUSD, but not on BTCUSDT. This is likely because USDT is not recognized as a currency.
Volume and Moving average,will this model working in real-trade?i`ve recently made this script through few month,understand me if there are some incorrect grammar or something.
basically this script is based on moving average strategy and the bollinger bands
if the buy volume is bigger than sell volume,also buy volume is bigger then daily average volume than it`s defined current market is bullish and entered(of course there is some other conditions)
the exit condition is find the highest price after entered,keep refresh the highest price through time and then,if the current price is ?%lower then highest price,it will closed the position.
my question is this : 1 this model will working in real-trade?
2 why the winning rate is 100%?
- i`ve coded if the position margin over -10%,close the position this code isn`t work? or the other profit line is prevent that happened?