DEMA Trend Oscillator Strategy📌 Overview
The DEMA Trend Oscillator Strategy is a dynamic trend-following approach based on the Normalized DEMA Oscillator SD.
It adapts in real-time to market volatility with the goal of improving entry accuracy and optimizing risk management.
⚠️ This strategy is provided for educational and research purposes only.
Past performance does not guarantee future results.
🎯 Strategy Objectives
The main goal of this strategy is to respond quickly to sudden price movements and trend reversals,
by combining momentum-based signals with volatility filters.
It is designed to be user-friendly for traders of all experience levels.
✨ Key Features
Normalized DEMA Oscillator: A momentum indicator that normalizes DEMA values on a 0–100 scale, allowing intuitive identification of trend strength
Two-Bar Confirmation Filter: Requires two consecutive bullish or bearish candles to reduce noise and enhance entry reliability
ATR x2 Trailing Stop: In addition to fixed stop-loss levels, a trailing stop based on 2× ATR is used to maximize profits during strong trends
📊 Trading Rules
Long Entry:
Normalized DEMA > 55 (strong upward momentum)
Candle low is above the upper SD band
Two consecutive bullish candles appear
Short Entry:
Normalized DEMA < 45 (downward momentum)
Candle high is below the lower SD band
Two consecutive bearish candles appear
Exit Conditions:
Take-profit at a risk-reward ratio of 1.5
Stop-loss triggered if price breaks below (long) or above (short) the SD band
Trailing stop activated based on 2× ATR to secure and extend profits
💰 Risk Management Parameters
Symbol & Timeframe: Any (AUDUSD 5M example)
Account size (virtual): $3000
Commission: 0.4PIPS(0.0004)
Slippage: 2 pips
Risk per trade: 5%
Number of trades (backtest):534
All parameters can be adjusted based on broker specifications and individual trading profiles.
⚙️ Trading Parameters & Considerations
Indicator: Normalized DEMA Oscillator SD
Parameter settings:
DEMA Period (len_dema): 40
Base Length: 20
Long Threshold: 55
Short Threshold: 45
Risk-Reward Ratio: 1.5
ATR Multiplier for Trailing Stop: 2.0
🖼 Visual Support
The chart displays the following visual elements:
Upper and lower SD bands (±2 standard deviations)
Entry signals shown as directional arrows
🔧 Strategy Improvements & Uniqueness
This strategy is inspired by “Normalized DEMA Oscillator SD” by QuantEdgeB,
but introduces enhancements such as a two-bar confirmation filter and an ATR-based trailing stop.
Compared to conventional trend-following strategies, it offers superior noise filtering and profit optimization.
✅ Summary
The DEMA Trend Oscillator Strategy is a responsive and practical trend-following method
that combines momentum detection with adaptive risk management.
Its visual clarity and logical structure make it a powerful and repeatable tool
for traders seeking consistent performance in trending markets.
⚠️ Always apply appropriate risk management. This strategy is based on historical data and does not guarantee future results.
Hareketli Ortalamalar

Dskyz (DAFE) AI Adaptive Regime - Beginners VersionDskyz (DAFE) AI Adaptive Regime - Pro: Revolutionizing Trading for All
Introduction
In the fast-paced world of financial markets, traders need tools that can keep up with ever-changing conditions while remaining accessible. The Dskyz (DAFE) AI Adaptive Regime - Pro is a groundbreaking TradingView strategy that delivers advanced, AI-driven trading capabilities to everyday traders. Available on TradingView (TradingView Scripts), this Pine Script strategy combines sophisticated market analysis with user-friendly features, making it a standout choice for both novice and experienced traders.
Core Functionality
The strategy is built to adapt to different market regimes—trending, ranging, volatile, or quiet—using a robust set of technical indicators, including:
Moving Averages (MA): Fast and slow EMAs to detect trend direction.
Average True Range (ATR): For dynamic stop-loss and volatility assessment.
Relative Strength Index (RSI) and MACD: Multi-timeframe confirmation of momentum and trend.
Average Directional Index (ADX): To identify trending markets.
Bollinger Bands: For assessing volatility and range conditions.
Candlestick Patterns: Recognizes patterns like bullish engulfing, hammer, and double bottoms, confirmed by volume spikes.
It generates buy and sell signals based on a scoring system that weighs these indicators, ensuring trades align with the current market environment. The strategy also includes dynamic risk management with ATR-based stops and trailing stops, as well as performance tracking to optimize future trades.
What Sets It Apart
The Dskyz (DAFE) AI Adaptive Regime - Pro distinguishes itself from other TradingView strategies through several unique features, which we compare to common alternatives below:
| Feature | Dskyz (DAFE) | Typical TradingView Strategies|
|---------|-------------|------------------------------------------------------------|
| Regime Detection | Automatically identifies and adapts to **four** market regimes | Often static or limited to trend/range detection |
| Multi‑Timeframe Analysis | Uses higher‑timeframe RSI/MACD for confirmation | Rarely incorporates multi‑timeframe data |
| Pattern Recognition | Detects candlestick patterns **with volume confirmation** | Limited or no pattern recognition |
| Dynamic Risk Management | ATR‑based stops and trailing stops | Often uses fixed stops or basic risk rules |
| Performance Tracking | Adjusts thresholds based on past performance | Typically static parameters |
| Beginner‑Friendly Presets | Aggressive, Conservative, Optimized profiles | Requires manual parameter tuning |
| Visual Cues | Color‑coded backgrounds for regimes | Basic or no visual aids |
The Dskyz strategy’s ability to integrate regime detection, multi-timeframe analysis, and user-friendly presets makes it uniquely versatile and accessible, addressing the needs of everyday traders who want professional-grade tools without the complexity.
-Key Features and Benefits
[Why It’s Ideal for Everyday Traders
⚡The Dskyz (DAFE) AI Adaptive Regime - Pro democratizes advanced trading by offering professional-grade tools in an accessible package. Unlike many TradingView strategies that require deep technical knowledge or fail in changing market conditions, this strategy simplifies complex analysis while maintaining robustness. Its presets and visual aids make it easy for beginners to start, while its adaptive features and performance tracking appeal to advanced traders seeking an edge.
🔄Limitations and Considerations
Market Dependency: Performance varies by market and timeframe. Backtesting is essential to ensure compatibility with your trading style.
Learning Curve: While presets simplify use, understanding regimes and indicators enhances effectiveness.
No Guaranteed Profits: Like all strategies, success depends on market conditions and proper execution. The Reddit discussion highlights skepticism about TradingView strategies’ universal success (Reddit Discussion).
Instrument Specificity: Optimized for futures (e.g., ES, NQ) due to fixed tick values. Test on other instruments like stocks or forex to verify compatibility.
📌Conclusion
The Dskyz (DAFE) AI Adaptive Regime - Pro is a revolutionary TradingView strategy that empowers everyday traders with advanced, AI-driven tools. Its ability to adapt to market regimes, confirm signals across timeframes, and manage risk dynamically. sets it apart from typical strategies. By offering beginner-friendly presets and visual cues, it makes sophisticated trading accessible without sacrificing power. Whether you’re a novice looking to trade smarter or a pro seeking a competitive edge, this strategy is your ticket to mastering the markets. Add it to your chart, backtest it, and join the elite traders leveraging AI to dominate. Trade like a boss today! 🚀
Use it with discipline. Use it with clarity. Trade smarter.
**I will continue to release incredible strategies and indicators until I turn this into a brand or until someone offers me a contract.
-Dskyz

Moving Average Shift WaveTrend StrategyMoving Average Shift WaveTrend Strategy
🧭 Overview
The Moving Average Shift WaveTrend Strategy is a trend-following and momentum-based trading system designed to be overlayed on TradingView charts. It executes trades based on the confluence of multiple technical conditions—volatility, session timing, trend direction, and oscillator momentum—to deliver logical and systematic trade entries and exits.
🎯 Strategy Objectives
Enter trades aligned with the prevailing long-term trend
Exit trades on confirmed momentum reversals
Avoid false signals using session timing and volatility filters
Apply structured risk management with automatic TP, SL, and trailing stops
⚙️ Key Features
Selectable MA types: SMA, EMA, SMMA (RMA), WMA, VWMA
Dual-filter logic using a custom oscillator and moving averages
Session and volatility filters to eliminate low-quality setups
Trailing stop, configurable Take Profit / Stop Loss logic
“In-wave flag” prevents overtrading within the same trend wave
Visual clarity with color-shifting candles and entry/exit markers
📈 Trading Rules
✅ Long Entry Conditions:
Price is above the selected MA
Oscillator is positive and rising
200-period EMA indicates an uptrend
ATR exceeds its median value (sufficient volatility)
Entry occurs between 09:00–17:00 (exchange time)
Not currently in an active wave
🔻 Short Entry Conditions:
Price is below the selected MA
Oscillator is negative and falling
200-period EMA indicates a downtrend
All other long-entry conditions are inverted
❌ Exit Conditions:
Take Profit or Stop Loss is hit
Opposing signals from oscillator and MA
Trailing stop is triggered
🛡️ Risk Management Parameters
Pair: ETH/USD
Timeframe: 4H
Starting Capital: $3,000
Commission: 0.02%
Slippage: 2 pips
Risk per Trade: 2% of account equity (adjustable)
Total Trades: 224
Backtest Period: May 24, 2016 — April 7, 2025
Note: Risk parameters are fully customizable to suit your trading style and broker conditions.
🔧 Trading Parameters & Filters
Time Filter: Trades allowed only between 09:00–17:00 (exchange time)
Volatility Filter: ATR must be above its median value
Trend Filter: Long-term 200-period EMA
📊 Technical Settings
Moving Average
Type: SMA
Length: 40
Source: hl2
Oscillator
Length: 15
Threshold: 0.5
Risk Management
Take Profit: 1.5%
Stop Loss: 1.0%
Trailing Stop: 1.0%
👁️ Visual Support
MA and oscillator color changes indicate directional bias
Clear chart markers show entry and exit points
Trailing stops and risk controls are transparently managed
🚀 Strategy Improvements & Uniqueness
In-wave flag avoids repeated entries within the same trend phase
Filtering based on time, volatility, and trend ensures higher-quality trades
Dynamic high/low tracking allows precise trailing stop placement
Fully rule-based execution reduces emotional decision-making
💡 Inspirations & Attribution
This strategy is inspired by the excellent concept from:
ChartPrime – “Moving Average Shift”
It expands on the original idea with advanced trade filters and trailing logic.
Source reference:
📌 Summary
The Moving Average Shift WaveTrend Strategy offers a rule-based, reliable approach to trend trading. By combining trend and momentum filters with robust risk controls, it provides a consistent framework suitable for various market conditions and trading styles.
⚠️ Disclaimer
This script is for educational purposes only. Trading involves risk. Always use proper backtesting and risk evaluation before applying in live markets.

EMA & MA Crossover StrategyGuys, you asked, we did. Strategy for crossing moving averages .
The Moving Average Crossover trading strategy is possibly the most popular
trading strategy in the world of trading. First of them were written in the
middle of XX century, when commodities trading strategies became popular.
This strategy is a good example of so-called traditional strategies.
Traditional strategies are always long or short. That means they are never
out of the market. The concept of having a strategy that is always long or
short may be scary, particularly in today’s market where you don’t know what
is going to happen as far as risk on any one market. But a lot of traders
believe that the concept is still valid, especially for those of traders who
do their own research or their own discretionary trading.
This version uses crossover of moving average and its exponential moving average.
Strategy parameters:
Take Profit % - when it receives the opposite signal
Stop Loss % - when it receives the opposite signal
Current Backtest:
Account: 1000$
Trading size: 0.01
Commission: 0.05%
WARNING:
- For purpose educate only
- This script to change bars colors.
Dskyz (DAFE) MAtrix with ATR-Powered Precision Dskyz (DAFE) MAtrix with ATR-Powered Precision
This cutting‐edge futures trading strategy built to thrive in rapidly changing market conditions. Developed for high-frequency futures trading on instruments such as the CME Mini MNQ, this strategy leverages a matrix of sophisticated moving averages combined with ATR-based filters to pinpoint high-probability entries and exits. Its unique combination of adaptable technical indicators and multi-timeframe trend filtering sets it apart from standard strategies, providing enhanced precision and dynamic responsiveness.
imgur.com
Core Functional Components
1. Advanced Moving Averages
A distinguishing feature of the DAFE strategy is its robust, multi-choice moving averages (MAs). Clients can choose from a wide array of MAs—each with specific strengths—in order to fine-tune their trading signals. The code includes user-defined functions for the following MAs:
imgur.com
Hull Moving Average (HMA):
The hma(src, len) function calculates the HMA by using weighted moving averages (WMAs) to reduce lag considerably while smoothing price data. This function computes an intermediate WMA of half the specified length, then a full-length WMA, and finally applies a further WMA over the square root of the length. This design allows for rapid adaptation to price changes without the typical delays of traditional moving averages.
Triple Exponential Moving Average (TEMA):
Implemented via tema(src, len), TEMA uses three consecutive exponential moving averages (EMAs) to effectively cancel out lag and capture price momentum. The final formula—3 * (ema1 - ema2) + ema3—produces a highly responsive indicator that filters out short-term noise.
Double Exponential Moving Average (DEMA):
Through the dema(src, len) function, DEMA calculates an EMA and then a second EMA on top of it. Its simplified formula of 2 * ema1 - ema2 provides a smoother curve than a single EMA while maintaining enhanced responsiveness.
Volume Weighted Moving Average (VWMA):
With vwma(src, len), this MA accounts for trading volume by weighting the price, thereby offering a more contextual picture of market activity. This is crucial when volume spikes indicate significant moves.
Zero Lag EMA (ZLEMA):
The zlema(src, len) function applies a correction to reduce the inherent lag found in EMAs. By subtracting a calculated lag (based on half the moving average window), ZLEMA is exceptionally attuned to recent price movements.
Arnaud Legoux Moving Average (ALMA):
The alma(src, len, offset, sigma) function introduces ALMA—a type of moving average designed to be less affected by outliers. With parameters for offset and sigma, it allows customization of the degree to which the MA reacts to market noise.
Kaufman Adaptive Moving Average (KAMA):
The custom kama(src, len) function is noteworthy for its adaptive nature. It computes an efficiency ratio by comparing price change against volatility, then dynamically adjusts its smoothing constant. This results in an MA that quickly responds during trending periods while remaining smoothed during consolidation.
Each of these functions—integrated into the strategy—is selectable by the trader (via the fastMAType and slowMAType inputs). This flexibility permits the tailored application of the MA most suited to current market dynamics and individual risk management preferences.
2. ATR-Based Filters and Risk Controls
ATR Calculation and Volatility Filter:
The strategy computes the Average True Range (ATR) over a user-defined period (atrPeriod). ATR is then used to derive both:
Volatility Assessment: Expressed as a ratio of ATR to closing price, ensuring that trades are taken only when volatility remains within a safe, predefined threshold (volatilityThreshold).
ATR-Based Entry Filters: Implemented as atrFilterLong and atrFilterShort, these conditions ensure that for long entries the price is sufficiently above the slow MA and vice versa for shorts. This acts as an additional confirmation filter.
Dynamic Exit Management:
The exit logic employs a dual approach:
Fixed Stop and Profit Target: Stops and targets are set at multiples of ATR (fixedStopMultiplier and profitTargetATRMult), helping manage risk in volatile markets.
Trailing Stop Adjustments: A trailing stop is calculated using the ATR multiplied by a user-defined offset (trailOffset), which captures additional profits as the trade moves favorably while protecting against reversals.
3. Multi-Timeframe Trend Filtering
The strategy enhances its signal reliability by leveraging a secondary, higher timeframe analysis:
15-Minute Trend Analysis:
By retrieving 15-minute moving averages (fastMA15m and slowMA15m) via request.security, the strategy determines the broader market trend. This secondary filter (enabled or disabled through useTrendFilter) ensures that entries are aligned with the prevailing market direction, thereby reducing the incidence of false signals.
4. Signal and Execution Logic
Combined MA Alignment:
The entry conditions are based primarily on the alignment of the fast and slow MAs. A long condition is triggered when the current price is above both MAs and the fast MA is above the slow MA—complemented by the ATR filter and volume conditions. The reverse applies for a short condition.
Volume and Time Window Validation:
Trades are permitted only if the current volume exceeds a minimum (minVolume) and the current hour falls within the predefined trading window (tradingStartHour to tradingEndHour). An additional volume spike check (comparing current volume to a moving average of past volumes) further filters for optimal market conditions.
Comprehensive Order Execution:
The strategy utilizes flexible order execution functions that allow pyramiding (up to 10 positions), ensuring that it can scale into positions as favorable conditions persist. The use of both market entries and automated exits (with profit targets, stop-losses, and trailing stops) ensures that risk is managed at every step.
5. Integrated Dashboard and Metrics
For transparency and real-time analysis, the strategy includes:
On-Chart Visualizations:
Both fast and slow MAs are plotted on the chart, making it easy to see the market’s technical foundation.
Dynamic Metrics Dashboard:
A built-in table displays crucial performance statistics—including current profit/loss, equity, ATR (both raw and as a percentage), and the percentage gap between the moving averages. These metrics offer immediate insight into the health and performance of the strategy.
Input Parameters: Detailed Breakdown
Every input is meticulously designed to offer granular control:
Fast & Slow Lengths:
Determine the window size for the fast and slow moving averages. Smaller values yield more sensitivity, while larger values provide a smoother, delayed response.
Fast/Slow MA Types:
Choose the type of moving average for fast and slow signals. The versatility—from basic SMA and EMA to more complex ones like HMA, TEMA, ZLEMA, ALMA, and KAMA—allows customization to fit different market scenarios.
ATR Parameters:
atrPeriod and atrMultiplier shape the volatility assessment, directly affecting entry filters and risk management through stop-loss and profit target levels.
Trend and Volume Filters:
Inputs such as useTrendFilter, minVolume, and the volume spike condition help confirm that a trade occurs in active, trending markets rather than during periods of low liquidity or market noise.
Trading Hours:
Restricting trade execution to specific hours (tradingStartHour and tradingEndHour) helps avoid illiquid or choppy markets outside of prime trading sessions.
Exit Strategies:
Parameters like trailOffset, profitTargetATRMult, and fixedStopMultiplier provide multiple layers of risk management and profit protection by tailoring how exits are generated relative to current market conditions.
Pyramiding and Fixed Trade Quantity:
The strategy supports multiple entries within a trend (up to 10 positions) and sets a predefined trade quantity (fixedQuantity) to maintain consistent exposure and risk per trade.
Dashboard Controls:
The resetDashboard input allows for on-the-fly resetting of performance metrics, keeping the strategy’s performance dashboard accurate and up-to-date.
Why This Strategy is Truly Exceptional
Multi-Faceted Adaptability:
The ability to switch seamlessly between various moving average types—each suited to particular market conditions—enables the strategy to adapt dynamically. This is a testament to the high level of coding sophistication and market insight infused within the system.
Robust Risk Management:
The integration of ATR-based stops, profit targets, and trailing stops ensures that every trade is executed with well-defined risk parameters. The system is designed to mitigate unexpected market swings while optimizing profit capture.
Comprehensive Market Filtering:
By combining moving average crossovers with volume analysis, volatility thresholds, and multi-timeframe trend filters, the strategy only enters trades under the most favorable conditions. This multi-layered filtering reduces noise and enhances signal quality.
-Final Thoughts-
The Dskyz Adaptive Futures Elite (DAFE) MAtrix with ATR-Powered Precision strategy is not just another trading algorithm—it is a multi-dimensional, fully customizable system built on advanced technical principles and sophisticated risk management techniques. Every function and input parameter has been carefully engineered to provide traders with a system that is both powerful and transparent.
For clients seeking a state-of-the-art trading solution that adapts dynamically to market conditions while maintaining strict discipline in risk management, this strategy truly stands in a class of its own.
****Please show support if you enjoyed this strategy. I'll have more coming out in the near future!!
-Dskyz
Caution
DAFE is experimental, not a profit guarantee. Futures trading risks significant losses due to leverage. Backtest, simulate, and monitor actively before live use. All trading decisions are your responsibility.

Heiken Ashi Supertrend ADX - StrategyHeiken Ashi Supertrend ADX Strategy
Overview
This strategy combines the power of Heiken Ashi candles, Supertrend indicator, and ADX filter to identify strong trend movements across multiple timeframes. Designed primarily for the cryptocurrency market but adaptable to any tradable asset, this system focuses on capturing momentum in established trends while employing a sophisticated triple-layer stop loss mechanism to protect capital and secure profits.
Strategy Mechanics
Entry Signals
The strategy uses a unique blend of technical signals to identify high-probability trade entries:
Heiken Ashi Candles: Looks specifically for Heiken Ashi candles with minimal or no wicks, which signal strong momentum and trend continuation. These "full-bodied" candles represent periods where price moved decisively in one direction with minimal retracement.
Supertrend Filter : Confirms the underlying trend direction using the Supertrend indicator (default factor: 3.0, ATR period: 10). Entries are aligned with the prevailing Supertrend direction.
ADX Filter (Optional) : Can be enabled to focus only on stronger trending conditions, filtering out choppy or ranging markets. When enabled, trades only trigger when ADX is above the specified threshold (default: 25).
Exit Signals
Positions are closed when either:
An opposing signal appears (Heiken Ashi candle with no wick in the opposite direction)
Any of the three stop loss mechanisms are triggered
Triple-Layer Stop Loss System
The strategy employs a sophisticated three-tier stop loss approach:
ATR Trailing Stop: Adapts to market volatility and locks in profits as the trend extends. This stop moves in the direction of the trade, capturing profit without exiting too early during normal price fluctuations.
Swing Point Stop : Uses natural market structure (recent highs/lows over a lookback period) to place stops at logical support/resistance levels, honoring the market's own rhythm.
Insurance Stop: A percentage-based safety net that protects against sudden adverse moves immediately after entry. This is particularly valuable when the swing point stop might be positioned too far from entry, providing immediate capital protection.
Optimization Features
Customizable Filters: All components (Supertrend, ADX) can be enabled/disabled to adapt to different market conditions
Adjustable Parameters: Fine-tune ATR periods, Supertrend factors, and ADX thresholds
Flexible Stop Loss Settings: Each of the three stop loss mechanisms can be individually enabled/disabled with customizable parameters
Best Practices for Implementation
Recommended Timeframes: Works best on 4-hour charts and above, where trends develop more reliably
Market Conditions: Performs well across various market conditions due to the ADX filter's ability to identify meaningful trends
Position Sizing: The strategy uses a percentage of equity approach (default: 3%) for position sizing
Performance Characteristics
When properly optimized, this strategy has demonstrated profit factors exceeding 3 in backtesting. The approach typically produces generous winners while limiting losses through its multi-layered stop loss system. The ATR trailing stop is particularly effective at capturing extended trends, while the insurance stop provides immediate protection against adverse moves.
The visual components on the chart make it easy to follow the strategy's logic, with position status, entry prices, and current stop levels clearly displayed.
This strategy represents a complete trading system with clearly defined entry and exit rules, adaptive stop loss mechanisms, and built-in risk management through position sizing.

TrendTwisterV1.5 (Forex Ready + Indicators)A Precision Trend-Following TradingView Strategy for Forex**
HullShiftFX is a Pine Script strategy for TradingView that combines the power of the **Hull Moving Average (HMA)** and a **shifted Exponential Moving Average (EMA)** with multi-layered momentum filters including **RSI** and **dual Stochastic Oscillators**.
It’s designed for traders looking to catch high-probability breakouts with tight risk management and visual clarity.
Chart settings:
1. Select "Auto - Fits data to screen"
2. Please Select "Scale Price Chart Only" (To make the chart not squished)
### ✅ Entry Conditions
**Long Position:**
- Price closes above the 12-period Hull Moving Average.
- Price closes above the 5-period EMA shifted forward by 2 bars.
- RSI is above 50.
- Stochastic Oscillator (12,3,3) %K is above 50.
- Stochastic Oscillator (5,3,3) %K is above 50.
- Hull MA crosses above the shifted EMA.
**Short Position:**
- Price closes below the 12-period Hull Moving Average.
- Price closes below the 5-period EMA shifted forward by 2 bars.
- RSI is below 50.
- Stochastic Oscillator (12,3,3) %K is below 50.
- Stochastic Oscillator (5,3,3) %K is below 50.
- Hull MA crosses below the shifted EMA.
---
## 📉 Risk Management
- **Stop Loss:** Set at the low (for long) or high (for short) of the previous 2 candles.
- **Take Profit:** Calculated at a risk/reward ratio of **1.65x** the stop loss distance.
---
## 📊 Indicators Used
- **Hull Moving Average (12)**
- **Exponential Moving Average (5) **
- **Relative Strength Index (14)**
- **Stochastic Oscillators:**
- %K (12,3,3)
- %K (5,3,3)

NY First Candle Break and RetestStrategy Overview
Session and Time Parameters:
The strategy focuses on the New York trading session, starting at 9:30 AM and lasting for a predefined session length, typically 3 to 4 hours. This timing captures the most active market hours, providing ample trading opportunities.
Strategy Parameters:
Utilizes the Average True Range (ATR) to set dynamic stop-loss levels, ensuring risk is managed according to market volatility.
Employs a reward-to-risk ratio to determine take profit levels, aiming for a balanced approach between potential gains and losses.
Strategy Settings:
Incorporates simple moving averages (EMA) and the Volume Weighted Average Price (VWAP) to identify trend direction and price levels.
Volume confirmation is used to validate breakouts, ensuring trades are based on significant market activity.
Trade Management:
Features a trailing stop mechanism to lock in profits as the trade moves in favor, with multiple take profit levels to secure gains incrementally.
The strategy is designed to handle both long and short positions, adapting to market conditions.
Alert Settings:
Provides alerts for key events such as session start, breakout, retest, and entry signals, helping traders stay informed and act promptly.
Visual cues on the chart highlight entry and exit points, making it easier for beginners to follow the strategy.
This strategy is particularly suited for the current volatile market environment, where simplicity and clear guidelines can help beginner traders navigate the complexities of trading. It emphasizes risk management and uses straightforward indicators to make informed trading decisions.
I put together this Trading View scalping strategy for futures markets with some help from Claude AI. Shoutout to everyone who gave me advice along the way—I really appreciate it! I’m sure there’s room for improvement, so feel free to share your thoughts… just go easy on me. :)

Dskyz Adaptive Futures Elite (DAFE)Dskyz Adaptive Futures Edge (DAFE)
imgur.com
A Dynamic Futures Trading Strategy
DAFE adapts to market volatility and price action using technical indicators and advanced risk management. It’s built for high-stakes futures trading (e.g., MNQ, BTCUSDT.P), offering modular logic for scalpers and swing traders alike.
Key Features
Adaptive Moving Averages
Dynamic Logic: Fast and slow SMAs adjust lengths via ATR, reacting to momentum shifts and smoothing in calm markets.
Signals: Long entry on fast SMA crossing above slow SMA with price confirmation; short on cross below.
RSI Filtering (Optional)
Momentum Check: Confirms entries with RSI crossovers (e.g., above oversold for longs). Toggle on/off with custom levels.
Fine-Tuning: Adjustable lookback and thresholds (e.g., 60/40) for precision.
Candlestick Pattern Recognition
Eng|Enhanced Detection: Identifies strong bullish/bearish engulfing patterns, validated by volume and range strength (vs. 10-period SMA).
Conflict Avoidance: Skips trades if both patterns appear in the lookback window, reducing whipsaws.
Multi-Timeframe Trend Filter
15-Minute Alignment: Syncs intrabar trades with 15-minute SMA trends; optional for flexibility.
Dollar-Cost Averaging (DCA) New!
Scaling: Adds up to a set number of entries (e.g., 4) on pullbacks/rallies, spaced by ATR multiples.
Control: Caps exposure and resets on exit, enhancing trend-following potential.
Trade Execution & Risk Management
Entry Rules: Prioritizes moving averages or patterns (user choice), with volume, volatility, and time filters.
Stops & Trails:
Initial Stop: ATR-based (2–3.5x, volatility-adjusted).
Trailing Stop: Locks profits with configurable ATR offset and multiplier.
Discipline
Cooldown: Pauses post-exit (e.g., 0–5 minutes).
Min Hold: Ensures trades last a set number of bars (e.g., 2–10).
Visualization & Tools
Charts: Overlays MAs, stops, and signals; trend shaded in background.
Dashboard: Shows position, P&L, win rate, and more in real-time.
Debugging: Logs signal details for optimization.
Input Parameters
Parameter Purpose Suggested Use
Use RSI Filter - Toggle RSI confirmation *Disable 4 price-only
trading
RSI Length - RSI period (e.g., 14) *7–14 for sensitivity
RSI Overbought/Oversold - Adjust for market type *Set levels (e.g., 60/40)
Use Candlestick Patterns - Enables engulfing signals *Disable for MA focus
Pattern Lookback - Pattern window (e.g., 19) *10–20 bars for balance
Use 15m Trend Filter - Align with 15-min trend *Enable for trend trades
Fast/Slow MA Length - Base MA lengths (e.g., 9/19) *10–25 / 30–60 per
timeframe
Volatility Threshold - Filters volatile spikes *Max ATR/close (e.g., 1%)
Min Volume - Entry volume threshold *Avoid illiquid periods
(e.g., 10)
ATR Length - ATR period (e.g., 14) *Standard volatility
measure
Trailing Stop ATR Offset - Trail distance (e.g., 0.5) *0.5–1.5 for tightness
Trailing Stop ATR Multi - Trail multiplier (e.g., 1.0) *1–3 for trend room
Cooldown Minutes - Post-exit pause (e.g., 0–5) *Prevents overtrading
Min Bars to Hold - Min trade duration (e.g., 2) *5–10 for intraday
Trading Hours - Active window (e.g., 9–16) *Focus on key sessions
Use DCA - Toggle DCA *Enable for scaling
Max DCA Entries - Cap entries (e.g., 4) *Limit risk exposure
DCA ATR Multiplier Entry spacing (e.g., 1.0) *1–2 for wider gaps
Compliance
Realistic Testing: Fixed quantities, capital, and slippage for accurate backtests.
Transparency: All logic is user-visible and adjustable.
Risk Controls: Cooldowns, stops, and hold periods ensure stability.
Flexibility: Adapts to various futures and timeframes.
Summary
DAFE excels in volatile futures markets with adaptive logic, DCA scaling, and robust risk tools. Currently in prop account testing, it’s a powerful framework for precision trading.
Caution
DAFE is experimental, not a profit guarantee. Futures trading risks significant losses due to leverage. Backtest, simulate, and monitor actively before live use. All trading decisions are your responsibility.

Fibonacci Counter-Trend TradingOverview:
The Fibonacci Counter-Trend Trading strategy is designed to capitalize on price reversals by utilizing Fibonacci levels calculated from the standard deviation of price movements. This strategy opens a sell order when the closing price crosses above a specified upper Fibonacci level and a buy order when the closing price crosses below a specified lower Fibonacci level. By leveraging the principles of Fibonacci retracement and volatility, this strategy aims to identify potential reversal points in the market.
How It Works:
Fibonacci Levels Calculation:
The strategy calculates upper and lower Fibonacci levels based on the standard deviation of the price over a specified moving average length. These levels are derived from the Fibonacci sequence, which is widely used in technical analysis to identify potential support and resistance levels.
The upper levels are calculated by adding specific Fibonacci ratios (0.236, 0.382, 0.5, 0.618, 0.764, and 1.0) multiplied by the standard deviation to the basis (the volume-weighted moving average).
The lower levels are calculated by subtracting the same Fibonacci ratios multiplied by the standard deviation from the basis.
Trade Entry Rules:
Sell Order: A sell order is triggered when the closing price crosses above the selected upper Fibonacci level. This indicates a potential reversal point where the price may start to decline.
Buy Order: A buy order is initiated when the closing price crosses below the selected lower Fibonacci level. This suggests a potential reversal point where the price may begin to rise.
Trade Management:
The strategy includes stop-losses based on the Fibonacci levels to protect against adverse price movements.
How to Use:
Users can customize the moving average length and the multiplier for the standard deviation to suit their trading preferences and market conditions.
The strategy can be applied to various financial instruments, including stocks, forex, and cryptocurrencies, making it versatile for different trading environments.
Pros:
The Fibonacci Counter-Trend Trading strategy combines the mathematical principles of the Fibonacci sequence with the statistical measure of standard deviation, providing a unique approach to identifying potential market reversals.
This strategy is particularly useful in volatile markets where price swings can lead to significant trading opportunities.
The use of Fibonacci levels can help traders identify key support and resistance areas, enhancing decision-making.
Cons:
The strategy may generate false signals in choppy or sideways markets, leading to potential losses if the price does not reverse as anticipated.
Relying solely on Fibonacci levels without considering other technical indicators or market conditions may result in missed opportunities or increased risk.
The effectiveness of the strategy can vary depending on the chosen parameters (e.g., moving average length and standard deviation multiplier), requiring users to spend time optimizing these settings for different market conditions.
As with any counter-trend strategy, there is a risk of significant drawdowns during strong trending markets, where the price continues to move in one direction without reversing.
By understanding the mechanics of the Fibonacci Counter-Trend Trading strategy, along with its pros and cons, traders can effectively implement it in their trading routines and potentially enhance their trading performance.
[SM-042] EMA 5-8-13 with ADX FilterWhat is the strategy?
The strategy combines three exponential moving averages (EMAs) — 5, 8, and 13 periods — with an optional ADX (Average Directional Index) filter. It is designed to enter long or short positions based on EMA crossovers and to exit positions when the price crosses a specific EMA. The ADX filter, if enabled, adds a condition that only allows trades when the ADX value is above a certain threshold, indicating trend strength.
Who is it for?
This strategy is for traders leveraging EMAs and trend strength indicators to make trade decisions. It can be used by anyone looking for a simple trend-following strategy, with the flexibility to adjust for trend strength using the ADX filter.
When is it used?
- **Long trades**: When the 5-period EMA crosses above the 8-period EMA, with an optional ADX condition (if enabled) that requires the ADX value to be above a specified threshold.
- **Short trades**: When the 5-period EMA crosses below the 8-period EMA, with the ADX filter again optional.
- **Exits**: The strategy exits a long position when the price falls below the 13-period EMA and exits a short position when the price rises above the 13-period EMA.
Where is it applied?
This strategy is applied on a chart with any asset on TradingView, with the EMAs and ADX plotted for visual reference. The strategy uses `strategy.entry` to open positions and `strategy.close` to close them based on the set conditions.
Why is it useful?
This strategy helps traders identify trending conditions and filter out potential false signals by using both EMAs (to capture short-term price movements) and the ADX (to confirm the strength of the trend). The ADX filter can be turned off if not desired, making the strategy flexible for both trending and range-bound markets.
How does it work?
- **EMA Crossover**: The strategy enters a long position when the 5-period EMA crosses above the 8-period EMA, and enters a short position when the 5-period EMA crosses below the 8-period EMA.
- **ADX Filter**: If enabled, the strategy checks whether the ADX value is above a set threshold (default is 20) before allowing a trade.
- **Exit Conditions**: Long positions are closed when the price falls below the 13-period EMA, and short positions are closed when the price rises above the 13-period EMA.
- **Plotting**: The strategy plots the three EMAs and the ADX value on the chart for visualization. It also displays a horizontal line at the ADX threshold.
This setup allows for clear decision-making based on the interaction between different time-frame EMAs and trend strength as indicated by ADX.

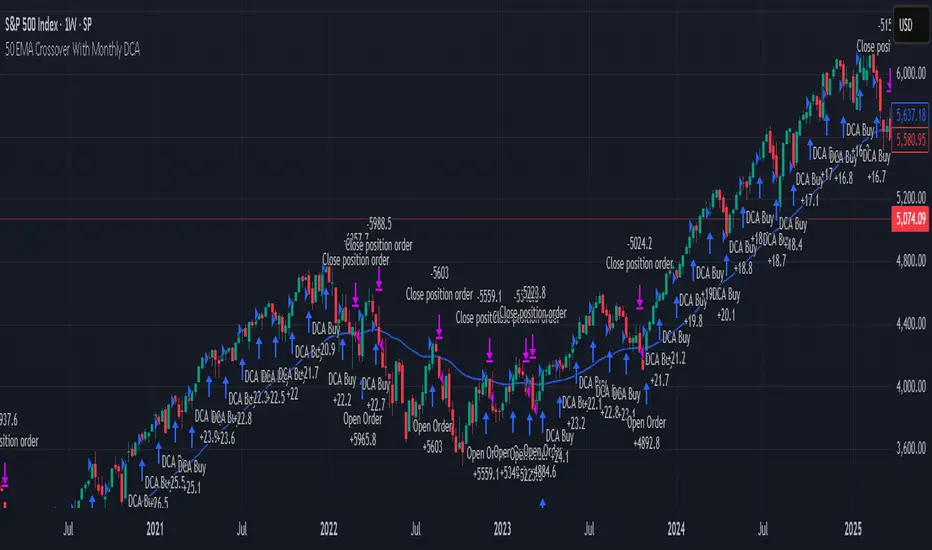
50 EMA Crossover With Monthly DCARecommended Chart Interval = 1W
Overview:
This strategy combines trend-following principles with dollar-cost averaging (DCA), aiming to efficiently deploy capital while minimizing market timing risk.
How It Works:
When the Long Condition is Not Met (i.e., Price < 50 EMA):
- If the price is below the 50 EMA, a fixed DCA amount is added to a cash reserve every month.
- This ensures that capital is consistently accumulated, even when the strategy isn't in a long position.
When the Long Condition is Met (i.e., Price > 50 EMA):
- A long position is opened when the price is above the 50 EMA.
- At this point, the entire capital, including the accumulated cash reserve, is deployed into the market.
- While the strategy is long, a DCA buy order is placed every month using the set DCA amount, continuously investing as the market conditions allow.
Exit Strategy:
If the price falls below the 50 EMA, the strategy closes all positions, and the cash reserve accumulation process begins again.
Key Benefits:
✔ Systematic Investing: Ensures consistent capital deployment while following trend signals.
✔ Cash Efficiency: Accumulates uninvested funds when conditions aren’t met and deploys them at optimal moments.
✔ Risk Management: Exits when the price trend weakens, protecting capital.
Conclusion:
This method allows for efficient capital growth by combining a trend-following approach with disciplined DCA, ensuring risk is managed while capital is deployed systematically at optimal points in the market. 🚀
Trailing Monster StrategyTrailing Monster Strategy
This is an experimental trend-following strategy that incorporates a custom adaptive moving average (PKAMA), RSI-based momentum filtering, and dynamic trailing stop-loss logic. It is designed for educational and research purposes only, and may require further optimization or risk management considerations prior to live deployment.
Strategy Logic
The strategy attempts to participate in sustained price trends by combining:
- A Power Kaufman Adaptive Moving Average (PKAMA) for dynamic trend detection,
- RSI and Simple Moving Average (SMA) filters for market condition confirmation,
- A delayed trailing stop-loss to manage exits once a trade is in profit.
Entry Conditions
Long Entry:
- RSI exceeds the overbought threshold (default: 70),
- Price is trading above the 200-period SMA,
- PKAMA slope is positive (indicating upward momentum),
- A minimum number of bars have passed since the last entry.
Short Entry:
- RSI falls below the oversold threshold (default: 30),
- Price is trading below the 200-period SMA,
- PKAMA slope is negative (indicating downward momentum),
-A minimum number of bars have passed since the last entry.
Exit Conditions
- A trailing stop-loss is applied once the position has been open for a user-defined number of bars.
- The trailing distance is calculated as a fixed percentage of the average entry price.
Technical Notes
This script implements a custom version of the Power Kaufman Adaptive Moving Average (PKAMA), conceptually inspired by alexgrover’s public implementation on TradingView .
Unlike traditional moving averages, PKAMA dynamically adjusts its responsiveness based on recent market volatility, allowing it to better capture trend changes in fast-moving assets like altcoins.
Disclaimer
This strategy is provided for educational purposes only.
It is not financial advice, and no guarantee of profitability is implied.
Always conduct thorough backtesting and forward testing before using any strategy in a live environment.
Adjust inputs based on your individual risk tolerance, asset class, and trading style.
Feedback is encouraged. You are welcome to fork and modify this script to suit your own preferences and market approach.

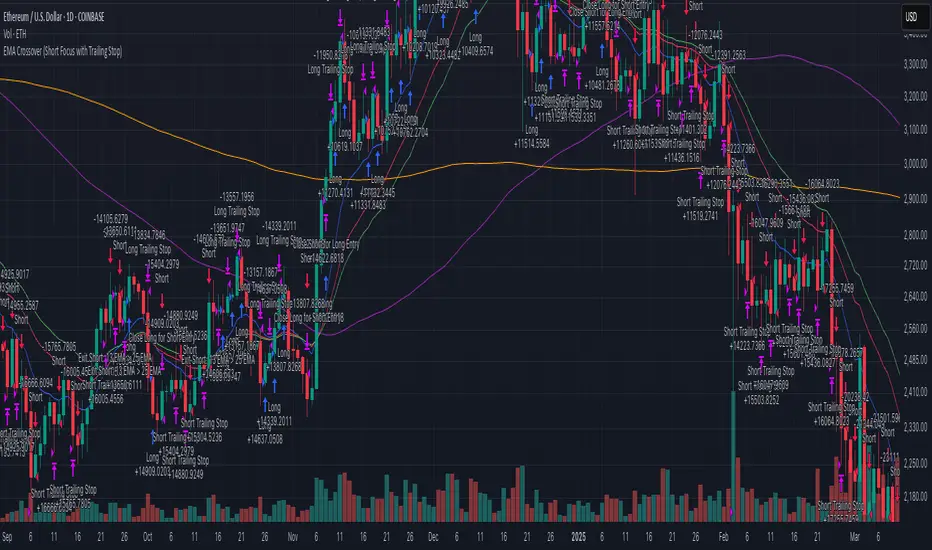
EMA Crossover (Short Focus with Trailing Stop)This strategy utilizes a combination of Exponential Moving Averages (EMA) and Simple Moving Averages (SMA) to generate entry and exit signals for both long and short positions. The core of the strategy is based on the 13-period EMA (short EMA) crossing the 33-period EMA (long EMA) for entering long trades, while a 13-period EMA crossing the 25-period EMA (mid EMA) generates short trade signals. The 100-period SMA and 200-period SMA serve as additional trend indicators to provide context for the market conditions. The strategy aims to capitalize on trend reversals and momentum shifts in the market.
The strategy is designed to execute trades swiftly with an emphasis on entering positions when conditions align in real time. For long entries, the strategy initiates a buy when the 13 EMA is greater than the 33 EMA, indicating a bullish trend. For short entries, the 13 EMA crossing below the 33 EMA signals a bearish trend, prompting a short position. Importantly, the code includes built-in exit conditions for both long and short positions. Long positions are exited when the 13 EMA falls below the 33 EMA, while short positions are closed when the 13 EMA crosses above the 25 EMA.
A key feature of the strategy is the use of trailing stops for both long and short positions. This dynamic exit method adjusts the stop level as the market moves in favor of the trade, locking in profits while reducing the risk of losses. The trailing stop for long positions is based on the high price of the current bar, while the trailing stop for short positions is set using the low price, providing more flexibility in managing risk. This trailing stop mechanism helps to capture profits from favorable market moves while ensuring that positions are exited if the market moves against them.
This strategy works best on the daily timeframe and is optimized for major cryptocurrency pairs. The daily chart allows for the EMAs to provide more reliable signals, as the strategy is designed to capture broader trends rather than short-term market fluctuations. Using it on major crypto pairs increases its effectiveness as these assets tend to have strong and sustained trends, providing better opportunities for the strategy to perform well.
ATM Option Selling StrategyATM Option Selling Strategy – Explained
This strategy is designed for intraday option selling based on the 9/15 EMA crossover, 50/80 MA trend filter, and RSI 50 level. It ensures that all trades are exited before market close (3:24 PM IST).
. Indicators Used:
9 EMA & 15 EMA → For short-term trend identification.
50 MA & 80 MA → To determine the overall trend.
RSI (14) → To confirm momentum (above or below 50 level).
2. Entry Conditions:
🔴 Sell ATM Call (CE) when:
Price is below 50 & 80 MA (Bearish trend).
9 EMA crosses below 15 EMA (Short-term trend turns bearish).
RSI is below 50 (Momentum confirms weakness).
🟢 Sell ATM Put (PE) when:
Price is above 50 & 80 MA (Bullish trend).
9 EMA crosses above 15 EMA (Short-term trend turns bullish).
RSI is above 50 (Momentum confirms strength).
3. Position Sizing & Risk Management:
Sell 375 quantity per trade (Lot size).
50-Point Stop Loss → If option premium moves against us by 50 points, exit.
50-Point Take Profit → If option premium moves in our favor by 50 points, book profit.
Exit all trades at 3:24 PM IST → No overnight positions.
4. Exit Conditions:
✅ Stop Loss or Take Profit Hits → Automatically exits based on a 50-point move.
✅ Time-Based Exit at 3:24 PM → Ensures no open positions at market close.
Why This Works?
✔ Trend Confirmation → 50/80 MA ensures we only sell options in the direction of the market trend.
✔ Momentum Confirmation → RSI prevents entering weak trades.
✔ Controlled Risk → SL and TP protect against large losses.
✔ No Overnight Risk → All trades close before market close.

VIDYA Auto-Trading(Reversal Logic)Overview
This script is a dynamic trend-following strategy based on the Variable Index Dynamic Average (VIDYA). It adapts in real time to market volatility, aiming to enhance entry precision and optimize risk management.
⚠️ This strategy is intended for educational and research purposes. Past performance does not guarantee future results. All results are based on historical simulations using fixed parameters.
Strategy Objectives
The objective of this strategy is to respond swiftly to sudden price movements and trend reversals, providing consistent and reliable trade signals under historical testing conditions. It is designed to be intuitive and efficient for traders of all levels.
Key Features
Momentum Sensitivity via VIDYA: Reacts quickly to momentum shifts, allowing for accurate trend-following entries.
Volatility-Based ATR Bands: Automatically adjusts stop levels and entry conditions based on current market volatility.
Intuitive Trend Visualization: Uptrends are marked with green zones, and downtrends with red zones, giving traders clear visual guidance.
Trading Rules
Long Entry: Triggered when price crosses above the upper band. Any existing short position is closed.
Short Entry: Triggered when price crosses below the lower band. Any existing long position is closed.
Exit Conditions: Positions are reversed based on signal changes, using a position reversal strategy.
Risk Management Parameters
Market: ETHUSD(5M)
Account Size: $3,000 (reasonable approximation for individual traders)
Commission: 0.02%
Slippage: 2 pip
Risk per Trade: 5% of account equity (adjusted to comply with TradingView guidelines for realistic risk levels)
Number of Trades: 251 (based on backtest over the selected dataset)
⚠️ The risk per trade and other values can be customized. Users are encouraged to adapt these to their individual needs and broker conditions.
Trading Parameters & Considerations
VIDYA Length: 10
VIDYA Momentum: 20
Distance factor for upper/lower bands: 2
Source: close
Visual Support
Trend zones, entry points, and directional shifts are clearly plotted on the chart. These visual cues enhance the analytical experience and support faster decision-making.
Visual elements are designed to improve interpretability and are not intended as financial advice or trade signals.
Strategy Improvements & Uniqueness
Inspired by the public work of BigBeluga, this script evolves the original concept with meaningful enhancements. By combining VIDYA and ATR bands, it offers greater adaptability and practical value compared to conventional trend-following strategies.
This adaptation is original work and not a direct copy. Improvements are designed to enhance usability, risk control, and market responsiveness.
Summary
This strategy offers a responsive and adaptive approach to trend trading, built on momentum detection and volatility-adjusted risk management. It balances clarity, precision, and practicality—making it a powerful tool for traders seeking reliable trend signals.
⚠️ All results are based on historical data and are subject to change under different market conditions. This script does not guarantee profit and should be used with caution and proper risk management.

Supertrend + MACD CrossoverKey Elements of the Template:
Supertrend Settings:
supertrendFactor: Adjustable to control the sensitivity of the Supertrend.
supertrendATRLength: ATR length used for Supertrend calculation.
MACD Settings:
macdFastLength, macdSlowLength, macdSignalSmoothing: These settings allow you to fine-tune the MACD for better results.
Risk Management:
Stop-Loss: The stop-loss is based on the ATR (Average True Range), a volatility-based indicator.
Take-Profit: The take-profit is based on the risk-reward ratio (set to 3x by default).
Both stop-loss and take-profit are dynamic, based on ATR, which adjusts according to market volatility.
Buy and Sell Signals:
Buy Signal: Supertrend is bullish, and MACD line crosses above the Signal line.
Sell Signal: Supertrend is bearish, and MACD line crosses below the Signal line.
Visual Elements:
The Supertrend line is plotted in green (bullish) and red (bearish).
Buy and Sell signals are shown with green and red triangles on the chart.
Next Steps for Optimization:
Backtesting:
Run backtests on BTC in the 5-minute timeframe and adjust parameters (Supertrend factor, MACD settings, risk-reward ratio) to find the optimal configuration for the 60% win ratio.
Fine-Tuning Parameters:
Adjust supertrendFactor and macdFastLength to find more optimal values based on BTC's market behavior.
Tweak the risk-reward ratio to maximize profitability while maintaining a good win ratio.
Evaluate Market Conditions:
The performance of the strategy can vary based on market volatility. It may be helpful to evaluate performance in different market conditions or pair it with a filter like RSI or volume.
Let me know if you'd like further tweaks or explanations!

Triangular Hull Moving Average [BigBeluga X PineIndicators]This strategy is based on the original Triangular Hull Moving Average (THMA) + Volatility indicator by BigBeluga. Full credit for the concept and design goes to BigBeluga.
The strategy blends smoothed trend-following logic using a Triangular Hull Moving Average with dynamic volatility overlays, providing actionable trade signals with responsive visual feedback. It's designed for traders who want a non-lagging trend filter while also monitoring market volatility in real time.
How the Strategy Works
1. Triangular Hull Moving Average (THMA) Core
At its core, the strategy uses a Triangular Hull Moving Average (THMA) — a variation of the traditional Hull Moving Average with triple-smoothing logic:
It combines multiple weighted moving averages (WMAs) to create a faster and smoother trend line.
This reduces lag without compromising trend accuracy.
The THMA reacts more responsively to price movements than classic MAs.
THMA Formula:
thma(_src, _length) =>
ta.wma(ta.wma(_src,_length / 3) * 3 - ta.wma(_src, _length / 2) - ta.wma(_src, _length), _length)
This logic filters out short-term noise while still being sensitive to genuine trend shifts.
2. Volatility-Enhanced Candle Plotting
An optional volatility mode overlays the chart with custom candles that incorporate volatility bands:
Wicks expand and contract dynamically based on market volatility.
The volatility value is computed using a HMA of high-low range over a user-defined length.
The candle bodies reflect THMA values, while the wicks reflect the current volatility spread.
This feature allows traders to visually gauge the strength of price moves and anticipate possible breakouts or slowdowns.
3. Trend Reversal Signal Detection
The strategy identifies trend reversals when the THMA line crosses over/under its own past value:
A bullish signal is triggered when THMA crosses above its value from two bars ago.
A bearish signal is triggered when THMA crosses below its value from two bars ago.
These shifts are marked on the chart with triangle-shaped signals for clear visibility.
This logic helps detect momentum shifts early and enables reactive trade entries.
Trade Entry & Exit Logic
Trade Modes Supported
Users can choose between:
Only Long – Enters long trades only.
Only Short – Enters short trades only.
Long & Short – Enables both directions.
Entry Conditions
Long Entry:
Triggered when a bullish crossover is detected.
Active only if the strategy mode allows long trades.
Short Entry:
Triggered when a bearish crossover is detected.
Active only if the strategy mode allows short trades.
Exit Conditions
In Only Long mode, the strategy closes long positions when a bearish signal appears.
In Only Short mode, the strategy closes short positions when a bullish signal appears.
In Long & Short mode, the strategy does not auto-close positions — instead, it opens new positions on each confirmed signal.
Dashboard Visualization
In the bottom-right corner of the chart, a live dashboard displays:
The current trend direction (🢁 for bullish, 🢃 for bearish).
The current volatility level as a percentage.
This helps traders quickly assess market status and adjust their decisions accordingly.
Customization Options
THMA Length: Adjust how smooth or reactive the trend detection should be.
Volatility Toggle & Length: Enable or disable volatility visualization and set sensitivity.
Color Settings: Choose colors for up/down trend visualization.
Trade Direction Mode: Limit the strategy to long, short, or both types of trades.
Use Cases & Strategy Strengths
1. Trend Following
Use the THMA-based candles and triangle signals to enter with momentum. The indicator adapts quickly, reducing lag and improving trade timing.
2. Volatility Monitoring
Visualize the strength of the trend with volatility wicks. Use expanding bands to confirm breakouts and contracting ones to detect weakening moves.
3. Signal Confirmation
Combine this tool with other indicators or use the trend shift triangles as confirmations for manual entries.
Conclusion
The THMA + Volatility Strategy is a non-repainting trend-following system that integrates:
Triangular Hull MA for advanced trend detection.
Real-time volatility visualization.
Clear entry signals based on trend reversals.
Configurable trade direction settings.
It is ideal for traders who:
Prefer smoothed price analysis.
Want to follow trends with precision.
Value visual volatility feedback for breakout detection.
Full credit for the original concept and indicator goes to BigBeluga.

Litecoin Trailing-Stop StrategyAltcoins Trailing-Stop Strategy
This strategy is based on a momentum breakout approach using PKAMA (Powered Kaufman Adaptive Moving Average) as a trend filter, and a delayed trailing stop mechanism to manage risk effectively.
It has been designed and fine-tuned Altcoins, which historically shows consistent volatility patterns and clean trend structures, especially on intraday timeframes like 15m and 30m.
Strategy Logic:
Entry Conditions:
Long when PKAMA indicates an upward move
Short when PKAMA detects a downward trend
Minimum spacing of 30 bars between trades to avoid overtrading
Trailing Stop:
Activated only after a customizable delay (delayBars)
User can set trailing stop % and delay independently
Helps avoid premature exits due to short-term volatility
Customizable Parameters:
This strategy uses a custom implementation of PKAMA (Powered Kaufman Adaptive Moving Average), inspired by the work of alexgrover
PKAMA is a volatility-aware moving average that adjusts dynamically to market conditions, making it ideal for altcoins where trend strength and direction change frequently.
This script is for educational and experimental purposes only. It is not financial advice. Please test thoroughly before using it in live conditions, and always adapt parameters to your specific asset and time frame.
Feedback is welcome! Feel free to clone and adapt it for your own trading style.

Long Term Profitable Swing | AbbasA Story of a Profitable Swing Trading Strategy
Imagine you're sailing across the ocean, looking for the perfect wave to ride. Swing trading is quite similar—you're navigating the stock market, searching for the ideal moments to enter and exit trades. This strategy, created by Abbas, helps you find those waves and ride them effectively to profitable outcomes.
🌊 Finding the Perfect Wave (Entry)
Our journey begins with two simple signs that tell us a great trading opportunity is forming:
- Moving Averages: We use two lines that follow price trends—the faster one (EMA 16) reacts quickly to recent price moves, and the slower one (EMA 30) gives us a longer-term perspective. When the faster line crosses above the slower line, it's like a clear signal saying, "Hey! The wave is rising, and prices might move higher!"
- RSI Momentum: Next, we check a tool called the RSI, which measures momentum (how strongly prices are moving). If the RSI number is above 50, it means there's enough strength behind this rising wave to carry us forward.
When both signals appear together, that's our green light. It's time to jump on our surfboard and start riding this promising wave.
⚓ Safely Riding the Wave (Risk Management)
While we're riding this wave, we want to ensure we're safe from sudden surprises. To do this, we use something called the Average True Range (ATR), which measures how volatile (or bumpy) the price movements are:
- Stop-Loss: To avoid falling too hard, we set a safety line (stop-loss) 8 times the ATR below our entry price. This helps ensure we exit if the wave suddenly turns against us, protecting us from heavy losses.
- Take Profit: We also set a goal to exit the trade at 11 times the ATR above our entry. This way, we capture significant profits when the wave reaches a nice high point.
🌟 Multiple Rides, Bigger Adventures
This strategy allows us to take multiple positions simultaneously—like riding several waves at once, up to 5. Each trade we make uses only 10% of our trading capital, keeping risks manageable and giving us multiple opportunities to win big.
🗺️ Easy to Follow Settings
Here are the basic settings we use:
- Fast EMA**: 16
- Slow EMA**: 30
- RSI Length**: 9
- RSI Threshold**: 50
- ATR Length**: 21
- ATR Stop-Loss Multiplier**: 8
- ATR Take-Profit Multiplier**: 11
These settings are flexible—you can adjust them to better suit different markets or your personal trading style.
🎉 Riding the Waves of Success
This simple yet powerful swing trading approach helps you confidently enter trades, clearly know when to exit, and effectively manage your risk. It’s a reliable way to ride market waves, capture profits, and minimize losses.
Happy trading, and may you find many profitable waves to ride! 🌊✨
Please test, and take into account that it depends on taking multiple longs within the swing, and you only get to invest 25/30% of your equity.

EMA 10/55/200 - LONG ONLY MTF (4h with 1D & 1W confirmation)Title: EMA 10/55/200 - Long Only Multi-Timeframe Strategy (4h with 1D & 1W confirmation)
Description:
This strategy is designed for trend-following long entries using a combination of exponential moving averages (EMAs) on the 4-hour chart, confirmed by higher timeframe trends from the daily (1D) and weekly (1W) charts.
🔍 How It Works
🔹 Entry Conditions (4h chart):
EMA 10 crosses above EMA 55 and price is above EMA 55
OR
EMA 55 crosses above EMA 200
OR
EMA 10 crosses above EMA 500
These entries indicate short-term momentum aligning with medium/long-term trend strength.
🔹 Confirmation (multi-timeframe alignment):
Daily (1D): EMA 55 is above EMA 200
Weekly (1W): EMA 55 is above EMA 200
This ensures that we only enter long trades when the higher timeframes support an uptrend, reducing false signals during sideways or bearish markets.
🛑 Exit Conditions
Bearish crossover of EMA 10 below EMA 200 or EMA 500
Stop Loss: 5% below entry price
⚙️ Backtest Settings
Capital allocation per trade: 10% of equity
Commission: 0.1%
Slippage: 2 ticks
These are realistic conditions for crypto, forex, and stocks.
📈 Best Used On
Timeframe: 4h
Instruments: Trending markets like BTC/ETH, FX majors, or growth stocks
Works best in volatile or trending environments
⚠️ Disclaimer
This is a backtest tool and educational resource. Always validate on demo accounts before applying to real capital. Do your own due diligence.

Reversal & Breakout Strategy with ORB### Reversal & Breakout Strategy with ORB
This strategy combines three distinct trading approaches—reversals, trend breakouts, and opening range breakouts (ORB)—into a single, cohesive system. The goal is to capture high-probability setups across different market conditions, leveraging a mashup of technical indicators for confirmation and risk management. Below, I’ll explain why this combination works, how the components interact, and how to use it effectively.
#### Why the Mashup?
- **Reversals**: Identifies overextended moves using RSI (overbought/oversold) and SMA50 crosses, filtered by VWAP and SMA200 trend direction. This targets mean-reversion opportunities in trending markets.
- **Breakouts**: Uses EMA9/EMA20 crossovers with VWAP and SMA200 confirmation to catch momentum-driven trend continuations.
- **Opening Range Breakout (ORB)**: Detects early momentum by breaking the high/low of a user-defined opening range (default: 15 bars) with volume confirmation. This adds a time-based edge, ideal for intraday trading.
The synergy comes from blending these methods: reversals catch pullbacks, breakouts ride trends, and ORB exploits early volatility—all filtered by trend (SMA200) and anchored by VWAP for context.
#### How It Works
1. **Indicators**:
- **EMA9/EMA20**: Fast-moving averages for breakout signals.
- **SMA50**: Medium-term trend filter for reversals.
- **SMA200**: Long-term trend direction to align trades.
- **RSI (14)**: Measures overbought (>70) or oversold (<30) conditions.
- **VWAP**: Acts as a dynamic support/resistance level.
- **ATR (14)**: Sets stop-loss distance (default: 1.5x ATR).
- **Volume**: Confirms ORB breakouts (1.5x average volume of opening range).
2. **Entry Conditions**:
- **Long**: Triggers on reversal (SMA50 cross + RSI < 30 + below VWAP + uptrend), breakout (EMA9 > EMA20 + above VWAP + uptrend), or ORB (break above opening range high + volume).
- **Short**: Triggers on reversal (SMA50 cross + RSI > 70 + above VWAP + downtrend), breakout (EMA9 < EMA20 + below VWAP + downtrend), or ORB (break below opening range low + volume).
3. **Risk Management**:
- Risks 5% of equity per trade (based on the initial capital set in the strategy tester).
- Stop-loss: Based on lowest low/highest high over 7 bars ± 1.5x ATR.
- Targets: Two exits at 1:1 and 1:2 risk:reward (50% of position at each).
- Break-even: Stop moves to entry price after the first target is hit.
4. **Backtesting Settings**:
- Commission: Hardcoded at 0.1% per trade (realistic for most brokers).
- Slippage: Hardcoded at 2 ticks (realistic for most markets).
- Tested on datasets yielding 100+ trades (e.g., 2-min or 5-min charts over months).
#### How to Use It
- **Timeframe**: Works best on intraday (2-min, 5-min) or daily charts. Adjust `Opening Range Bars` (e.g., 15 bars = 30 min on 2-min chart) for your timeframe.
- **Settings**:
- Set your initial equity in the TradingView strategy tester’s "Properties" tab under "Initial Capital" (e.g., $10,000). The script automatically risks 5% of this equity per trade.
- Adjust `Stop Loss ATR Multiplier` or `Risk:Reward Targets` based on your risk tolerance.
- Note that commission (0.1%) and slippage (2 ticks) are fixed in the script for backtesting consistency.
- **Execution**: Enter on signal, monitor plotted stop (red) and targets (green/blue). The strategy supports pyramiding (up to 2 positions) for scaling into trends.
#### Backtesting Notes
Results are realistic with commission (0.1%) and slippage (2 ticks) included. For a sufficient sample, test on volatile instruments (e.g., stocks, forex) over 3-6 months on lower timeframes. The default 1.5x ATR stop may seem wide, but it’s justified to avoid premature exits in volatile markets—feel free to tweak it with justification. The script assumes an initial capital of $10,000 in the strategy tester for the 5% risk calculation (e.g., $500 risk per trade); adjust this in the "Properties" tab as needed.
This mashup isn’t just a random mix; it’s a deliberate fusion of complementary strategies, offering traders flexibility across market phases. Questions? Let me know!

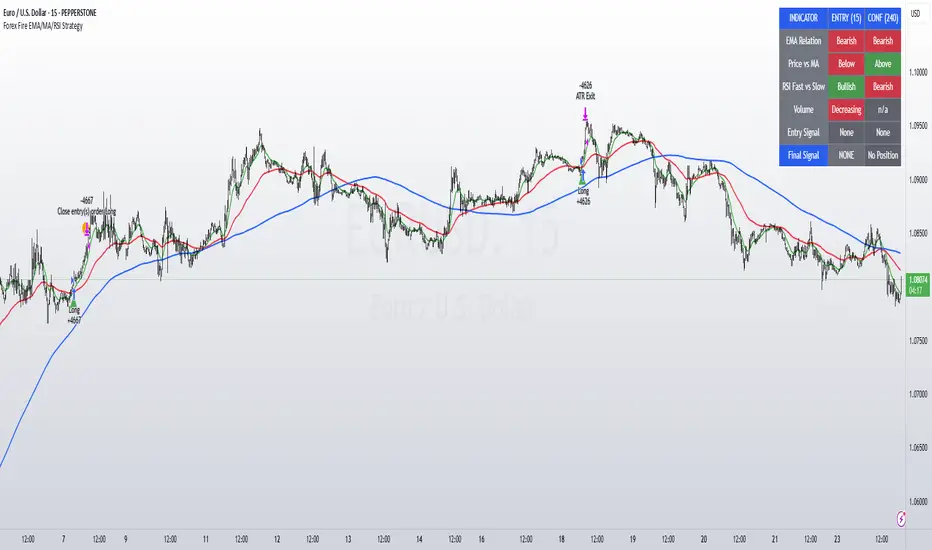
Forex Fire EMA/MA/RSI StrategyEURUSD
The entry method in the Forex Fire EMA/MA/RSI Strategy combines several conditions across two timeframes. Here's a breakdown of how entries are determined:
Long Entry Conditions:
15-Minute Timeframe Conditions:
EMA 13 > EMA 62 (short-term momentum is bullish)
Price > MA 200 (trading above the major trend indicator)
Fast RSI (7) > Slow RSI (28) (momentum is increasing)
Fast RSI > 50 (showing bullish momentum)
Volume is increasing compared to 20-period average
4-Hour Timeframe Confluence:
EMA 13 > EMA 62 (larger timeframe confirms bullish trend)
Price > MA 200 (confirming overall uptrend)
Slow RSI (28) > 40 (showing bullish bias)
Fast RSI > Slow RSI (momentum is supporting the move)
Additional Precision Requirement:
Either EMA 13 has just crossed above EMA 62 (crossover)
OR price has just crossed above MA 200
Short Entry Conditions:
15-Minute Timeframe Conditions:
EMA 13 < EMA 62 (short-term momentum is bearish)
Price < MA 200 (trading below the major trend indicator)
Fast RSI (7) < Slow RSI (28) (momentum is decreasing)
Fast RSI < 50 (showing bearish momentum)
Volume is increasing compared to 20-period average
4-Hour Timeframe Confluence:
EMA 13 < EMA 62 (larger timeframe confirms bearish trend)
Price < MA 200 (confirming overall downtrend)
Slow RSI (28) < 60 (showing bearish bias)
Fast RSI < Slow RSI (momentum is supporting the move)
Additional Precision Requirement:
Either EMA 13 has just crossed under EMA 62 (crossunder)
OR price has just crossed under MA 200
The key aspect of this strategy is that it requires alignment between the shorter timeframe (15m) and the larger timeframe (4h), which helps filter out false signals and focuses on trades that have strong multi-timeframe support. The crossover/crossunder requirement further refines entries by looking for actual changes in direction rather than just conditions that might have been in place for a long time.