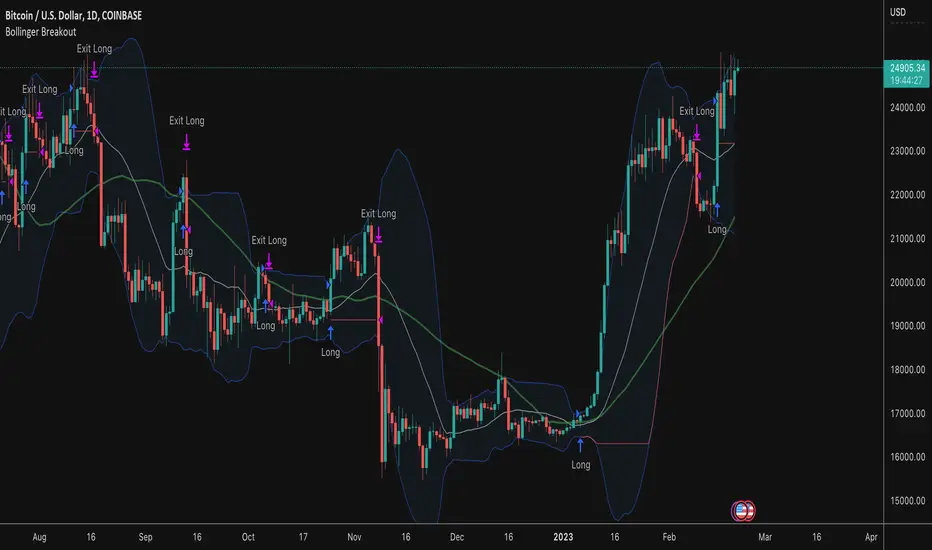
Bollinger Band BreakoutThis strategy buys when price crosses above an upper Bollinger Band and sells when the lower band is breached. What makes this strategy different than others:
Long only with filtering for only showing strong tickers
Filter out trades below a moving average on both the current timeframe and a longer period timeframe to keep you out of bear markets
Optional ability to set a tighter initial stop level to increase exposure and decrease downside risk on freshly opened trades while you wait for the lower Bollinger Band trailing stop to catch up
Take entries/exits on wicks/stops or wait for candle closes before entry
Select which dates to backtest
Customize Bollinger Band parameters including the ability to have different values for the upper and lower band standard deviation
Hareketli Ortalamalar
Combined Strategy Trading Bot (RSI ADX 20SMA)Trading Bot V1, This code implements a combined trading strategy that uses several indicators and strategies to make buy and sell decisions in the market. The code is written in Pine Script™, which is a programming language used in the TradingView platform. By BraelonWhitfield.Eth
The strategy uses the Average Directional Movement Index (ADX) and the Pine SuperTrend indicator to identify trends and price movements in the market. The SuperTrend indicator is a popular technical analysis tool that helps to identify the direction of the current trend and provides entry and exit points for trades.
The strategy also uses the Relative Strength Index (RSI) to identify overbought and oversold conditions in the market. The RSI is a momentum indicator that measures the speed and change of price movements in the market.
The first part of the code defines the inputs for the ADX and DI Length, which are used to calculate the ADX and DI values. The dirmov() function is used to calculate the positive and negative directional indicators (plusDM and minusDM) based on the high and low prices. The truerange variable is then calculated using the True Range (TR) formula. Finally, the plus and minus variables are calculated using the smoothed moving average of the plusDM and minusDM values.
The adx() function is then used to calculate the ADX values based on the plus and minus variables. The Pine SuperTrend indicator is defined using the pine_supertrend() function. This function uses the high-low average (hl2) and the Average True Range (ATR) to calculate the upper and lower bands for the indicator. The direction of the current trend is then determined based on whether the current price is above or below the upper or lower bands.
The RSI values are then calculated using the ta.rsi() function, with the inputs for the close price and the RSI period. The overbought and oversold conditions are defined using the OB and OS inputs, which specify the threshold values for the RSI. The upTrend and downTrend variables are defined based on the direction of the Pine SuperTrend indicator.
The next part of the code defines the 20-period Simple Moving Average (SMA) using the ta.sma() function. The os and ob variables are then calculated based on the RSI values and the OB and OS inputs. The strategy.entry() function is used to define the buy and sell orders based on the upTrend and downTrend variables, as well as the Pine SuperTrend indicator, the 20-period SMA, and the os variable.
The final part of the code defines the Channel Breakout Strategy using the ta.highest() and ta.lowest() functions to calculate the upper and lower bounds of the channel. The strategy.entry() function is then used to define the buy and sell orders based on whether the current price is above or below the upper or lower bounds.
In summary, this code implements a combined trading strategy that uses several indicators and strategies to make buy and sell decisions in the market. The strategy is designed to identify trends and price movements in the market, as well as overbought and oversold conditions, to provide entry and exit points for trades. The strategy uses the Pine SuperTrend indicator, the ADX and DI indicators, the RSI, and the 20-period SMA, as well as the Channel Breakout Strategy to make informed trading decisions.

Ema ScalpThis is another simple strategy based on ema
Entry Buy - 1) when close crossover ema then buy and only open one trade till it not close
2) if previous buy trade is profitable open another trade and check again trade is profitable or not
3)if trade is not profitable reset and wait for sell condition...
Entry Sell -1) when close crossunder ema then sell and only open one trade till it not close
2) if previous sell trade is profitable open another trade and check again trade is profitable or not
3) if trade is not profitable reset and wait for buy condition.....
stop loss and take profit is percentage based ...

Strategy Myth-Busting #13 - MultiEMA+BXTrender - [SP/MYN]#13 on the Myth-Busting bench, we are automating the "I Found The Highest Win Rate 15 Minute Scalping Trading Strategy Ever" strategy from "TradeIQ" who claims to have backtested this manually and achieved 410% profit over 100 trades within 6 months on Natural Gas with 79 Wins / 21 Losses with an astounding 3.96% Max Drawdown.
It was quite challenging emulating the same subjective EMA pullback logic along with the dependent sequencing of events necessary to enter a trade and we might improve on this to make it better in the future. Super kudos to @spdoinkal who helped with this strategy. If you have ideas on how this could be improved on, would love to hear about them.
As is, we were unable to substantiate similar results to what was manually backtested by TradeIQ, we do however see potential here. Given some optimizations and improvements to the the entry logic accommodating for a wider more variable margin after pullbacks reestablish above/below the fast EMA we think the performance of this strategy could certainly be improved upon. So not sure if we have totally myth busted this completely at this point in time.
This strategy uses a combination of 2 open-source public indicators:
3 EMA's (Trading View Internal)
B-Xtrender by Puppytherapy
Three separate (21), (89) and (200) EMA's are used as a means to confirm and keep entry out of ranged markets. When the 3 EMA's are all clumped up together with no distance it's indicative of a flat or ranged market. This is then used in conjunction with B-XTrender as a means to detect the trend direction. B-XTrender which is a trend following indicator originally published in the IFTA Journal by Bharat Jhunjhunwala. It uses both a short and long term lengths along with a compound EMA used as a means to smooth and sample trend direction.
Trading Rules
15 min candles but other lower time-frames
Stop Loss on previous swing high/low
No Take Profit, Exit on new red/green circles from BX-Trender
Long
EMA Green (21) on top, White (89)in middle and red (200) on bottom and there is distance between EMA's need to be spaced, otherwise in a ranged market
Price action must pull back into 89 EMA (White line) either close or touching it.
Once pullback occurs wait for BX Trender to issue a new green circle and BX Trend line must be green and above 0
Price action must also pull up back above the (Green Line) EMA 21
Short
EMA Red (200) on top, White (89) in middle and Green (21) on bottom and there is distance between EMA's need to be spaced, otherwise in a ranged market
Price action must pull back into 89 EMA (White line) either close or touching it.
Once pullback occurs wait for BX Trender to issue a new red circle and BX Trend line must be red and below 0
Price action must also pull up back below the (green Line) EMA 21
If you know of or have a strategy you want to see myth-busted or just have an idea for one, please feel free to message me.

smplondonclinic StrategyHello my friend! I'm uploading the code for your strategy. I have included a feature in the settings menu called "Entry Direction" that you can use to isolate only longs, only shorts or have both directions at the same time for the backtesting. I have set the strategy to only open 1 position at a time, it will not open a new position unless the previous position is closed. If you want to remove that just let me know. The green/red triangles that you will see plotting on the chart are the potential entry signals, you can turn them off from the style panel in the settings menu. In the inputs tab besides the strategy settings you also have all the relevant parameters for the three indicators used.

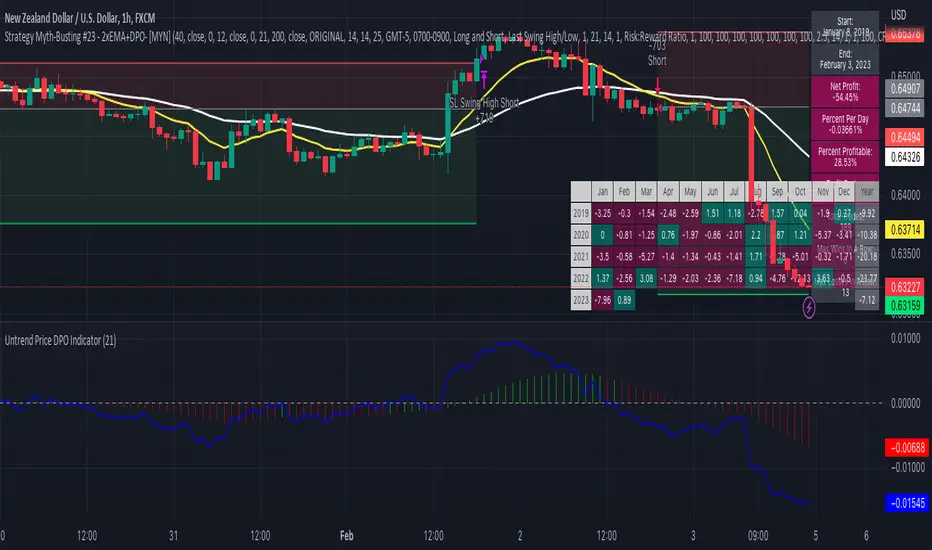
Strategy Myth-Busting #23 - 2xEMA+DPO- [MYN]#23 on the Myth-Busting bench, we are automating the "Best Funded Account Trading Strategy (Pass EVERY Challenge!)" strategy from "Trade with Pat" who claims this strategy will pass every trading challenge out there.
This strategy uses 3 open source indicators. 2 EMA's. The first one (Slow) is set to a length of 40 and a fast EMA which is set to 12. This strategy uses the crossover of the fast( 12) EMA over the Slow EMA ( 40 ) as the primary means to enter a long position. The opposite when the fast EMA crosses under the slow EMA as a means to indicate a short position. This strategy uses the DPO (Detrended Price Oscillaor) from the Uptrend Price DPO indicator in the same way we would traditionally use a stochastic or moving average convergence/divergence indicator like the MACD . Basically, the DPO helps evaluate and estimate the length of the price cycle from peak to peek or through to trough and in this strategy confirms entry of a long / short condition complimenting the EMA crossover/crossunders.
And as always, If you know of or have a strategy you want to see myth-busted or just have an idea for one, please feel free to message me.
This strategy uses a combination of 2 open-source public indicators:
EMA x2 ( 40 and 12)
Untrend Price DPO indicator by jTradeuh
Trading Rules
1 or 4 hour candles
Stop loss at previous highest-high (Short) and lowest-low (Long).
Take Profit 2 - 2.5 the risk
Strategy Template includes open source code from the following:
Performance Summary Dashboard by @VertMT
Time Of Day Window by @ddctv
Monthly Table Performance Dashboard by @QuantNomad
ATR Mean Reversion Strategy V1**Long Only Strategy**
When Price drops below the ATR band below it will enter a buy on the next candle open
SL at current price minus ATR* ATR multiplier
TP at Mean EMA or if higher than Mean EMA and current candle low is below previous candle low or if price is above ATR
NB: I would highly recommend a low fee broker (I use ICmarkets raw spread account) due to the fact that this is a decently high frequency trading strategy you will rack up a lot of commission, if you use and exchange like Bybit or Binance the strategy will not be profitable due to the high commissions.

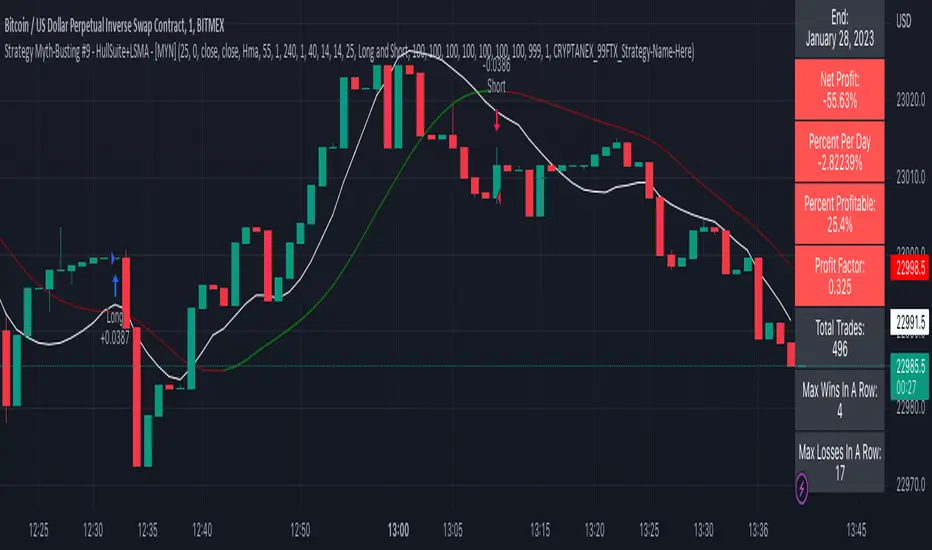
Strategy Myth-Busting #9 - HullSuite+LSMA - [MYN]This is part of a new series we are calling "Strategy Myth-Busting" where we take open public manual trading strategies and automate them. The goal is to not only validate the authenticity of the claims but to provide an automated version for traders who wish to trade autonomously.
Our 9th one is an automated version of the "I Tested The Best 1 Minute Scalping Strategy That Will Blow Your Mind 100 Times" strategy from "Profit Now" who claims to have achieved 36.7% profit scalping XRPUSDT on the 1 minute timeframe in only 15 days. As you can see from the backtest results below, I was unable to substantiate anything remotely close to that that claim on any timeframe or symbol. Myth 10000% busted.
This strategy uses a combination of 2 open-source public indicators: Hull Suite by InSilico and Least Squares Moving Average (LSMA)
The Hull Moving Average (HMA) is a faster version of the traditional moving average and is designed to reduce lag and improve the responsiveness of the average to price changes. In this strategy the HMA is used as a trend-following indicator, When the HMA is rising it is indicative of an upwards trend and when its falling its indicative of a downtrend.
The Least Squares Moving Average (LSMA) used in this strategy is similar to the HMA in that it is designed to reduce lag and improve the responsiveness of the average to price changes. In this strategy the LSMA is used to also not only identify trends but also confirm signals, it also is used to identify possible changes in the trend and market conditions.
When we use these together, the Hull Suite and LSMA indicators provide a complimentary confirmation of trend direction and trend swings. The Hull Suite helps to identify and confirm trends, while the LSMA aids to confirm signals and identify potential changes in market conditions.
The way this strategy is designed is when the Hull Suite HMA is trending up and the LSMA crosses above the HMA, we enter a long condition. When the Hull Suite is trending down and the LSMA crosses below the HMA we take a short position. Because of the low latency of these two indicators this strategy can be used on lower time frames down to 1 minute. On high volatility crypto on the lowest time frames, a 1:4 Risk Ratio should be used. A lower less risk ratio should be used on less volatile archetypes of securities.
If you know of or have a strategy you want to see myth-busted or just have an idea for one, please feel free to message me
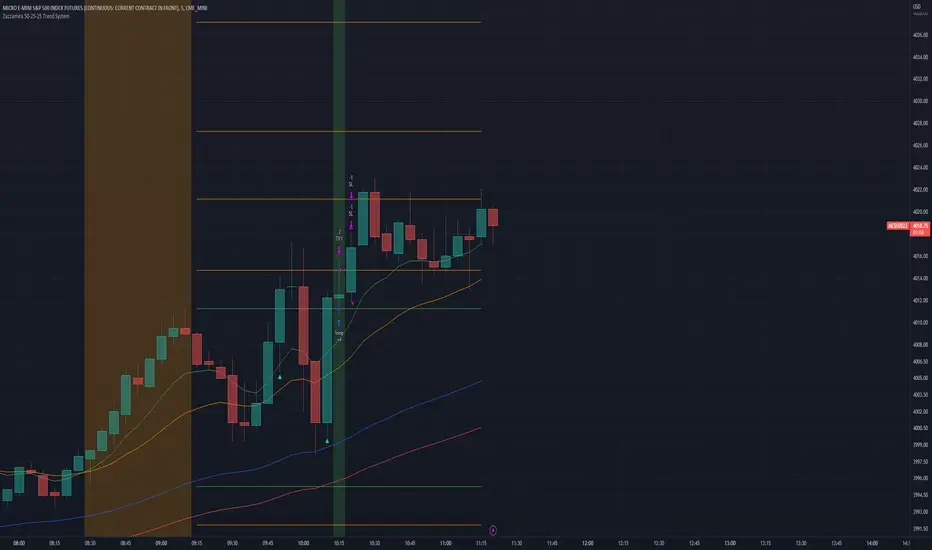
Zazzamira 50-25-25 Trend SystemPublishing my trading system script. It consist of several conditions to happen in order to open a trade. Work best on ES/MES 5 minute timeframe.
I like to use it with this settings:
- UTC -6 (don't tick Exchange Timezone)
and rest as default
To enter a trade, the following conditions must be met: Entry 1: the opening range (8:30AM - 9:15AM UTC-6) must be defined and the price must close above or below the opening range on the 5-minute timeframe. This entry condition defines the trade direction (above = long / below = short). Once the opening range is defined, the Trend-Based Fib Extension is applied from the range high to the range low (and vice versa). Fib levels are required for Exit conditions. Entry 2: the 8 - 27 - 67 - 97 EMAs must be defined. If the EMAs value order is 8 > 27 > 67 > 97, long-only trades are allowed. If the EMAs value order is 8 < 27 < 67 < 97, short-only trades are allowed. This entry condition filters fake breakouts of Entry 1. Entry 3: no trades are allowed after 12:59 UTC-6 (2PM EST). Entry 4: if Entry 1, Entry 2, and Entry 3 conditions are valid and the price hasn't reached the 23.6% Fib line, an entry order can be set at the range high/long with 4 contracts. To exit a trade, the following conditions must be met: Exit 1 (Stop loss): set a trailing stop based on 2.1x ATR (14) from entry. Exit 2: take 50% profits at the 23.6% Fib and leave trailing stop untouched. Exit 3: if Exit 2 triggers, take 50% (25% of total entry) off at 61.8% Fib, leaving Exit 2 trailing stop values valid. Exit 4: exit the full position at the FIB 100% value. Exit 5: all trades must be closed at 3pm UTC-6 (4PM EST). So basically Take Profit are 50%-25%-25% of position.
Code has been written by © Hiubris_Indicators who has been an amazing coder and gave me the possibility to make this script public so a really big shoutout to him.
TradePro's 2 EMA + Stoch RSI + ATR StrategySaw TradePro's "NEW BEST HIGHEST PROFITING STRATEGY WITH CRAZY RESULTS - 2 EMA+ Stochastic RSI+ ATR", and was curious on the back testing results. This strategy is an attempt to recreate it.
This strategy uses 50 / 200 EMAs, Stochastic RSI and ATR.
Long Entry Criteria:
- 50 EMA > 200 EMA
- Price closes below 50 EMA
- Stochastic RSI has gone into oversold < 20
- Stochastic RSI crosses up while making higher low from previous cross up
Short Entry Criteria:
- 50 EMA < 200 EMA
- Price closes above 50 EMA
- Stochastic RSI has gone into overbought > 80
- Stochastic RSI crosses down while making lower high from previous cross down
Stop-loss is set to ATR stop-loss
Take Profit is 2x the risk
All parameters are configurable.
Enjoy~~

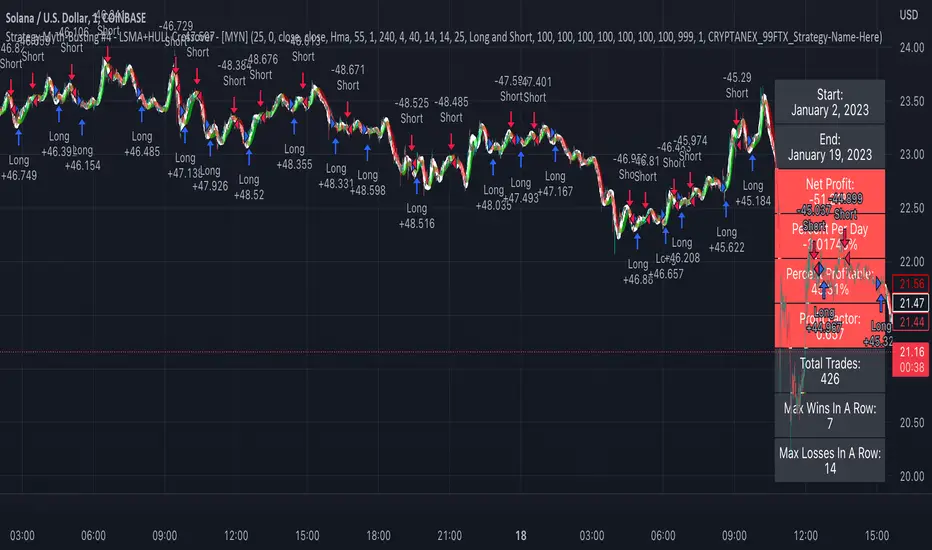
Strategy Myth-Busting #4 - LSMA+HULL Crossover - [MYN]This is part of a new series we are calling "Strategy Myth-Busting" where we take open public manual trading strategies and automate them. The goal is to not only validate the authenticity of the claims but to provide an automated version for traders who wish to trade autonomously.
Our fourth one we are automating is one of the strategies from "I Found The Best 1 Minute Scalping Strategy That Actually Works! ( Beginner Friendly )" from "Trade Domination" who claims to have made 366% profit on the 1 min chart of Solona despite having a 31% win rate in just a few weeks. As you can see from the backtest results below, I was unable to substantiate anything close to that that claim on the same symbol ( SOLUSD ), timeframe (1m) with identical instrument settings that "Trade Domination" was demonstrating with. Strategy Busted.
If you know of or have a strategy you want to see myth-busted or just have an idea for one, please feel free to message me.
This strategy uses a combination of 2 open-source public indicators:
LSMA
Hull Suite by InSilico
Trading Rules
1 min candles
Stop Loss on recent swing High/Low
1:5 Risk Ratio
Enter Long
LSMA cross above Red Hull Suite line
Price has to be above Hull Suite Line
Enter Short
LSMA crosses under green Hull Suite Line
Price has to be below Hull Suite Line
Flying Dragon Trend StrategyFlying Dragon Trend Strategy can be used to indicate the trend on all timeframes by finetuning the input settings.
The Flying Dragon Trend family includes both the strategy and the indicator, where the strategy supports of selecting the optimal set of inputs for the indicator in each scenario. Highly recommended to get familiar with the strategy first to get the best out of the indicator.
Flying Dragon Trend plots the trend bands into the ribbon, where the colours indicate the trend of each band. The plotting of the bands can be turned off in the input settings. Based on the user selectable Risk Level the strategy is executed when the price crosses the certain moving average line, or at the Lowest risk level all the bands have the same colour.
The main idea is to combine two different moving averages to cross each other at the possible trend pivot point, but trying to avoid any short term bounces to affect the trend indication. The ingenuity resides in the combination of selected moving average types, lengths and especially the offsets. The trend bands give visual hint for the user while observing the price interaction with the bands, one could say that when "the Dragon swallows the candles the jaws wide open", then there is high possibility for the pivot. The leading moving average should be fast while the lagging moving average should be, well, lagging behind the leading one. There is Offset selections for each moving average, three for leading one and one for the lagging one, those are where the magic happens. After user has selected preferred moving average types and lengths, by tuning each offset the optimal sweet spot for each timeframe and equity will be found. The default values are good enough starting points for longer (4h and up) timeframes, but shorter timeframes (minutes to hours) require different combination of settings, some hints are provided in tooltips. Basically the slower the "leading" moving average (like HMA75 or HMA115) and quicker the "lagging" moving average (like SMA12 or SMA5) become, the better performance at the Lowest risk level on minute scales. This "reversed" approach at the minute scales is shown also as reversed colour for the "lagging" moving average trend band, which seems to make it work surprisingly well.
The Flying Dragon Trend does not necessarily work well on zig zag and range bounce scenarios without additional finetuning of the input settings to fit the current condition.
Strategy direction selector by DashTrader.

PSAR BBPT ZLSMA BTC 1minLong entry:
PSAR gives buy signal
BBPT prints green histogram
ZLSMA is below the price
ZLSMA has uptrend
SL is smaller than the max SL
Optional Sessions and EMA filters
Short entry
PSAR gives sell signal
BBPT prints red histogram
ZLSMA is above the price
ZLSMA has downtrend
SL is smaller than the max SL
Optional Sessions and EMA filters
SL:
Placed below ZLSMA + offset on long
Placed above ZLSMA + offset on short
TP1:
1x the SL by default
Takes no profit by default, 50% is also a good setting
TP2:
2x the SL by default
Take out all remaining position size.
If price reaches TP1, the SL is set to the entry price.

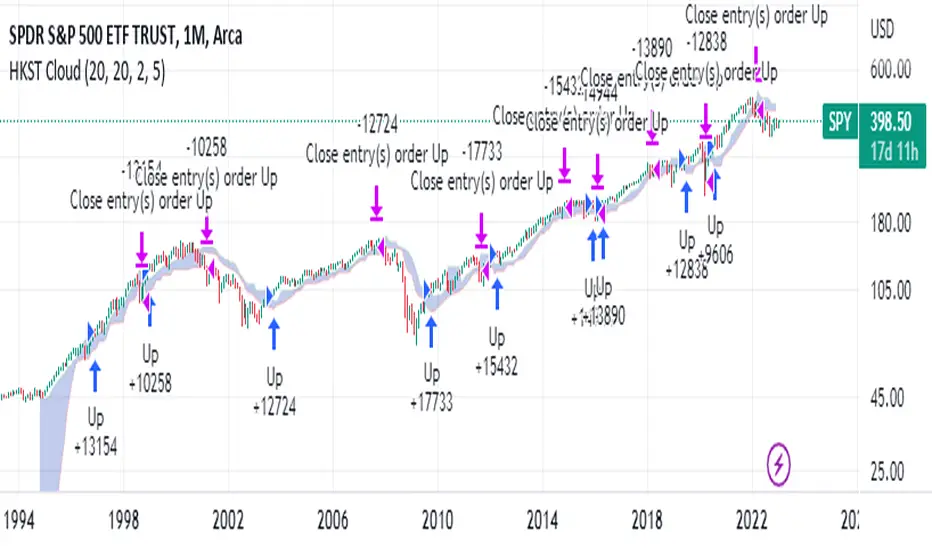
Hull Kaufman SuperTrend Cloud (HKST Cloud)TLDR: This is a long only trend following system that uses highest and lowest values of three trend following indicators to form a "cloud". Enter when the candle high crosses above the highest band. Close if the low or close crosses below the lowest band.
3 indicators
1. Kaufman Adaptive moving Average - set at 20
2. Hull Moving Average (of the Kaufman Adaptive moving average) - set at 20
3. SuperTrend - I believe this is set at 5 periods and 3*atr but this can be changed
Cloud
the upper band is the highest of the 3 indicators
the lower band is the lowest of the 3 indicators
Entry and Exit:
Enter when the high crosses above the upper band of the cloud.
(This means you will only get a long signal if the high was previously below the upper band of the cloud and then crosses over.)
Exit when the low crosses below the lower band of the cloud .
(This means that this rule will only close if the low was previously above the upper band and then crosses under)
The "Exit" may not trigger if the low (the wick) never gets above the band. In this case the long order will close if the closing price is below the cloud.
Logic
Kaufamn is the best moving average i have found at responding to changes in volatility. This means it moves up or down quickly during expansive moves but becoming very flat during relative choppiness. However, getting flat causes the the Kaufman AMA to trigger a lot of false signals when volatility is transitioning from high to low. This is why the Hull moving average (with its rounded turns) keeps a lot of the false continuations contained because usually prices need to decisively move higher in order to over come the Hull moving average which continues to increase/decrease during the candles after an expansive move.
The super trend places a stagnant floor and ceiling which acts as a great stoploss or trigger as price action attempts to trend in a certain direction. The super trend allows for the user to adjust the likely hood of this cloud indicator changing from bullish to bearish based on the volatility of the asset that is being analyzed.
individually all of these are great. Together the trader can use this cloud to create a trend following or anlysis system that captures the bulk of moves.
Not my best explanation but this indicator is actually pretty simple.
Hope this helps. Happy Trades
-Snarky Puppy
Super 8 - 30M BTCWelcome to Super 8, the ultimate automatic trading script for Pine!
This bad boy is designed to go both long and short, and it's equipped with all the tools you need to maximize your profits. Whether you're looking to take profit, set a trailing stop, or protect yourself with a stop loss, Super 8 has you covered.
But that's not all! Super 8 is also loaded with 8 powerful indicators to help you make informed decisions. We've got the EMA, ADX, SAR, MACD, VOLUME, BOLLINGER BANDS, DONCHIAN, and ATR all working together to give you the best possible trading experience.
And if you want to take it to the next level, Super 8 also has a feature that lets you use stepped entries in normal mode or incremental 1,2,3,... to improve your average price. Plus, if you're using trailing stop, you can activate the Backtest precision to use lower timeframes.
But what's in a name? Super 8 is called that because it's just that... super! It's tailored specifically for the OKX:BTCUSDT.P pair, so you know you're getting the best possible results. it's highly adjustable and can be used with any other pair. So no matter what market you're trading in, Super 8 has got you covered.
So if you want to level up your trading game, give Super 8 a try. You won't be disappointed.
Certain Risks of Live Algorithmic Trading:
Backtesting Cannot Assure Actual Results.
The relevant market might fail or behave unexpectedly.
Your broker may experience failures in its infrastructure, fail to execute your orders in a correct or timely fashion or reject your orders.
The system you use for generating trading orders, communicating those orders to your broker, and receiving queries and trading results from your broker may fail.
Time lag at various point in live trading might cause unexpected behavior.
The systems of third parties in addition to those of the provider from which we obtain various services, your broker, and the applicable securities market may fail or malfunction.

Selected Dates Filter by @zeusbottradingWe are presenting you feature for strategies in Pine Script.
This function/pine script is about NOT opening trades on selected days. Real usage is for bank holidays or volatile days (PPI, CPI, Interest Rates etc.) in United States and United Kingdom from 2020 to 2030 (10 years of dates of bank holidays in mentioned countries above). Strategy is simple - SMA crossover of two lengts 14 and 28 with close source.
In pine script you can see we picked US and GB bank holidays. If you add this into your strategy, your bot will not open trades on those days. You must make it a rule or a condition. We use it as a rule in opening long/short trades.
You can also add some of your prefered dates, here is just example of our idea. If you want to add your preffered days you can find them on any site like forexfactory, myfxbook and so on. But don’t forget to add function “time_tradingday ! = YourChoosedDate” as it is writen lower in the pine script.
Sometimes the date is substituted for a different day, because the day of the holiday is on Saturday or Sunday.
Made with ❤️ for this community.
If you have any questions or suggestions, let us know.
The script is for informational and educational purposes only. Use of the script does not constitutes professional and/or financial advice. You alone the sole responsibility of evaluating the script output and risks associated with the use of the script. In exchange for using the script, you agree not to hold zeusbottrading TradingView user liable for any possible claim for damages arising from any decision you make based on use of the script.

supertrend with multiple filter strategythis indicator filters buy and sell signal from the supertrend base on various condition that the user can manually select.
as of now the following filter are included
buy and sell filter;
-Macd
-CCI
-EMA200
-LUX TRAMA
-Stochastic rsi
-MFI
EXIT SIGNAL CAN BE CHOSE BETWEEN ATR BAND OR BOLLINGER BAND
i am planning on keeping to add filters so if you have suggestion fell free to message me.
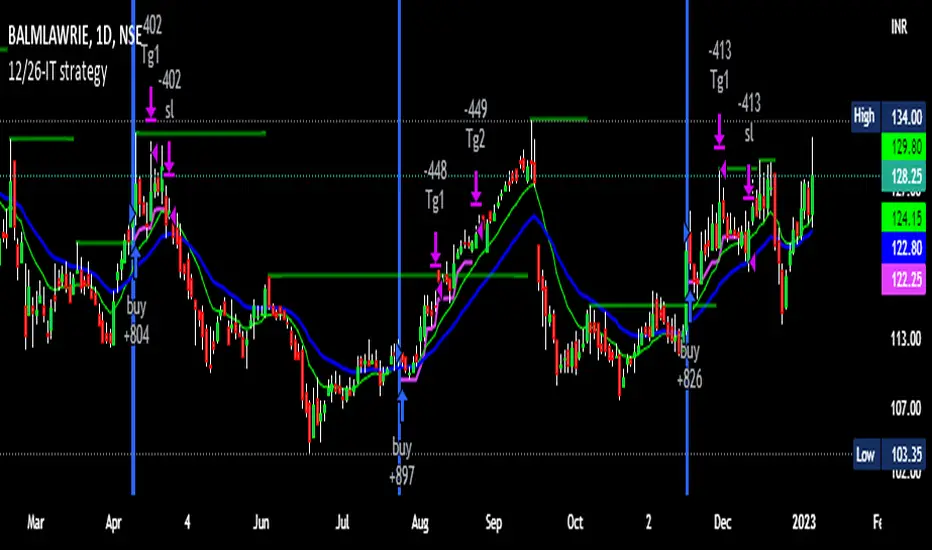
12/26-IT strategyBase of this Strategy is crossover of 12EMA on 26EMA.
Also multiple other criteria has to meet for buy signal, Criterias mentioned below
//////////////////////////////////
There two entry option to select. Either one or both can be selected:
1. Only 12/26 Cross over
a. 12/26 crossover.
b. RSI (14) value to be between a range (RSI is inbuilt, but lower and upper range can be defined in settings)
c. MACD (12, 26) to be positive and above signal line (this is inbuilt)
2. Recent 12/26 Cross over and closing above pivot point(resistance)
a. 12/26 crossover has to be recent, CrossOverLookbackCandles value will look for crossover in # previous candles..
b. RSI (14) value to be between a range (RSI is inbuilt, but lower and upper range can be defined in settings)
c. MACD (12, 26) to be positive and above signal line (this is inbuilt)
d. closing above resistance line
//////////////////////////////////
For Exit we have three options. you can select any SL as per your need, multiple SLs can also be selected
1. Trailing Stop Loss.
Source for TSL is adjustable(open, close, high or low), also you have to mention % below your source TSL has to be placed.
Once closing is below TSL, exit will be triggered.
2. Closing below 7SMA
After 7SMA SL is enabled, 7SMA will be plotted on chart and exit signal will be triggered when closing is below 7SMA.
Choose this option for LESS risk and rewards
3. 12/26 Crossdown
Once 12EMA crossdown below 26EMA, exit will be triggered.
Choose this option for HIGH risk and rewards
//////////////////////////////////
Resistance line is plotted based on left and right candles, if 10(can be changed) is used for both left and right, indicator will look for 10 candles in left and 10 candles in right and if both left and right candle are lower then a line is plotted.
Source has to be selected (close or high)
//////////////////////////////////
Qty mentioned in Buy trigger will be based on BUYVALUE entered
//////////////////////////////////
Multiple Target option is available, if first target is matched how much percentage of qty to be sold can be defined.
If you wish to have only one Target, then exit qty in first target must be 100
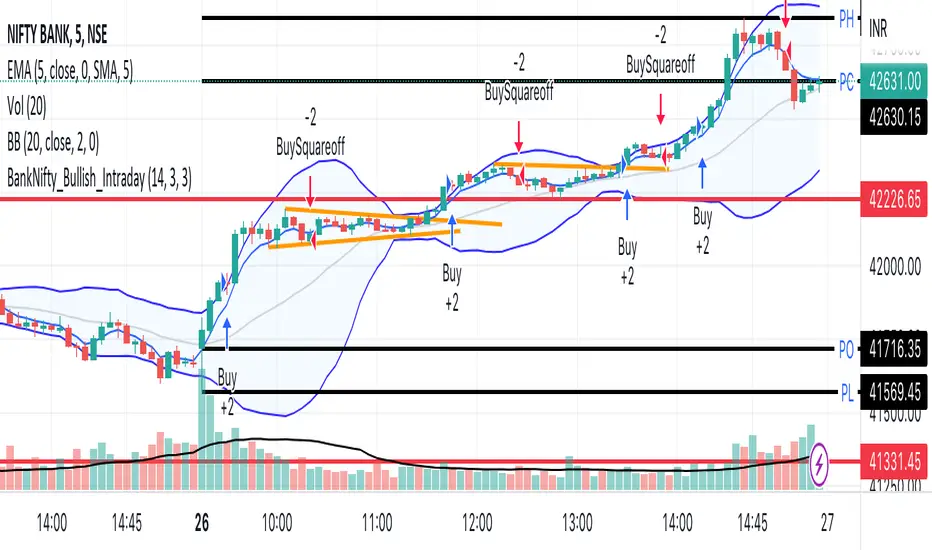
BankNifty_Bullish_Intraday
The script uses following mechanism to give a signal of BUY if multiple parameters evaluated are all passed.
ENTRY-
1. 5 min MACD should be more than its previous tick
2. 15 min MACD should be more than its previous tick
3. 60 min MACD should be more than its previous tick
4. ADX should be more than 12
5. RSI should be more than 60
6. Stochastic %k should have cross over with %d
7. Bollinger band upper band value should be more than previous tick
EXIT
If the 5 min bar price closes below 5 min EMA , it gives an exit signal.
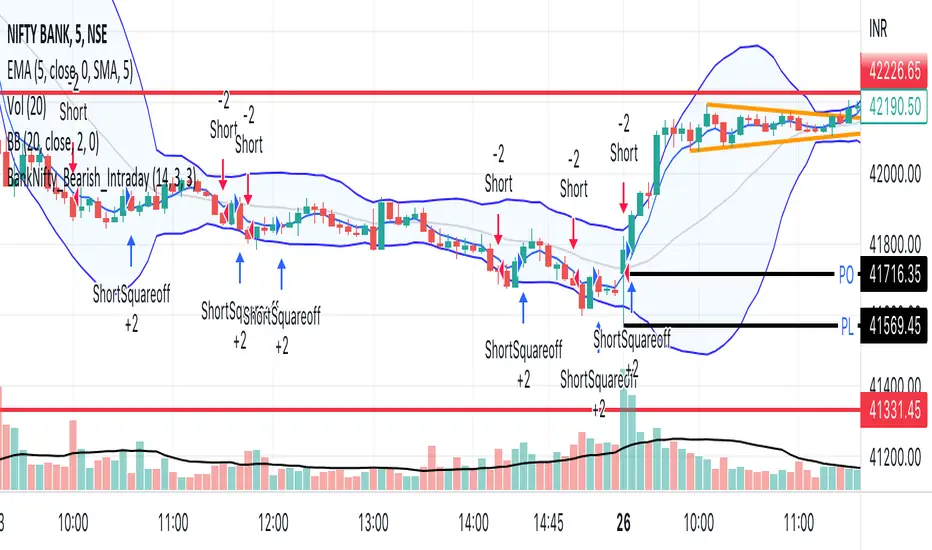
BankNifty_Bearish_Intraday
The script uses following mechanism to give a signal of SELL if multiple parameters evaluated are all passed.
ENTRY-
1. 5 min MACD should be less than its previous tick
2. 15 min MACD should be less than its previous tick
3. 60 min MACD should be less than its previous tick
4. ADX should be more than 12
5. RSI should be less than 40
6. Stochastic %k should have negative cross over with %d
7. Bollinger band lower band value should be less than previous tick
EXIT
If the 5 min bar price closes above 5 min EMA , it gives an exit signal.
RSI and MA with Trailing Stop Loss and Take Profit (by Coinrule)The relative strength index is a momentum indicator used in technical analysis. It measures the speed and magnitude of a coin's recent price changes to evaluate overvalued or undervalued conditions in the price of that coin. The RSI is displayed as an oscillator (a line graph essentially) on a scale of zero to 100. When the RSI reaches oversold levels, it can provide a signal to go long. When the RSI reaches overbought levels, it can mark a good exit point or alternatively, an entry for a short position. Traditionally, an RSI reading of 70 or above indicates an overbought situation. A reading of 30 or below indicates an oversold condition.
A moving average (MA) calculates the average of a selected range of prices, usually closing prices, by the number of periods in that range. Essentially it is used to help smooth out price data by creating a constantly updated average price.
The Strategy enters and closes trades when the following conditions are met:
Entry Conditions:
RSI is greater than 50
MA9 is greater than MA50
RSI increases by 5
Exit Conditions:
Price increases by 1% trailing
Price decreases by 2% trailing
This strategy is back-tested from 1 January 2022 to simulate how the strategy would work in a bear market. The strategy provides good returns.
The strategy assumes each order is using 30% of the available coins to make the results more realistic and to simulate you only ran this strategy on 30% of your holdings. A trading fee of 0.1% is also taken into account and is aligned to the base fee applied on Binance.

VWMA/SMA 3Commas BotThis strategy utilizes two pairs of different Moving Averages, two Volume-Weighted Moving Averages (VWMA) and two Simple Moving Averages (SMA).
There is a FAST and SLOW version of each VWMA and SMA.
The concept behind this strategy is that volume is not taken into account when calculating a Simple Moving Average.
Simple Moving Averages are often used to determine the dominant direction of price movement and to help a trader look past any short-term volatility or 'noise' from price movement, and instead determine the OVERALL direction of price movement so that one can trade in that direction (trend-following) or look for opportunities to trade AGAINST that direction (fading).
By comparing the different movements of a Volume-Weighted Moving Average against a Simple Moving Average of the same length, a trader can get a better picture of what price movements are actually significant, helping to reduce false signals that might occur from only using Simple Moving Averages.
The practical applications of this strategy are identifying dominant directional trends. These can be found when the Volume Weighted Moving Average is moving in the same direction as the Simple Moving Average, and ideally, tracking above it.
This would indicate that there is sufficient volume supporting an uptrend or downtrend, and thus gives traders additional confirmation to potentially look for a trade in that direction.
One can initially look for the Fast VWMA to track above the Fast SMA as your initial sign of bullish confirmation (reversed for downtrending markets). Then, when the Fast VWMA crosses over the Slow SMA, one can determine additional trend strength. Finally, when the Slow VWMA crosses over the Slow SMA, one can determine that the trend is truly strong.
Traders can choose to look for trade entries at either of those triggers, depending on risk tolerance and risk appetite.
Furthermore, this strategy can be used to identify divergence or weakness in trending movements. This is very helpful for identifying potential areas to exit one's trade or even look for counter-trend trades (reversals).
These moments occur when the Volume-Weighted Moving Average, either fast or slow, begins to trade in the opposite direction as their Simple Moving Average counterpart.
For instance, if price has been trending upwards for awhile, and the Fast VWMA begins to trade underneath the Fast SMA, this is an indication that volume is beginning to falter. Uptrends need appropriate volume to continue moving with momentum, so when we see volume begin to falter, it can be a potential sign of an upcoming reversal in trend.
Depending on how quickly one wants to enter into a movement, one could look for crosses of the Fast VWMA under/over the Fast SMA, crosses of the Fast VWMA over/under the Slow SMA, or crosses over/under of the Slow VWMA and the Slow SMA.
This concept was originally published here on TradingView by ProfitProgrammers.
Here is a link to his original indicator script:
I have added onto this concept by:
converting the original indicator into a strategy tester for backtesting
adding the ability to conveniently test long or short strategies, or both
adding the ability to calculate dynamic position sizes
adding the ability to calculate dynamic stop losses and take profit levels using the Average True Range
adding the ability to exit trades based on overbought/oversold crosses of the Stochastic RSI
conveniently switch between different thresholds or speeds of the Moving Average crosses to test different strategies on different asset classes
easily hook this strategy up to 3Commas for automation via their DCA bot feature
Full credit to ProfitProgrammers for the original concept and idea.
Any feedback or suggestions are greatly appreciated.

I11L - Meanreverter 4h---Overview---
The system buys fear and sells greed.
Its relies on a Relative Strength Index (RSI) and moving averages (MA) to find oversold and overbought states.
It seems to work best in market conditions where the Bond market has a negative Beta to Stocks.
Backtests in a longer Timeframe will clearly show this.
---Parameter---
Frequency: Smothens the RSI curve, helps to "remember" recent highs better.
RsiFrequency: A Frequency of 40 implies a RSI over the last 40 Bars.
BuyZoneDistance: Spacing between the different zones. A wider spacing reduces the amount of signals and icnreases the holding duration. Should be finetuned with tradingcosts in mind.
AvgDownATRSum: The multiple of the Average ATR over 20 Bars * amount of opentrades for your average down. I choose the ATR over a fixed percent loss to find more signals in low volatility environments and less in high volatility environments.
---Some of my thoughts---
Be very careful about the good backtesting performance in many US-Stocks because the System had a favourable environment since 1970.
Be careful about the survivorship bias as well.
52% of stocks from the S&P500 were removed since 2000.
I discount my Annual Results by 5% because of this fact.
You will find yourself quite often with very few signals because of the high market correlation.
My testing suggests that there is no expected total performance difference between a signal from a bad and a signal from a good market condition but a higher volatility.
I am sharing this strategy because i am currently not able to implement it as i want to and i think that meanreversion is starting to be taken more serious by traders.
The challange in implementing this strategy is that you need to be invested 100% of the time to retrieve the expected annual performance and to reduce the fat tail risk by market crashes.
