OnTheMoveWith this plot one is able to compare the different % change in the given time frame. It calculates the sma of a given period (defval = 7) for the close/open.
Strategy would be to choose (trade) from one to other asset in order to get higher rates when pumping or lower when dumping.
The Symbol & exchange has to be specified.
defSymbols = BTC, ETH and LINK
defExchange = BINANCE
Tarihi Volatilite

GBTC Fomo Panic PremiumIt is rumored that GBTC price action leads the Bitcoin market. This indicator compares GBTC fomo/panic levels to the (Binance) BTC spot market. Fomo is measured as large percentage moves of the high price from the min over a look-back period. Panic is measured as large percentage moves of the low price from the max over a look-back period. A prime example of this indicator's usage would be as a sell signal confirmation during the 2020 pre-Thanksgiving panic exhibited on the 1-hour chart while the 20 EMA was still above the 99 SMA.
You can customize the leading and lagging markets and the length of the lookback period. I would love to hear what parameters, markets and timeframes work for you. Maybe there is a way to leave comments, or hit me up on Twitter: @thirdreplicator
May you profit and enjoy.

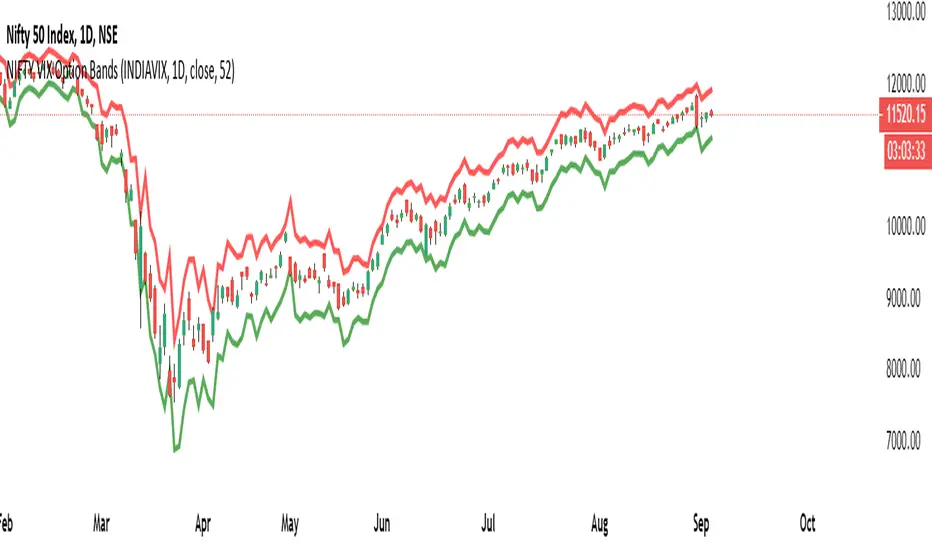
Volatility Prism [Nic]What is this
The volatility rainbow tracks divergences in a security and its volatility index. This can be used to identify periods of heightened implied (future) risk.
About Volatility
The volatility is calculated by looking at put / call ratios. When VIX goes up it means that puts are outpacing calls. This is a bearish signal.
About Correlation
When the security goes up while the VIX goes up, the divergence on the plot will increase and turn a color. This should be a warning.
Volatility Rainbow
This is a similar indicator, but this one merges all signals into a single line.

IV/HV Ratio's [Nic]IV is implied volatility
HV is historic realized volatility
Seneca teaches that we often suffer more in our minds than in reality, and the same is true with the stock market. This indicator can help identify when people are over paying for implied volatility relative to real volatility . This means that short sellers are over paying for puts and can be squeezed into covering their positions, resulting in a massive rally.
The indicator can track this spread over many time frames, when the short time frame is much higher than the lower time frames, consider it a signal-of-interest.

Divergence Indicator [Nic]This divergence indicator can track the correlation between one or more symbols. I use it to track the divergences between the VIX volatility index, gold, bonds, as well as other market leading indicators.
When using with Vix, lower coefficients can lead to false signals. When in a high vix bear market signals, there is more noise and more false (or missing) signals can occur. Please use with other technical tools.

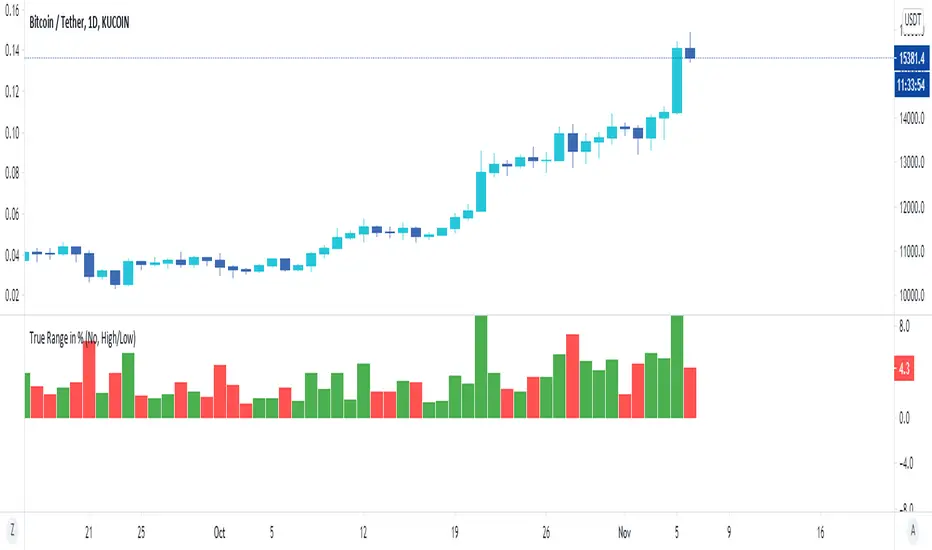
True Range in %I like to look at volatility in percentage and not in numbers. This is exactly what this script provides. It calculates the true range of a candle in percentage to the current price (for finished candles it uses it's close price).
The script also allows you to compare open and close prices.
2HLA very simple, almost naive strategy, in which you buy on the lowest of the two previous candles and sell at the highest of the two previous candles. You can configure these highest and lowest lenght, in some assets two is too small of a number to make profit. You can also configure to exit the position after X, and I found that 7 (which is a week of working days) is a good number for that.
This is strategy is intended to be used as a swing trade. Your capital needs to be high enough so that it can pay the operaitonal costs, and reach it's target with a reasonable profit.
Since this is a volatility based strategy, assets that are more liquid won't work properly.

Pisani BandsThis indicator is based on Historical Volatility.
It's plot the simple moving average with a upper and a lower band.
The bands are calculated like this:
UpperBand = 20 Simple moving average + 20% * Historical volatility
LowerBand = 20 Simple moving average - 20% * Historical volatility
But, you can change the paramters. I use the 200SMA with 100% of Historical Volatility either.
How to use:
If the price are negociating out of the bands, it's dangerous to trade this stock.
Hope you like it.

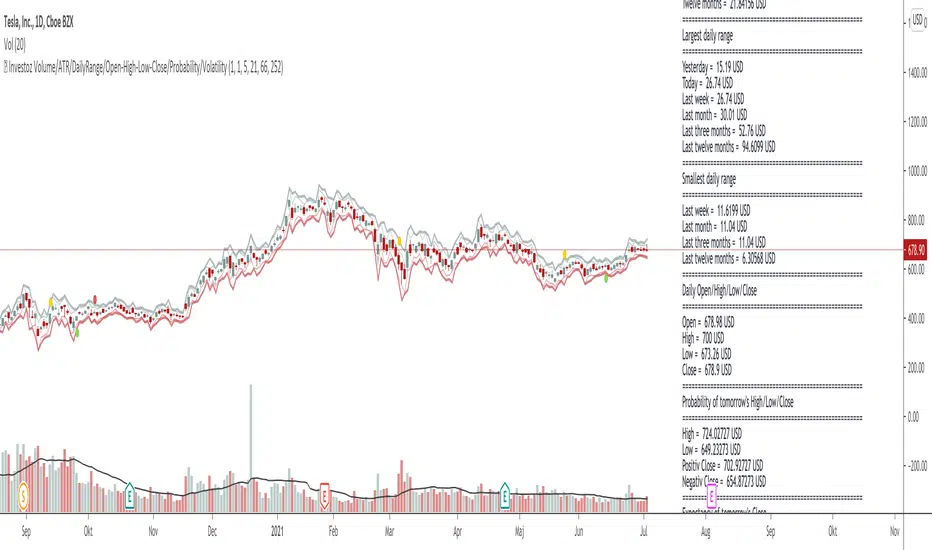
© Investoz Volume/ATR/DailyRange/OHLC/Probability/VolatilityThe relationship between returns, volatility and trading volume has interested financial economists and analysts for a long time.
Is there any dynamic relationship between trading volume, returns and volatility in the financial markets?
In recent financial studies, the linkage between return, volatility and trading volume is a central issue as it provides insights into the microstructure of financial markets. The price-volume relationship is seen as it is related to the role of information in price formation. Trading volume is defined as the number of shares traded each day and is an important indicator in technical analysis as it is used to measure the worth of stock price movement
either up or down.
Investors' motive to trade is solely dependent on their trading activity; it may be to speculate on market information or portfolios diversification for risk sharing, or else the need for liquidity. These different motives to trade are a result of processing different available information. In consequence, trading volume may originate from any of the investors who may have different information sets. As various studies reported, the information flow into the market is linked to the trading volume and volatility. Thus, since the stock price changes when new information arrives, there exists a relation between prices, volatility and trading volumes.
Significant efforts have been made, empirically and theoretically, on the phenomenon of stock price and volume relationship. Although the majority of those findings have confirmed the existence of positive contemporaneous relationship between trading volume and returns, the study of different stock markets have given mixed results about the causal return-volume relationship.
So, if you think that price and volume is important, maybe this indicator full of information around this topic may help you or make it easier in many ways.
Let me briefly guide you through.
To the right you have all the information within a label directly on the chart. Inside the label you will see following information:
-Number of bars
-Volume
-Average true range
-Daily range
-OHLC
-Probability for tomorrow´s daily range
-Warning of increased volatility
In the chart, you will also see where the expected daily range is likely to be within, with high and low levels.
Finally, I like to say this:
I have put a lot of work into this script and let me know if you use the indicator and what you think of it. Also if it is of some help or maybe you who use it, have found something wrong that needs to be reviewed and changed or information that would be important to add?
Enjoy!
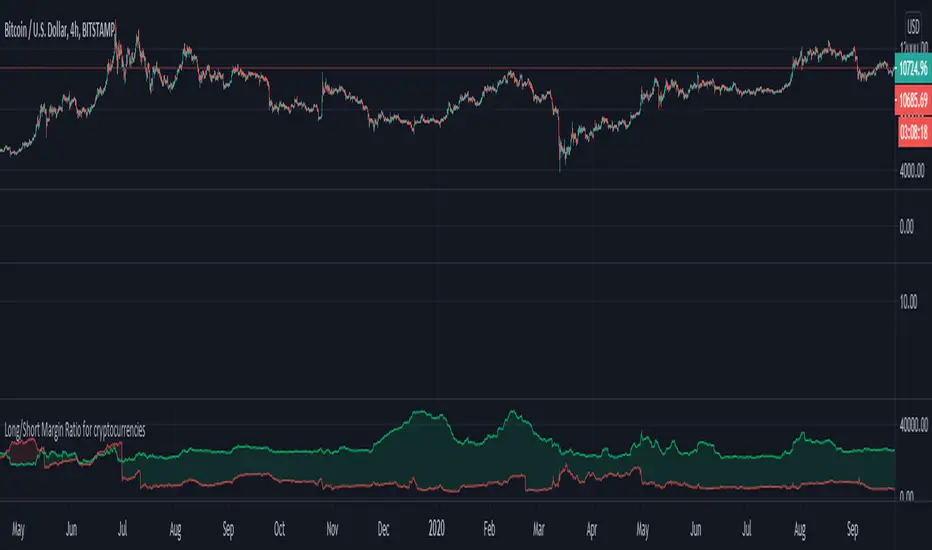
Long/Short Margin Ratio for cryptocurrenciesBTCUSDSHORTS and BTCUSDLONGS are like datasets provided by Bitfinex exchange. They record the number of margined for longs and shorts and they are measured in BTC (in case using BTCUSD ).
Margin is Like any loan, the borrower may pay interest while the loan is outstanding, and must eventually pay the loan back.
Red Area: More short margin than long margin.
Green Area: More long margin than short margin.
Note: Can only be used with cryptocurrencies that have such dataset within Bitfinex exchange like BTCUSD , ETHUSD , XRPUSD and a few more.
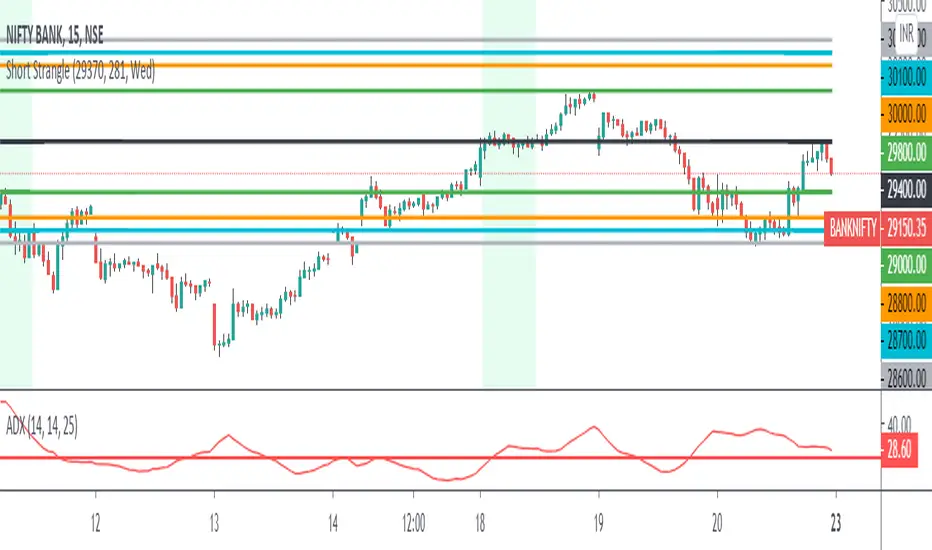
3 Leg Short Strangle BandsDraws 3 leg bands along with safe zone(green lines) based on input
1) Input ATR, Week Day, Current Market Close
2) Input ATR - Previous day 1H Max ATR
3) ADX < 25
4) Input Current Market Close
5) Trading Day - Mon/Tue/Wed/Thu/Fri - Bands distance calculated based on day M/Tu/F 2*(Max ATR), W/Th 1.5(ATR)
6) Safe zone green lines - CMPCls +/- (1.5 * Max ATR)
7) Leg 1 Upper Lower Legs - M/Tu/F - CMPCls +/-(2 * Max ATR), W/Th - CMPCls +/-(1.5 * ATR)
8) Leg 2 & 3 Calculates based on Leg 2 = Leg 1 +/- 100 pts distance, Leg 3 = Leg 2 +/- 100 pts distance'
9) All figures rounded to nearest 100's
10) Safe zone broken exit all positions
This is a popular technic used by Profitable traders on sideway markets for Intraday
One can keep 3K as SL per 1 set of 3 legs for better R:R
NIFTY VIX Bands1) The script takes current INDIA VIX as input Daily time frame for NIFTY
2) Used a Formula VIX Value / Square root of Time Period
3) Change Timeframe input accordingly 1 Year = 1, Monthly = 12, Weekly = 52, Daily = 365
4) based point 2 formula with 1 standard deviation it creates upper & lower range bands
5) This is generally used for option selling by big traders they go and sell above the band strikes
Standard Deviation Volatility HelperHere is a simple Standard Deviation Line based on supply and demand that will help you to find expected move easily. 3 Standart Deviation merged line available. Number of days and adjustable length.

Geometric Brownian Motion BandIf you are an option trader, who are constantly searching opportunities to set up inverse iron condor position or other strategies, you must be familiar in estimating the range induced by Geometric Brownian Motion (GBM), or Lognormal distribution someone may call.
The theory behind is adopted in the Black Scholes Option Pricing model, this assumes the asset price follows the GBM, shown below, and estimates the range where the price will fall into on the specific date and probability.
dS = a dt + v dW
Assuming the drift term is zero, this GBM Band applies the same model and helps you to quickly assess the suitable range to set up your option strategies with simple setting:
Length – number of bars covered
Vol Multiple - the z-score of the probability
Default values of the Length and Vol Multiple are set to 20 bars and 2.0 z-score respectively.
You can find an example how the GMB Band work.
You can also applies this GMB Band like how Bollinger's Band does for swing trade or breakaway trade.
If you find this indicator is useful to you, Star it, Follow, Donate, Like and Share.
Your support is a highly motivation for me.

Historical Volatility Percentile: Price and VolumeThis is an expansion of the Historical Volatility scripts to include both price and volume volatility.
As Tradingview states :
Historical Volatility is a measure of how much price (and now volume ) deviates from its average in a specific time period that can be set. The more price (or/and volume ) fluctuates, the higher the indicator value. Please note it does not measure the direction of price (and volume ) changes, just how volatile price/ volume has become. There are several reasons to care about volatility but it's mainly a risk measure. As volatility increases, so does risk and uncertainty and vice versa. Traders can use the indicator to flag instruments with high volatility which could point to a trend change. It is often used in combination with other signals.
Example options
Example formats
Link back to some other great ideas:
@Cheatcountry with his prolific sharing , what a great inspiration.
@Picte and his inspired idea .
@Balipour and his great script
Comparing this to other significant HVP indicators

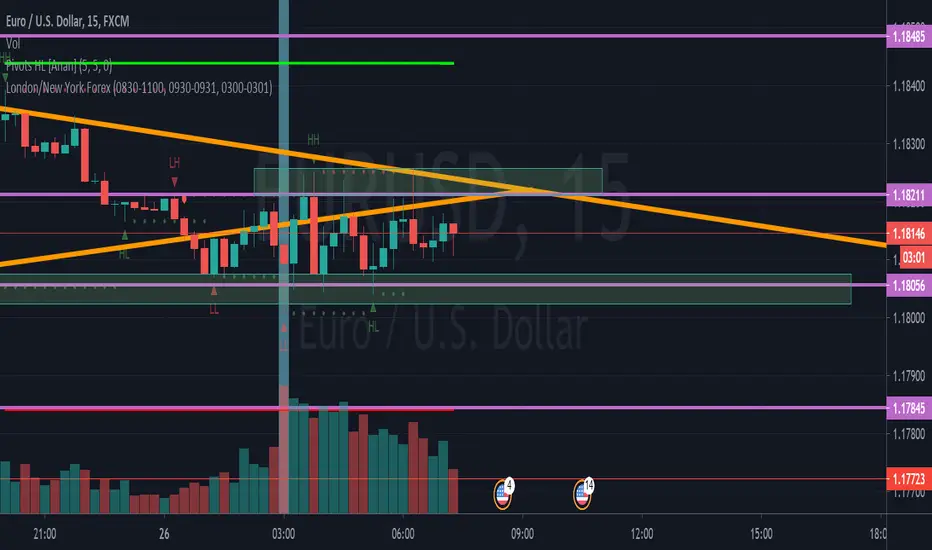
Dexie Indicator v1.0The Dexie Indicator is a Forex indicator system built for the 5 min chart. It is suitable for Forex traders and Nadex users and provides BUY/SELL signals with alerts and comes with a series of 8 custom built Moving Averages designed to reduce the need for chart drawing.
This indicator can be used by beginners out of the box and requires very little trading experience to be successful.
The more advanced trader can work with this tool to greatly increase their success rate and make for a much more enjoyable trading experience.
Please contact for more details.
Dexie Indicator with BUY/SELL signals displayed only:
Dexie Indicator with BUY/SELL signals, Bollinger Bands and custom Moving Averages:
Dexie Indicator with all custom Moving Averages displayed:
Dexie Indicator slower Moving average bull cross example:
Dexie Indicator slower Moving average bear cross example:

Dexie Indicator v1.0The Dexie Indicator is a complete Forex trading system built for the 5 min chart. It is suitable for Nadex users and provides BUY/SELL signals with alerts and comes with a series of 8 custom built Moving Averages designed to reduce the need for chart drawing.
This indicator can be used by beginners out of the box and requires very little trading experience to be successful.
The more advanced trader can work with this tool to greatly increase their success rate and make for a much more enjoyable trading experience.
Please contact for more details.
Dexie Indicator with BUY/SELL signals displayed only:
Dexie Indicator with BUY/SELL signals, Bollinger Bands and custom Moving Averages
Dexie Indicator with all custom Moving Averages displayed

Historical Volatility MOEXIndicator of historical volatility.
The indicator is optimized for hourly bars (1h) and displays - red line - 1 day, yellow line - 3 day, green line - 5 day historical volatility .
The indicator is intended for use on futures of the Moscow Exchange MOEX
White lines - confidence interval HV (normal distribution) for a given sigma and days
Parameters
WindowInput - the number of bars calculating the HV red line
WindowInput2 - number of bars calculating the HV yellow line
WindowInput3 - the number of bars calculating the HV green line
SigmaMultiplicatorInput - set the sigma value for calculating the HV confidence interval
Exp_Day - set the number of days to calculate the confidence interval HV
Индикатор исторической волатильности.
Индикатор оптимизирован под часовые бары и отображает - красная линия - 1 дневная, желтая линия - 3 дневная, зеленая линия - 5 дневная историческая волатильность.
The indicator is intended for use on futures of the Moscow Exchange MOEX
Белые линии - доверительный интервал HV (нормальное распределение) при заданной сигма и дней
Параметры
WindowInput - количество баров расчета HV красная линия
WindowInput2 - количество баров расчета HV желтая линия
WindowInput3 - количество баров расчета HV зеленая линия
SigmaMultiplicatorInput - задаем значение сигма для расчета доверительного интервала HV
Exp_Day - задаем количестве дней для расчета доверительного интервала HV
Use the link below to obtain access to this indicator

Historical Volatility CMEIndicator of historical volatility.
The indicator is optimized for hourly bars (1h) and displays - red line - 1 day, yellow line - 3 day, green line - 5 day historical volatility .
The indicator is intended for use on futures of the CME NYMEX
White lines - confidence interval HV (normal distribution) for a given sigma and days
Parameters
WindowInput - the number of bars calculating the HV red line
WindowInput2 - number of bars calculating the HV yellow line
WindowInput3 - the number of bars calculating the HV green line
SigmaMultiplicatorInput - set the sigma value for calculating the HV confidence interval
Exp_Day - set the number of days to calculate the confidence interval HV
Индикатор исторической волатильности.
Индикатор оптимизирован под часовые бары и отображает - красная линия - 1 дневная, желтая линия - 3 дневная, зеленая линия - 5 дневная историческая волатильность.
Индикатор предназначен для использования на фьючерсах бирж CME NYMEX
Белые линии - доверительный интервал HV (нормальное распределение) при заданной сигма и дней
Параметры
WindowInput - количество баров расчета HV красная линия
WindowInput2 - количество баров расчета HV желтая линия
WindowInput3 - количество баров расчета HV зеленая линия
SigmaMultiplicatorInput - задаем значение сигма для расчета доверительного интервала HV
Exp_Day - задаем количестве дней для расчета доверительного интервала HV
Use the link below to obtain access to this indicator

Historical Volatility US StoksIndicator of historical volatility.
The indicator is optimized for hourly bars (1h) and displays - red line - 1 day, yellow line - 3 day, green line - 5 day historical volatility .
The indicator is intended for use on U.S. Stocks
White lines - confidence interval HV (normal distribution) for a given sigma and days
Parameters
WindowInput - the number of bars calculating the HV red line
WindowInput2 - number of bars calculating the HV yellow line
WindowInput3 - the number of bars calculating the HV green line
SigmaMultiplicatorInput - set the sigma value for calculating the HV confidence interval
Exp_Day - set the number of days to calculate the confidence interval HV
Индикатор исторической волатильности.
Индикатор оптимизирован под часовые бары и отображает - красная линия - 1 дневная, желтая линия - 3 дневная, зеленая линия - 5 дневная историческая волатильность.
Индикатор предназначен для использования на акциях, ETF , ETN и индексах американских бирж NYSE NASDAQ и др.
Белые линии - доверительный интервал HV (нормальное распределение) при заданной сигма и дней
Параметры
WindowInput - количество баров расчета HV красная линия
WindowInput2 - количество баров расчета HV желтая линия
WindowInput3 - количество баров расчета HV зеленая линия
SigmaMultiplicatorInput - задаем значение сигма для расчета доверительного интервала HV
Exp_Day - задаем количестве дней для расчета доверительного интервала HV
Use the link below to obtain access to this indicator

Historical exponential volatilityIndicator of Historical volatility according to the exponential model with an additional moving average for CME , NYMEX futures
Window - the number of periods for calculating HV
WindowAdg - the number of periods for calculating the moving average for HV
Индикатор исторической волатильности по экспоненциальной модели с дополнительной скользящей средней. Оптимизирован под фьючерсы CME , NYMEX
Window - количество периодов расчета HV
WindowAdg - количество периодов расчета скользящей средней для HV

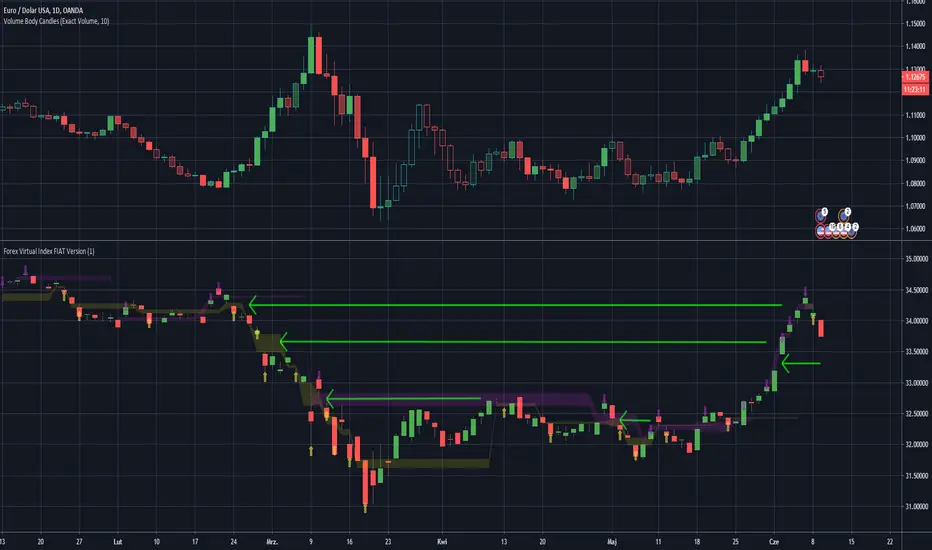
Forex Virtual Index FIAT VersionThis is virtually created FX Fiat pairs index based on OANDAs data.
Pairs are: EUR/USD , AUD/USD , GBP/USD , NZD/USD , AUD/JPY , EUR/JPY , GBP/JPY , USD/JPY , USD/CAD , USD/PLN
Be awared that some pairs like USD/CAD , have reversed correlation to the index.
You may look at the gaps as on standard S/R levels.
ps. Take look inside the scirpt's settings.
ps2. This script is invite-only for the members of our trading group (info in signature, group is free of charge).