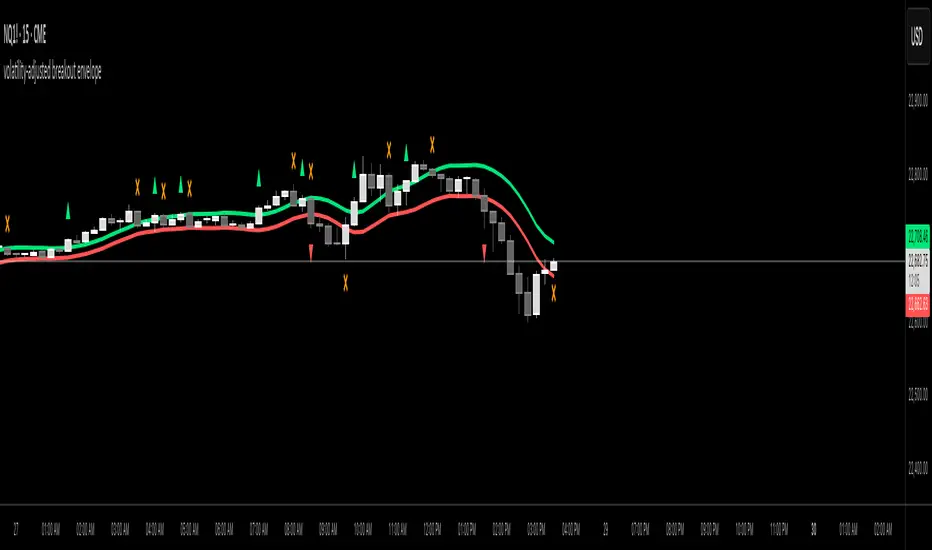
volatility-adjusted breakout envelopethis indicator is designed to help traders visually identify potential entry and exit points based on volatility-adjusted price thresholds. it works by calculating a dynamic expected price move around the previous close using historical volatility data smoothed by exponential moving averages to reduce noise and present a clear range boundary on the chart.
the indicator first computes the logarithmic returns over a user-defined lookback period and calculates the standard deviation of these returns, which represents raw volatility. it annualizes this volatility according to the chart timeframe selected, then uses it to estimate an expected price movement for the current timeframe. this expected move is smoothed to avoid sudden spikes or drops that could cause confusing signals.
using this expected move, the indicator generates two key threshold lines: an upper threshold and a lower threshold. these lines create a volatility-based range around the smoothed previous close price. the thresholds themselves are further smoothed with exponential moving averages to produce smooth, easy-to-interpret lines that adapt to changing market conditions without being choppy.
the core trading signals are generated when the price closes outside of these smoothed threshold ranges. specifically, a long entry signal is indicated when the price closes above the upper threshold for the first time, signaling potential upward momentum beyond normal volatility expectations. a short entry signal occurs when the price closes below the lower threshold for the first time, indicating potential downward momentum.
once an entry signal is triggered, the indicator waits for the price to close back inside the threshold range before signaling an exit. when this occurs, an exit marker is displayed to indicate that the price has returned within normal volatility bounds, which may suggest that the previous trend is losing strength or the breakout has ended.
these signals are visually represented on the chart using small shapes: triangles pointing upwards mark the initial long entries, triangles pointing downwards mark short entries, and x shapes mark the exits for both long and short positions. the colors of these shapes are customizable to suit user preferences.
to use this indicator effectively, traders should watch for the first close outside the smoothed volatility range to consider entering a position in the breakout direction. the exit signals help identify when price action reverts back into the expected range, which can be used to close or reduce the position. this method emphasizes trading breakouts supported by statistically significant moves relative to recent volatility while providing a clear exit discipline.
this indicator is best applied to intraday or daily charts with consistent volatility and volume characteristics. users should adjust the volatility lookback period, smoothing factor, and trading session times to match their specific market and trading style. because it relies on price volatility rather than fixed price levels, it can adapt to changing market conditions but should be combined with other analysis tools and proper risk management.
overall, this indicator provides a smoothed, dynamic volatility envelope with clear visual entry and exit cues based on first closes outside and back inside these envelopes, making it a helpful assistant for manual traders seeking to capture statistically significant breakouts while maintaining disciplined exits.
Tarihi Volatilite
VWAP Deviation Channels with Probability (Lite)VWAP Deviation Channels with Probability (Lite)
Version 1.2
Overview
This indicator is a powerful tool for intraday traders, designed to identify high-probability areas of support and resistance. It plots the Volume-Weighted Average Price (VWAP) as a central "value" line and then draws statistically-based deviation channels around it.
Its unique feature is a dynamic probability engine that analyzes thousands of historical price bars to calculate and display the real-time likelihood of the price touching each of these deviation levels. This provides a quantifiable edge for making trading decisions.
Core Concepts Explained
This indicator is built on three key concepts:
The VWAP (Volume-Weighted Average Price): The dotted midline of the channels is the session VWAP. Unlike a Simple Moving Average (SMA) which only considers price, the VWAP incorporates volume into its calculation. This makes it a much more significant benchmark, as it represents the true average price where the most business has been transacted during the day. It's heavily used by institutional traders, which is why price often reacts strongly to it.
Standard Deviation Channels: The channels above and below the VWAP are based on standard deviations. Standard deviation is a statistical measure of volatility.
- Wide Bands: When the channels are wide, it signifies high volatility.
- Narrow Bands: When the channels are tight and narrow, it signifies low volatility and
consolidation (a "squeeze").
The Conditional Probability Engine: This is the heart of the indicator. For every deviation level, the script displays a percentage. This percentage answers a very specific question:
"Based on thousands of previous bars, when the last candle had a certain momentum (bullish or bearish), what was the historical probability that the price would touch this specific level?"
The probabilities are calculated separately depending on whether the previous candle was green (bullish) or red (bearish). This provides a nuanced, momentum-based edge. The level with the highest probability is highlighted, acting as a "price magnet."
How to Use This Indicator
Recommended Timeframes:
This indicator is designed specifically for intraday trading. It works best on timeframes like the 1-minute, 5-minute, and 15-minute charts. It will not display correctly on daily or higher timeframes.
Recommended Trading Strategy: Mean Reversion
The primary strategy for this indicator is "Mean Reversion." The core idea is that as the price stretches to extreme levels far away from the VWAP (the "mean"), it is statistically more likely to "snap back" toward it.
Here is a step-by-step guide to trading this setup:
1. Identify the Extreme: Wait for the price to push into one of the outer deviation bands (e.g., the -2, -3, or -4 bands for a buy setup, or the +2, +3, or +4 bands for a sell setup).
2. Look for the High-Probability Zone: Pay close attention to the highlighted probability label. This is the level that has historically acted as the strongest magnet for price. A touch of this level represents a high-probability area for a potential reversal.
3. Wait for Confirmation: Do not enter a trade just because the price has touched a band. Wait for a confirmation candle that shows momentum is shifting.
- For a Buy: Look for a strong bullish candle (e.g., a green engulfing candle or a hammer/pin
bar) to form at the lower bands.
- For a Sell: Look for a strong bearish candle (e.g., a red engulfing candle or a shooting star)
to form at the upper bands.
Define Your Exit:
- Take Profit: A logical primary target for a mean reversion trade is the VWAP (midLine).
- Stop Loss: A logical place for a stop-loss is just outside the next deviation band. For
example, if you enter a long trade at the -3 band, your stop loss could be placed just
below the -4 band.
Disclaimer: This indicator is a tool for analysis and should not be considered a standalone trading system. Trading involves significant risk, and past performance is not indicative of future results. Always use this indicator in conjunction with other forms of analysis and sound risk management practices.

ATR Screener with Labels and ShapesWeekly Daily ATR Pine Scanner
To find out tightness or contraction in a stock we needs to check if volatality is decreasing as well as compared to previous 14 or 10 bars volatility . we check this for weekly and then for Daily , so that we can enter in a stock which is tightest in recent times.
Condition is :
1. Weekly Candle ATR x 0.8 < 10 Week ATR
2. Daily Candle ATR x 0.6 < 14 Day ATR
When both of the conditions are met then they signifies that the stock has tightened in weekly and daily aswell . so now we can find ways to enter during max squeeze.
How to scan in Pine Scanner ?
FIrst add indicator as favourite and Go to pine scanner page in trading view and then scan your watchlist and there you will see 3 columns 1 with only Weekly conditions met , 2 with only Daily and 3rd with Both conditions met .
Select stocks and move to new watchlist and now you have those stocks which has contracted the most in recent times .

Options Volatility Strategy Analyzer [TradeDots]The Options Volatility Strategy Analyzer is a specialized tool designed to help traders assess market conditions through a detailed examination of historical volatility, market benchmarks, and percentile-based thresholds. By integrating multiple volatility metrics (including VIX and VIX9D) with color-coded regime detection, the script provides users with clear, actionable insights for selecting appropriate options strategies.
📝 HOW IT WORKS
1. Historical Volatility & Percentile Calculations
Annualized Historical Volatility (HV): The script automatically computes the asset’s historical volatility using log returns over a user-defined period. It then annualizes these values based on the chart’s timeframe, helping you understand the asset’s typical volatility profile.
Dynamic Percentile Ranks: To gauge where the current volatility level stands relative to past behavior, historical volatility values are compared against short, medium, and long lookback periods. Tracking these percentile ranks allows you to quickly see if volatility is high or low compared to historical norms.
2. Multi-Market Benchmark Comparison
VIX and VIX9D Integration: The script tracks market volatility through the VIX and VIX9D indices, comparing them to the asset’s historical volatility. This reveals whether the asset’s volatility is outpacing, lagging, or remaining in sync with broader market volatility conditions.
Market Context Analysis: A built-in term-structure check can detect market stress or relative calm by measuring how VIX compares to shorter-dated volatility (VIX9D). This helps you decide if the present environment is risk-prone or relatively stable.
3. Volatility Regime Detection
Color-Coded Background: The analyzer assigns a volatility regime (e.g., “High Asset Vol,” “Low Asset Vol,” “Outpacing Market,” etc.) based on current historical volatility percentile levels and asset vs. market ratios. A color-coded background highlights the regime, enabling traders to quickly interpret the market’s mood.
Alerts on Regime Changes & Spikes: Automated alerts warn you about any significant expansions or contractions in volatility, allowing you to react swiftly in changing conditions.
4. Strategy Forecast Table
Real-Time Strategy Suggestions: At the close of each bar, an on-chart table generates suggested options strategies (e.g., selling premium in high volatility or buying premium in low volatility). These suggestions provide a quick summary of potential tactics suited to the current regime.
Contextual Market Data: The table also displays key statistics, such as VIX levels, asset historical volatility percentile, or ratio comparisons, helping you confirm whether volatility conditions warrant more conservative or more aggressive strategies.
🛠️ HOW TO USE
1. Select Your Timeframe: The script supports multiple timeframes. For short-term trading, intraday charts often reveal faster shifts in volatility. For swing or position trading, daily or weekly charts may be more stable and produce fewer false signals.
2. Check the Volatility Regime: Observe the background color and on-chart labels to identify the current regime (e.g., “HIGH ASSET VOL,” “LOW VOL + LAGGING,” etc.).
3. Review the Forecast Table: The table suggests strategy ideas (e.g., iron condors, long straddles, ratio spreads) depending on whether volatility is elevated, subdued, or spiking. Use these as a starting point for designing trades that match your risk tolerance.
4. Combine with Additional Analysis: For optimal results, confirm signals with your broader trading plan, technical tools (moving averages, price action), and fundamental research. This script is most effective when viewed as one component in a comprehensive decision-making process.
❗️LIMITATIONS
Directional Neutrality: This indicator analyzes volatility environments but does not predict price direction (up/down). Traders must combine with directional analysis for complete strategy selection.
Late or Missed Signals: Since all calculations require a bar to close, sharp intrabar volatility moves may not appear in real-time.
False Positives in Choppy Markets: Rapid changes in percentile ranks or VIX movements can generate conflicting or premature regime shifts.
Data Sensitivity: Accuracy depends on the availability and stability of volatility data. Significant gaps or unusual market conditions may skew results.
Market Correlation Assumptions: The system assumes assets generally correlate with S&P 500 volatility patterns. May be less effective for:
Small-cap stocks with unique volatility drivers
International stocks with different market dynamics
Sector-specific events disconnected from broad market
Cryptocurrency-related assets with independent volatility patterns
RISK DISCLAIMER
Options trading involves substantial risk and is not suitable for all investors. Options strategies can result in significant losses, including the total loss of premium paid. The complexity of options strategies requires thorough understanding of the risks involved.
This indicator provides volatility analysis for educational and informational purposes only and should not be considered as investment advice. Past volatility patterns do not guarantee future performance. Market conditions can change rapidly, and volatility regimes may shift without warning.
No trading system can guarantee profits, and all trading involves the risk of loss. The indicator's regime classifications and strategy suggestions should be used as part of a comprehensive trading plan that includes proper risk management, directional analysis, and consideration of broader market conditions.

Support and Resistance Profile with Volatility ClusteringThe indicator begins by looking at recent volatility behavior in the market: it measures the average true range over your chosen “Length” and compares it to the average true range over ten times that period. When volatility over the short window is high relative to longer-term volatility, we mark that period as a “cluster.” As price moves through these clusters—whether in a quiet period or a sudden burst of activity—the script isolates each cluster and examines the sequence of closing prices within it.
Within every cluster, the algorithm next finds the points along the price path that matter most to a human eye, smoothing out minor wobbles and highlighting the peaks and valleys that define the cluster’s shape. It does this by drawing a straight line between the beginning and end of the cluster, then repeatedly snapping the single point that deviates most from that line back onto it and re-interpolating, until it has identified a fixed number of perceptually important points. Those points capture where price really turned or accelerated, stripping away noise so that you see the genuine memory-markers in each volatility episode.
Each of those important points inherits a “weight” based on the cluster’s normalized volatility—essentially how large the average true range in that cluster was relative to its average close. Over your “Main Length for Profile” window, every time one of these weighted points occurs at a particular price level, it adds to a running total in that level’s bin. At the end of the window you see a silhouette of boxes extending to the right of the chart: where boxes are wide, many important points (with high volatility weight) have happened there in the past; where boxes are thin or absent, price memory is light.
For a trader, the value of this profile lies in spotting zones where the market has repeatedly “remembered” price extremes during volatile episodes—those are areas where support or resistance is likely to be strongest. Conversely, gaps in the profile—price levels with little weighted history—suggest frictionless zones. If price enters such a gap, it may move swiftly until it encounters another region of heavy memory. You can use this in several ways: as a filter on breakouts and breakdowns (only trade through a gap when you see sufficient momentum), as a guide for scaling into positions (add when price enters a low-memory zone and tighten stops where memory boxes thicken), or to anticipate where price might pause or reverse (when it reaches a band of wide boxes). By turning raw volatility clusters into a human-readable map of price memory, this tool helps you see at a glance where the market is likely to push or pause—and plan entries, exits, and risk targets accordingly.

Statistical Reliability Index (SRI)Statistical Reliability Index (SRI)
The Statistical Reliability Index (SRI) is a professional financial analysis tool designed to assess the statistical stability and reliability of market conditions. It combines advanced statistical methods to gauge whether current market trends are statistically consistent or prone to erratic behavior. This allows traders to make more informed decisions when navigating trending and choppy markets.
Key Concepts:
1. Extrapolation of Cumulative Distribution Functions (CDF)
What is CDF?
A Cumulative Distribution Function (CDF) is a statistical tool that models the probability of a random variable falling below a certain value.
How it’s used in SRI:
The SRI utilizes the 95th percentile CDF of recent returns to estimate the likelihood of extreme price movements. This helps identify when a market is experiencing statistically significant changes, crucial for forecasting potential breakouts or breakdowns.
Weight in SRI:
The weight of the CDF extrapolation can be adjusted to emphasize its impact on the overall reliability index, allowing customization based on the trader's preference for tail risk analysis.
2. Bias Factor (BF)
What is the Bias Factor?
The Bias Factor measures the ratio of the current market price to the expected mean price calculated over a defined period. It represents the deviation from the typical price level.
How it’s used in SRI:
A higher bias factor indicates that the current price significantly deviates from the historical average, suggesting a potential mean reversion or trend exhaustion.
Weight in SRI:
Adjusting the Bias Factor weight lets users control how much this deviation influences the SRI, balancing between momentum trading and mean reversion strategies.
3. Coefficient of Variation (CV)
What is CV?
The Coefficient of Variation (CV) is a statistical measure that expresses the ratio of the standard deviation to the mean. It indicates the relative variability of asset returns, helping gauge the risk-to-return consistency.
How it’s used in SRI:
A lower CV indicates more stable and predictable price behavior, while a higher CV signals increased volatility. The SRI incorporates the inverse of the normalized CV to reflect price stability positively.
Weight in SRI:
By adjusting the CV weight, users can prioritize consistent price movements over erratic volatility, aligning the indicator with risk tolerance and strategy preferences.
Interpreting the SRI:
1. SRI Plot:
The SRI plot dynamically changes color to reflect market conditions:
Aqua Line: Indicates uptrend stability, signaling statistically consistent upward movements.
Fuchsia Line: Indicates downtrend stability, where statistically reliable downward movements are present.
The overlay background shifts between colors:
Aqua Background: Signifies statistical stability, where trends are historically consistent.
Fuchsia Background: Indicates statistical instability, often associated with trend uncertainty.
Yellow Background: Marks choppy periods, where statistical data suggests that market conditions are not conducive to reliable trading.
2. SRI Volatility Plot:
Displays the volatility of the SRI itself to detect when the indicator is stable or unstable:
Blue Area Fill: Signifies that the SRI is stable, indicating trending conditions.
Yellow Area Fill: Represents choppy or unstable SRI movements, suggesting sideways or unreliable market conditions.
A Chop Threshold Line (dotted yellow) highlights the maximum acceptable SRI volatility before the market is considered too unpredictable.
3. Stability Assessment:
Stable Trend (No Chop):
The SRI is smooth and consistent, often accompanied by aqua or fuchsia lines.
Volatility remains below the chop threshold, indicating a low-risk, trend-following environment.
Chop Mode:
The SRI becomes erratic, and the volatility plot spikes above the threshold.
Marked by a yellow shaded background, indicating uncertain and non-trending conditions.
[Trend Identification:
Use the color-coded SRI line and background to determine uptrend or downtrend reliability.
Be cautious when the SRI volatility plot shows yellow, as this signals trading conditions may not be reliable.
Practical Use Cases:
Trend Confirmation:
Utilize the SRI plot color and background to confirm whether a detected trend is statistically reliable.
Chop Mode Filtering:
During yellow chop periods, it is advisable to reduce trading activity or adopt range-bound strategies.
Strategy Filter:
Combine the SRI with trend-following indicators (like moving averages) to enhance entry and exit accuracy.
Volatility Monitoring:
Pay attention to the SRI volatility plot, as spikes often precede erratic price movements or trend reversals.
Disclaimer:
The Statistical Reliability Index (SRI) is a technical analysis tool designed to aid in market stability assessment and trend validation. It is not intended as a standalone trading signal generator. While the SRI can help identify statistically reliable trends, it is essential to incorporate additional technical and fundamental analysis to make well-informed trading decisions.
Trading and investing involve substantial risk, and past performance does not guarantee future results. Always use risk management practices and consult with a financial advisor to tailor strategies to your individual risk profile and objectives.

Daily Price RangeThe indicator is designed to analyze an instrument’s volatility based on daily extremes (High-Low) and to compare the current day’s range with the typical (median) range over a selected period. This helps traders assess how much of the "usual" daily movement has already occurred and how much may still be possible during the trading day.

[NIC] Volatility Anomaly Indicator (Inspired by Jeff Augen)Volatility Anomaly Indicator (Inspired by Jeff Augen)
The Volatility Anomaly Indicator, inspired by Jeff Augen’s The Volatility Edge in Options Trading, helps traders spot price distortions by analyzing volatility imbalances. It compares short-term (10-day) and long-term (30-day) historical volatility (HV), plotting the ratio in a subgraph with clusters of dots to highlight anomalies—red for volatility spikes (potential sells) and green for calm periods (potential buys).
Originality: This indicator uniquely adapts Augen’s volatility concepts into a visual tool, focusing on relative volatility distortions rather than absolute levels, making it ideal for volatile assets like $TQQQ.
Features:
Calculates the ratio of short-term to long-term volatility.
Detects spikes (ratio > 1.5) and calm periods (ratio < 0.67) with customizable thresholds.
Plots volatility ratio as a blue line, with red/green dots for anomalies.
Includes optional buy/sell signals on the main chart (if overlay is enabled).
How It Works
The indicator computes historical volatility using log returns, then calculates the short-term to long-term volatility ratio. Spikes and calm periods are marked with dots in the subgraph, and threshold lines (1.5 and 0.67) provide context. Buy signals (green triangles) trigger during calm periods, and sell signals (red triangles) during spikes.
How to Use
Apply to any chart (e.g., NASDAQ:TQQQ daily).
Adjust inputs: Short Volatility Period (10), Long Volatility Period (30), Volatility Spike Threshold (1.5).
Watch for red dot clusters (spikes, potential sells) and green dot clusters (calm, potential buys).
Combine with price action or RSI for confirmation.
Why Use This Indicator?
Focuses on volatility-driven price inefficiencies.
Clear visualization with dot clusters.
Customizable for different assets and timeframes.
Limitations
Not a standalone system; requires confirmation.
May give false signals in choppy markets.

Volatility Regime Classifier | ATRP Percentile ZonesThis indicator helps you understand the current volatility environment of any asset by comparing recent ATR-based values to its historical range.
It defines four regimes:
🔴 Low Volatility: Volatility is decreasing
🟢 Normal: Volatility is increasing but still below average
🟠 High: Volatility is elevated
🟣 Extreme: Volatility is very high compared to recent history
⚙️ How it works
We calculate the Average True Range (ATR) as a percentage of price (ATRP), then compare a short-term ATR to a longer-term one. Their difference shows whether volatility is picking up or slowing down.
To make the signal more adaptive, we look at the distribution of recent volatility over a rolling window. We compute the 50th and 70th percentiles of that history to set dynamic thresholds.
About distribution & percentiles
Volatility in financial markets doesn't follow a normal (Gaussian) distribution, it's often skewed, with sudden spikes and fat tails. That means fixed thresholds (like "ATR > 20") can be misleading or irrelevant across assets and timeframes.
Using percentiles solves this:
The 50th percentile marks the middle of the recent volatility range.
The 70th percentile captures a zone where volatility is unusually high, but not too rare, which keeps the signal usable and not overly sensitive.
These levels offer a balance:
⚖️ not too reactive, not too slow — just enough to highlight meaningful shifts.
✅ Use cases
Spot changes in market conditions
Filter or adapt strategies depending on the regime
Adjust position sizing and risk dynamically

Tremor Tracker [theUltimator5]Tremor Tracker is a volatility monitoring tool that visualizes the "tremors" of price action by measuring and analyzing the average volatility of the current trading range, working on any timeframe. This indicator is designed to help traders detect when the market is calm, when volatility is building, and when it enters a potentially unstable or explosive state by using a lookback period to determine the average volatility and highlights outliers.
🔍 What It Does
Calculates bar-level volatility as the percentage difference between the high and low of each candle.
Applies a user-selected moving average (SMA, EMA, or WMA) to smooth out short-term noise and highlight trends in volatility.
Compares current volatility to its long-term average over a configurable lookback period.
Dynamically colors each volatility bar based on how extreme it is relative to historical behavior:
🟢 Lime — Low volatility (subdued, ranging conditions)
🟡 Yellow — Moderate or building volatility
🟣 Fuchsia — Elevated or explosive volatility
⚙️ Customizable Settings
Low Volatility Limit and High Volatility Limit: Define the thresholds for color changes based on volatility's ratio to its average.
Volatility MA Length: Adjust the smoothing period for the volatility moving average.
Average Volatility Lookback: Set how many bars are used to calculate the long-term average.
MA Type: Choose between SMA, EMA, or WMA for smoothing.
Show Volatility MA Line?: Toggle the display of the smoothed volatility trendline.
Show Raw Volatility Bars?: Toggle the display of raw per-bar volatility with dynamic coloring.
🧠 Use Cases
Identify breakout conditions: When volatility spikes above average, it may signal the onset of a new trend or a news-driven breakout.
Avoid chop zones: Prolonged periods of low volatility often precede sharp moves — a classic “calm before the storm” setup.
Timing reversion trades: Detect overextended conditions when volatility is well above historical norms.
Adapt strategies by volatility regime: Use color feedback to adjust risk, position sizing, or strategy selection based on real-time conditions.
📌 Notes
Volatility is expressed as a percentage, making this indicator suitable for use across different timeframes and asset classes.
The tool is designed to be visually intuitive, so traders can quickly spot evolving volatility states without diving into raw numbers.
ATR % Oscillator - DolphinTradeBot1️⃣ Overview
🔸 This is a simplified version of ATR and TR that shows volatility as percentage changes , making it easier to compare two symbols.
🔸 The indicator compares the volatility of two different assets by calculating the percentage-based price ranges and their moving averages .
📌 This is especially useful for pair traders, as it helps identify which symbol is more volatile, allowing for strategic decisions based on relative movement rather than overall market direction.
2️⃣ How Is It Work?
🔸 For each symbol, it calculates the absolute percentage difference between either:
• Close and Open (net price change), or
• High and Low (daily price range).
🔸 The results are visualized as column bars — the taller the bar, the higher the volatility.
🔸 It also plots a moving average line (SMA) based on the selected range length.
📌 These calculations are independent of the chart you're on — they work purely based on the two selected symbols.
If no symbols are selected, it defaults to using the current chart's symbol.
3️⃣ How to Use It?
With this indicator, you can:
🔸 Compare the volatility between two assets.
🔸 Detect sudden volatility spikes that may signal upcoming momentum.
🔸 Support spread, arbitrage, or correlation-based strategies .
🔸 See which symbol is gaining market attention (a larger difference = more activity).
Example: Compare BTC vs ETH to see which one is dominating in terms of price action or volatility.
4️⃣⚙️ Settings
🔸 Symbol Settings
• Symbol-1 / Symbol-2: Choose the two assets to compare.
• Checkboxes: Enable/disable visibility for each symbol's data.
🔸 Calculation Settings
• Range Average: The number of bars used for the moving average.
• Calculation Source:
- Close-Open: Measures net price movement.
- High-Low: Measures total price range.

(US) Historical Trade WarsHistorical U.S. Trade Wars Indicator
Overview
This indicator visualizes major U.S. trade wars and disputes throughout modern economic history, from the McKinley Tariff of 1890 to recent U.S.-China tensions. This U.S.-focused timeline is perfect for macro traders, economic historians, and anyone looking to understand how America's trade conflicts correlate with market movements.
Features
Comprehensive U.S. Timeline: Covers 130+ years of U.S.-centered trade disputes with historically accurate dates.
Color-Coded Events:
🔴 Red: Marks the beginning of a U.S. trade war or major dispute.
🟡 Yellow: Highlights significant events within a trade conflict.
🟢 Green: Shows resolutions or ends of trade disputes.
Global Partners/Rivals: Tracks U.S. trade relations with China, Japan, EU, Canada, Mexico, Brazil, Argentina, and others.
Country Flags: Uses emoji flags for easy visual identification of nations in trade relations with the U.S.
Major Trade Wars Covered:
McKinley Tariff (1890-1894)
Smoot-Hawley Tariff Act (1930-1934)
U.S.-Europe Chicken War (1962-1974)
Multifiber Arrangement Quotas (1974-2005)
Japan-U.S. Trade Disputes (1981-1989)
NAFTA and Softwood Lumber Disputes
Clinton and Bush-Era Steel Tariffs
Obama-Era China Tire Tariffs
Rare Earth Minerals Dispute (2012-2014)
Solar Panel Dispute (2012-2015)
TPP and TTIP Negotiations
U.S.-China Trade War (2018-present)
Airbus-Boeing Dispute
Usage
Analyze how markets historically responded to trade war initiations and resolutions.
Identify patterns in market behavior during periods of trade tensions.
Use as an overlay with price action to examine correlations.
Perfect companion for macro analysis on daily, weekly, or monthly charts.
About
This indicator is designed as a historical reference tool for traders and economic analysts focusing on U.S. trade policy and its global impact. The dates and events have been thoroughly researched for accuracy. Each label includes emojis to indicate the U.S. and its trade partners/rivals, making it easy to track America's evolving trade relationships across time.
Note: This indicator works best on larger timeframes (daily, weekly, monthly) due to the historical span covered.

PumpC Opening Range Breakout (ORB) Stretch RangePumpC ORB Stretch
The PumpC ORB Stretch is a volatility-based indicator that helps traders identify potential breakout zones by analyzing how price typically behaves around the open. This tool is inspired by concepts introduced by Toby Crabel in his well-known book “Day Trading with Short-Term Price Patterns and Opening Range Breakout.”
Rather than predicting market direction, this indicator highlights areas where price is likely to expand based on recent volatility. It is designed for traders who prefer dynamic, data-driven breakout levels over static support and resistance zones.
What Is the "Stretch"?
In Toby Crabel’s framework, the Stretch is the average of the smaller of two price moves:
The distance from the open to the high of the bar
The distance from the open to the low of the bar
This smaller value captures the “quiet side” of the candle and reflects recent price compression. Averaged over multiple periods (commonly 10 daily bars), it creates a baseline to assess how far price may move away from the open under typical market conditions.
How the Indicator Works
The PumpC ORB Stretch follows this process:
Uses a higher timeframe (such as daily) to calculate the open, high, and low.
For each bar, measures the smaller of the two distances: open to high or open to low.
Applies a moving average to the result over a user-defined number of bars (default is 10).
Multiplies the average stretch by customizable levels (e.g., 0.382, 1.0, 2.0).
Plots breakout levels above and below the open of the selected timeframe.
The result is a set of adaptive levels that expand or contract with market volatility.
Customization Options
Stretch Timeframe: Choose the timeframe used for stretch calculation (default: Daily).
Stretch Length: Set the number of bars to include in the moving average.
Breakout Levels: Enable or disable individual levels and define multipliers.
Color Settings: Customize colors for each range level for easy visual distinction.
Plot Style: Circular markers are used to reduce chart clutter and improve readability.
How to Use It
Use plotted levels to anticipate possible breakouts from the open.
Adjust stretch length to reflect short-term or longer-term volatility trends.
Combine this tool with momentum indicators, volume, or price action for confirmation.
Use levels to help guide stop placement or profit targets in breakout strategies.
Important Notes
This script is based on an interpretation of Crabel’s concepts and is not affiliated with Crabel Capital or the original author.
The indicator does not predict direction; it is a tool for context and structure.
It is recommended that users test and validate this tool in a simulated environment before applying it to live trading.
This indicator is intended for educational purposes only.
Licensing and Attribution
This script is built entirely in Pine Script v5 and follows TradingView’s open-source standards. It does not include any third-party or proprietary code. If you modify or share it, please credit the original idea and follow all TradingView script publishing rules.

Hourly Volatility Explorer📊 Hourly Volatility Explorer: Master The Market's Pulse
Unlock the hidden rhythms of price action with this sophisticated volatility analysis tool. The Hourly Volatility Explorer reveals the most potent trading hours across multiple time zones, giving you a strategic edge in timing your trades.
🌟 Key Features:
⏰ Multi-Timezone Analysis
• GMT (UTC+0)
• EST (UTC-5) - New York
• BST (UTC+1) - London
• JST (UTC+9) - Tokyo
• AEST (UTC+10) - Sydney
Perfect for tracking major market sessions and their overlaps!
📈 Dynamic Visualization
• Color-gradient hourly bars for instant pattern recognition
• Real-time volatility comparison
• Interactive data table with comprehensive statistics
• Automatic highlighting of peak volatility periods
🎯 Strategic Applications:
Day Trading:
• Identify optimal trading windows
• Avoid low-liquidity periods
• Capitalize on session overlaps
• Fine-tune entry/exit timing
Risk Management:
• Set appropriate stop losses based on hourly volatility
• Adjust position sizes for different market hours
• Optimize risk-reward ratios
• Plan around high-impact hours
Global Market Analysis:
• Track volatility across all major sessions
• Spot institutional trading patterns
• Identify quiet vs. active periods
• Monitor 24/7 market dynamics
💡 Perfect For:
• Forex traders navigating global sessions
• Crypto traders in 24/7 markets
• Day traders optimizing execution times
• Algorithmic traders fine-tuning strategies
• Risk managers calibrating exposure
📊 Advanced Features:
• Rolling 3-month analysis for reliable patterns
• Precise pip movement calculations
• Sample size tracking for statistical validity
• Real-time current hour comparison
• Color-coded visual system for instant insights
⚡ Pro Trading Tips:
• Use during major session overlaps for maximum opportunity
• Compare patterns across different instruments
• Combine with volume analysis for deeper insights
• Track seasonal variations in hourly patterns
• Build trading schedules around peak hours
🎓 Educational Value:
• Understand market microstructure
• Learn global market dynamics
• Master timezone relationships
• Develop timing intuition
🛠️ Customization:
• Adjustable lookback period
• Flexible pip multiplier
• Multiple timezone options
• Visual preference settings
Whether you're scalping the 1-minute chart or managing longer-term positions, the Hourly Volatility Explorer provides the precise timing intelligence needed for today's global markets.
Transform your trading schedule from guesswork to science. Know exactly when markets move, why they move, and how to position yourself for maximum opportunity.
#TechnicalAnalysis #Trading #Volatility #MarketTiming #DayTrading #Forex #Crypto #TradingView #PineScript #MarketAnalysis #TradingStrategy #RiskManagement #GlobalMarkets #FinancialMarkets #TradingTools #MarketStructure #PriceAction #Scalping #SwingTrading #AlgoTrading

Risk MeterRisk Meter Indicator for TradingView
The Risk Meter is a powerful market risk assessment tool designed to help traders evaluate the current risk environment using a simple, data-driven score. By analyzing four critical market factors—VIX (volatility index), market breadth, trailing volatility, and credit spreads—the indicator generates a risk score between 0 and 4. This score empowers traders to make informed decisions about hedging, exiting positions, or re-entering the market, with clear visual cues and alerts for intraday monitoring.
What It Does
Calculates a Risk Score: Assigns a score from 0 to 4, where each point reflects an active risk condition based on four market indicators.
Identifies Risk Levels:
A score of 3 or higher indicates a high-risk environment, suggesting traders consider hedging or reducing exposure.
A score of 2 or lower for at least two consecutive days signals a potential opportunity to re-enter the market.
Provides Visual Feedback: Uses color-coded Columns, threshold markers, and a component table for quick interpretation.
Supports Decision-Making: Offers a structured approach to managing risk and timing trades.
How It Works
The Risk Meter aggregates four key risk conditions, each contributing 1 point to the total score when triggered:
Elevated and Rising VIX (Risk 1)
Condition: The VIX is above 18 and higher than it was 20 days ago.
Purpose: Detects increasing market fear or uncertainty.
Market Breadth Dropping (Risk 2)
Condition: Either:
Fewer than 50% of S&P 500 stocks are above their 200-day moving average and fewer than 70% are above their 50-day moving average, or
The 3-day EMA of the 200-day breadth falls below 80% of its 20-day SMA.
Purpose: Identifies weakening participation across the market.
Trailing Volatility (Risk 3)
Condition: The 30-day annualized volatility of the equal-weight S&P 500 (RSP) exceeds 35%.
Purpose: Highlights periods of heightened price instability.
Credit Spreads (Risk 4)
Condition: The price ratio of high-yield bonds (HYG) to Treasuries (TLT or IEF) is lower than it was 20 days ago, indicating widening credit spreads.
Purpose: Signals potential stress in credit markets.
The total risk score is the sum of these conditions (0 to 4). Additionally, the indicator tracks consecutive days with a score of 2 or lower to generate re-entry signals.
How to Read It Intraday
The Risk Meter is built on daily data but can be monitored intraday for real-time insights. Here’s how traders can interpret it:
Risk Score Plot:
Displayed as a step line ranging from 0 to 4.
Colors:
Red: High risk (score ≥ 3) – caution advised.
Green: Re-entry signal – score ≤ 2 for at least two consecutive days (triggered when the count increments from 1 to 2).
Blue: Neutral or low risk (score < 3 without a re-entry signal).
Threshold Lines:
Dashed Gray Line at 3: Marks the high-risk threshold.
Dotted Gray Line at 2: Indicates the low-risk threshold for re-entry signals.
Risk Component Table:
Located in the top-right corner, it lists:
VIX, Breadth, Volatility, and Credit Spreads.
Status: Shows "" (warning, red) if the risk condition is met, or "✓" (safe, blue) if not.
Helps traders pinpoint which factors are driving the score.
Alerts:
High Risk Alert: Triggers when the score moves from < 3 to ≥ 3.
Re-entry Signal Alert: Triggers when the score ≤ 2 for two consecutive days.
Intraday Usage Tips
Check the indicator throughout the day for early signs of risk shifts, especially if the score is near a threshold (e.g., 2 or 3).
Combine with other intraday tools (e.g., price action, volume) since the Risk Meter updates daily but reflects broader market conditions.
How Traders Can Use It
High-Risk Signal (Score ≥ 3):
Consider hedging positions (e.g., with options) or reducing equity exposure to protect against potential downturns.
Re-entry Signal (Score ≤ 2 for 2+ Days):
Look to re-enter the market or increase exposure, as it suggests stabilizing conditions.
Daily Risk Management:
Use the score and table to assess overall market health and adjust strategies accordingly.
Alert-Driven Trading:
Set up alerts to stay notified of critical risk changes without constant monitoring.
Why Use the Risk Meter?
This indicator offers a systematic, multi-factor approach to risk assessment, blending volatility, breadth, and credit market data into an easy-to-read score. Whether you’re an intraday trader or a longer-term investor, the Risk Meter helps you stay proactive, avoid surprises, and time your trades with greater confidence.
Financial Risk Disclaimer for the Risk Meter Tool
Important Notice: The Risk Meter is a market risk assessment tool designed to provide insights into current market conditions based on historical data and predefined indicators. It is intended for informational and educational purposes only and should not be considered financial advice, a recommendation to buy or sell any securities, or a guarantee of future market performance.
Key Considerations
No Guarantee of Accuracy: While the Risk Meter utilizes reliable data sources and established financial metrics, the creators do not guarantee the accuracy, completeness, or timeliness of the information provided. Financial markets are complex and subject to rapid, unpredictable changes, and the tool’s output may not fully reflect all market dynamics.
Market Risks: Trading and investing in financial markets carry significant risks, including the potential loss of principal. Market volatility, economic shifts, and other factors can lead to unexpected outcomes. Past performance is not a reliable indicator of future results, and the Risk Meter’s assessments are based on historical data, not future predictions.
Not a Substitute for Professional Advice: The Risk Meter is not intended to replace personalized financial guidance. Users are strongly encouraged to consult a qualified financial advisor, perform their own research, and evaluate their personal financial situation, risk tolerance, and investment objectives before making any trading or investment decisions.
Limitation of Liability: The creators of the Risk Meter, including any affiliates, developers, or contributors, are not liable for any direct, indirect, incidental, or consequential losses or damages arising from the use of this tool. This includes, but is not limited to, financial losses, missed opportunities, or decisions based on the tool’s output.
User Responsibility: By using the Risk Meter, you accept full responsibility for your trading and investment decisions. You acknowledge that you use the tool at your own risk and that the creators bear no responsibility for any outcomes resulting from its use.
Final Note
The Risk Meter is a supplementary tool designed to enhance your understanding of market risk. It is not a comprehensive solution for investment management. Approach trading and investing with caution, ensuring your decisions align with your personal financial strategy.

Liquidity Market Seeking SwiftEdgeThis indicator is designed to identify potential liquidity levels on the chart by detecting swing highs and lows, which are often areas where stop-loss orders or significant orders accumulate. It visualizes these levels with horizontal lines and labels on the right side of the chart, color-coded based on volume to help traders understand where the market might seek liquidity.
How It Works
Swing Highs and Lows: The indicator uses the ta.pivothigh and ta.pivotlow functions to identify significant swing points over a user-defined lookback period (Swing Length). These points are considered potential liquidity levels where stop-loss orders might be placed.
Volume Analysis: The indicator compares the volume at each swing point to the average volume over a specified period (Volume Average Length). Levels with above-average volume are colored red, indicating higher liquidity, while levels with below-average volume are colored green.
Liquidity Visualization: Horizontal dashed lines are drawn at each identified level, extending across the chart. Labels on the right side display the estimated liquidity amount (simulated based on volume and a multiplier, Volume Multiplier for Liquidity).
Sell Signal: A "SELL NOW" label appears when the price approaches a liquidity level after an uptrend (detected using a simple moving average crossover). This suggests a potential reversal as the market may target liquidity at that level.
Strategy Concept: Market Seeking Liquidity
The indicator is based on the concept that markets often move toward areas of high liquidity, such as clusters of stop-loss orders or significant order accumulations. These liquidity pools are typically found around swing highs and lows, where traders place their stop-losses or large orders. By identifying these levels and highlighting those with higher volume (red lines), the indicator aims to show where the market might move to "grab" this liquidity. For example, after an uptrend, the market may reverse at a swing high to take out stop-losses above that level, providing liquidity for larger players to enter or exit positions.
Settings
Swing Length: The number of bars to look back for detecting swing highs and lows. Default is 20.
Liquidity Threshold: The price threshold for merging nearby levels to avoid duplicates. Default is 0.001.
Volume Average Length: The period for calculating the average volume to compare against. Default is 20.
Volume Multiplier for Liquidity: A multiplier to scale the volume into a simulated liquidity amount (displayed as "K"). Default is 1000.
Usage Notes
Use this indicator on any timeframe, though it may be more effective on higher timeframes (e.g., 1H, 4H) where swing points are more significant.
Red lines indicate levels with higher volume, suggesting stronger liquidity pools that the market might target.
Green lines indicate levels with lower volume, which may be less significant.
The "SELL NOW" signal is a basic example of how to use liquidity levels for trading decisions. It appears when the price approaches a liquidity level after an uptrend, but it should be used in conjunction with other analysis.
Adjust the Volume Multiplier for Liquidity to scale the displayed liquidity amounts based on your instrument (e.g., forex pairs may need a higher multiplier than indices).
Volatility Price FlowCapitalize on market volatility with our new volatility price flow indicator. We have designed this indicator to process historical price movements and indicate when price may have reached exhaustion in the context of current volatility.
This is achieved by taking the price deviation from a user defined moving average, and applying a weighting to the deviations from the candle body and candle wick on both buy side and sell side, over a user defined period. The period of the base moving average, type of moving average and the period of the historical price deviations can all be modified. This creates a typical 'band' style indicator, though with a unique characteristic that the buy and sell side vary independently as well as the band expansion being based on weighted variables tied to the actual price changes, rather than just a standard deviation the moves uniformly.
Additionally, these bands can be merged with an anchored vwap - we do this so that the deviations of price from the moving average can include a more volume based approach to identifying potential pivots.
The end result is an indicator that reflects the current market price movements, identifies and capitalizes on impulsive or beginning moves to indicate potential tops / bottoms / reversals.
The signals are simple - anytime price closes within a band, having been outside the band, a signal is displayed. As a basic guide to setting the indicator up for the first time, we suggest reducing all of the multipliers to a value less than 1. Then gradually increase each one, until the signals reduce in quantity and improve in quality, starting with the price deviation multiplier, then the volatility multiplier and finally the expansion multiplier.
Last of all, alerts can be created based on the current chart timeframe and indicator settings, simply by adding an alert that uses the built in buy or sell signal.
Note: We cannot guarantee the accuracy of the signals provided, since the user creates the signals by modifying the settings, and as such we can take no responsibility for any trading losses incurred using the indicator and highly encourage all users to manage their risk and only risk what you can afford to lose.

Cypto Oscillator with Sortino-like VolatilityEnhanced Inverted Ultimate Oscillator with Sortino-like Volatility
This indicator combines the power of the Ultimate Oscillator with a unique Sortino-like volatility calculation to provide a comprehensive view of market dynamics. It's designed to help traders identify potential turning points and assess the risk associated with price movements.
**Core Components:**
* **Ultimate Oscillator (UO):** The UO is a momentum indicator that incorporates short, medium, and long-term price action to identify overbought and oversold conditions. This indicator inverts and normalizes the UO to a 0-10 scale, providing a clear view of momentum shifts.
* **Sortino-like Volatility:** Instead of a standard deviation, this indicator uses a downside deviation calculation. This focuses specifically on *negative* price movements, offering a more relevant measure of risk for most traders. By not penalizing upside volatility, it avoids giving false signals during strong bull runs. The downside deviation is scaled as a percentage of the closing price for cross-asset comparability.
* **Volatility Signal:** The inverted UO is multiplied by the downside deviation to create a combined volatility signal. This signal reflects both momentum and downside risk, providing a more nuanced market perspective.
**Key Features and Uses:**
* **Identifying Potential Turning Points:** Divergences between the UO and price action can signal potential trend reversals. Look for the UO to make higher lows while price makes lower lows (bullish divergence) or the UO to make lower highs while price makes higher highs (bearish divergence).
* **Assessing Downside Risk:** The Sortino-like volatility component helps traders gauge the potential for downside price swings. Higher volatility suggests greater risk.
* **Dynamic Volatility Thresholds:** The indicator includes adjustable upper and lower volatility thresholds, based on a moving average of the volatility signal. These thresholds can be used to identify periods of unusually high or low volatility.
* **Customizable Lookback Periods:** Traders can adjust the lookback periods for the UO and the standard deviation calculation to fine-tune the indicator to their specific trading style and market conditions.
* **Visualizations:** The indicator provides several visual aids, including:
* A histogram of the volatility signal, colored dynamically based on its relationship to the moving average of volatility. Red indicates volatility above the upper bound, orange between the bounds and green below the lower bound.
* A line plot of the volatility signal.
* An optional moving average of the volatility signal.
* Optional upper and lower volatility threshold lines with a filled range for visual clarity.
* **Alerts:** The indicator includes alert conditions for when the volatility signal crosses above the upper threshold (high volatility) or below the lower threshold (low volatility).
**How to Use:**
1. **Inputs:** Adjust the input parameters to optimize the indicator for your chosen asset and timeframe.
2. **Divergences:** Look for divergences between the UO and price to identify potential trend reversals.
3. **Volatility:** Use the volatility signal and thresholds to assess downside risk.
4. **Alerts:** Enable alerts to be notified of high or low volatility events.
**Disclaimer:** This indicator is for informational purposes only and should not be considered financial advice. Always conduct your own thorough analysis before making any trading decisions.
Key improvements in this description:
Clear and concise language: Easy for traders to understand.
Focus on benefits: Highlights how the indicator can help traders.
Detailed explanation of features: Covers all the important aspects.
How-to-use section: Provides practical guidance.
Disclaimer: Includes a necessary disclaimer.
Emphasis on the Sortino-like approach: This is a unique selling point of your indicator.
Well-structured and formatted: Easy to read and digest.
This description should be a great starting point for sharing your indicator with the TradingView community. You can further customize it by adding screenshots of the indicator in action or linking to a chart where it's being used. Remember to respond to comments and questions from other users to build engagement and improve your indicator over time.
Relative Volume Index [PhenLabs]Relative Volume Index (RVI)
Version: PineScript™ v6
Description
The Relative Volume Index (RVI) is a sophisticated volume analysis indicator that compares real-time trading volume against historical averages for specific time periods. By analyzing volume patterns and statistical deviations, it helps traders identify unusual market activity and potential trading opportunities. The indicator uses dynamic color visualization and statistical overlays to provide clear, actionable volume analysis.
Components
• Volume Comparison: Real-time volume relative to historical averages
• Statistical Bands: Upper and lower deviation bands showing volume volatility
• Moving Average Line: Smoothed trend of relative volume
• Color Gradient Display: Visual representation of volume strength
• Statistics Dashboard: Real-time metrics and calculations
Usage Guidelines
Volume Strength Analysis:
• Values > 1.0 indicate above-average volume
• Values < 1.0 indicate below-average volume
• Watch for readings above the threshold (default 6.5x) for exceptional volume
Trading Signals:
• Strong volume confirms price moves
• Divergences between price and volume suggest potential reversals
• Use extreme readings as potential reversal signals
Optimal Settings:
• Start with default 15-bar lookback for general analysis
• Adjust threshold (6.5x) based on market volatility
• Use with multiple timeframes for confirmation
Best Practices:
• Combine with price action and other indicators
• Monitor deviation bands for volatility expansion
• Use the statistics panel for precise readings
• Pay attention to color gradients for quick assessment
Limitations
• Requires quality volume data for accurate calculations
• May produce false signals during pre/post market hours
• Historical comparisons may be skewed during unusual market conditions
• Best suited for liquid markets with consistent volume patterns
Note: For optimal results, use in conjunction with price action analysis and other technical indicators. The indicator performs best during regular market hours on liquid instruments.

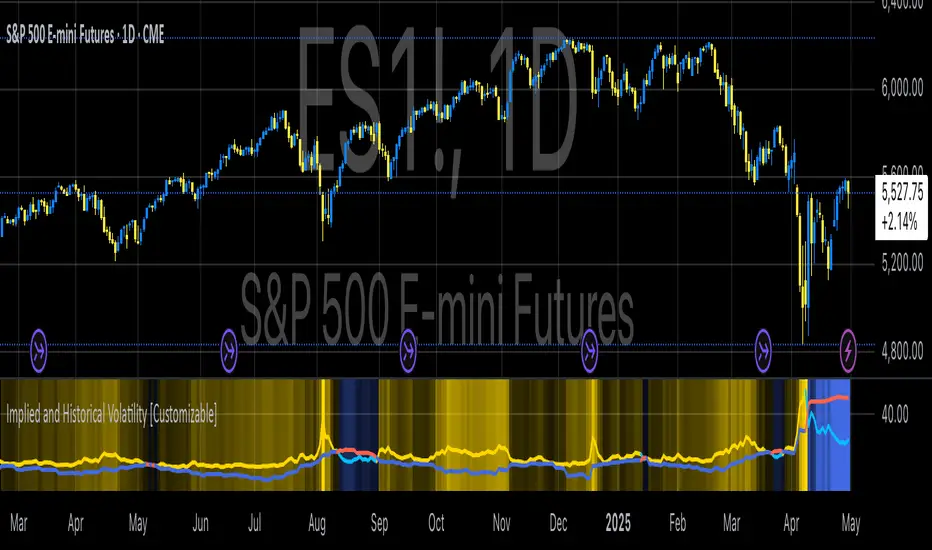
Implied and Historical VolatilityAbstract
This TradingView indicator visualizes implied volatility (IV) derived from the VIX index and historical volatility (HV) computed from past price data of the S&P 500 (or any selected asset). It enables users to compare market participants' forward-looking volatility expectations (via VIX) with realized past volatility (via historical returns). Such comparisons are pivotal in identifying risk sentiment, volatility regimes, and potential mispricing in derivatives.
Functionality
Implied Volatility (IV):
The implied volatility is extracted from the VIX index, often referred to as the "fear gauge." The VIX represents the market's expectation of 30-day forward volatility, derived from options pricing on the S&P 500. Higher values of VIX indicate increased uncertainty and risk aversion (Whaley, 2000).
Historical Volatility (HV):
The historical volatility is calculated using the standard deviation of logarithmic returns over a user-defined period (default: 20 trading days). The result is annualized using a scaling factor (default: 252 trading days). Historical volatility represents the asset's past price fluctuation intensity, often used as a benchmark for realized risk (Hull, 2018).
Dynamic Background Visualization:
A dynamic background is used to highlight the relationship between IV and HV:
Yellow background: Implied volatility exceeds historical volatility, signaling elevated market expectations relative to past realized risk.
Blue background: Historical volatility exceeds implied volatility, suggesting the market might be underestimating future uncertainty.
Use Cases
Options Pricing and Trading:
The disparity between IV and HV provides insights into whether options are over- or underpriced. For example, when IV is significantly higher than HV, options traders might consider selling volatility-based derivatives to capitalize on elevated premiums (Natenberg, 1994).
Market Sentiment Analysis:
Implied volatility is often used as a proxy for market sentiment. Comparing IV to HV can help identify whether the market is overly optimistic or pessimistic about future risks.
Risk Management:
Institutional and retail investors alike use volatility measures to adjust portfolio risk exposure. Periods of high implied or historical volatility might necessitate rebalancing strategies to mitigate potential drawdowns (Campbell et al., 2001).
Volatility Trading Strategies:
Traders employing volatility arbitrage can benefit from understanding the IV/HV relationship. Strategies such as "long gamma" positions (buying options when IV < HV) or "short gamma" (selling options when IV > HV) are directly informed by these metrics.
Scientific Basis
The indicator leverages established financial principles:
Implied Volatility: Derived from the Black-Scholes-Merton model, implied volatility reflects the market's aggregate expectation of future price fluctuations (Black & Scholes, 1973).
Historical Volatility: Computed as the realized standard deviation of asset returns, historical volatility measures the intensity of past price movements, forming the basis for risk quantification (Jorion, 2007).
Behavioral Implications: IV often deviates from HV due to behavioral biases such as risk aversion and herding, creating opportunities for arbitrage (Baker & Wurgler, 2007).
Practical Considerations
Input Flexibility: Users can modify the length of the HV calculation and the annualization factor to suit specific markets or instruments.
Market Selection: The default ticker for implied volatility is the VIX (CBOE:VIX), but other volatility indices can be substituted for assets outside the S&P 500.
Data Frequency: This indicator is most effective on daily charts, as VIX data typically updates at a daily frequency.
Limitations
Implied volatility reflects the market's consensus but does not guarantee future accuracy, as it is subject to rapid adjustments based on news or events.
Historical volatility assumes a stationary distribution of returns, which might not hold during structural breaks or crises (Engle, 1982).
References
Black, F., & Scholes, M. (1973). "The Pricing of Options and Corporate Liabilities." Journal of Political Economy, 81(3), 637-654.
Whaley, R. E. (2000). "The Investor Fear Gauge." The Journal of Portfolio Management, 26(3), 12-17.
Hull, J. C. (2018). Options, Futures, and Other Derivatives. Pearson Education.
Natenberg, S. (1994). Option Volatility and Pricing: Advanced Trading Strategies and Techniques. McGraw-Hill.
Campbell, J. Y., Lo, A. W., & MacKinlay, A. C. (2001). The Econometrics of Financial Markets. Princeton University Press.
Jorion, P. (2007). Value at Risk: The New Benchmark for Managing Financial Risk. McGraw-Hill.
Baker, M., & Wurgler, J. (2007). "Investor Sentiment in the Stock Market." Journal of Economic Perspectives, 21(2), 129-151.
Ultra Volume High Breakoutser Inputs:
length: Defines the period to calculate the moving average of volume.
multiplier: Sets the threshold above the moving average to consider as "Ultra Volume."
breakoutMultiplier: Allows for customization of breakout sensitivity.
Volume Calculation:
The script calculates a simple moving average (SMA) of the volume for a defined period (length).
It then detects if the current volume is higher than the moving average multiplied by the user-defined multiplier.
Breakout Condition:
The script checks if the price has moved above the highest close of the previous length periods while the volume condition for "Ultra Volume" is true.
Visuals:
The script marks the breakout with an upward label below the bar (plotshape), colored green for easy identification.
Ultra volume is highlighted with a red histogram plot.
Alert Condition:
An alert condition is included to trigger whenever an ultra volume high breakout occurs.
Customization:
You can adjust the length, multiplier, and breakoutMultiplier to fit your strategy and asset volatility.
Alerts can be set in TradingView to notify you when this condition is met.
Let me know if you'd like further customization or explanation!

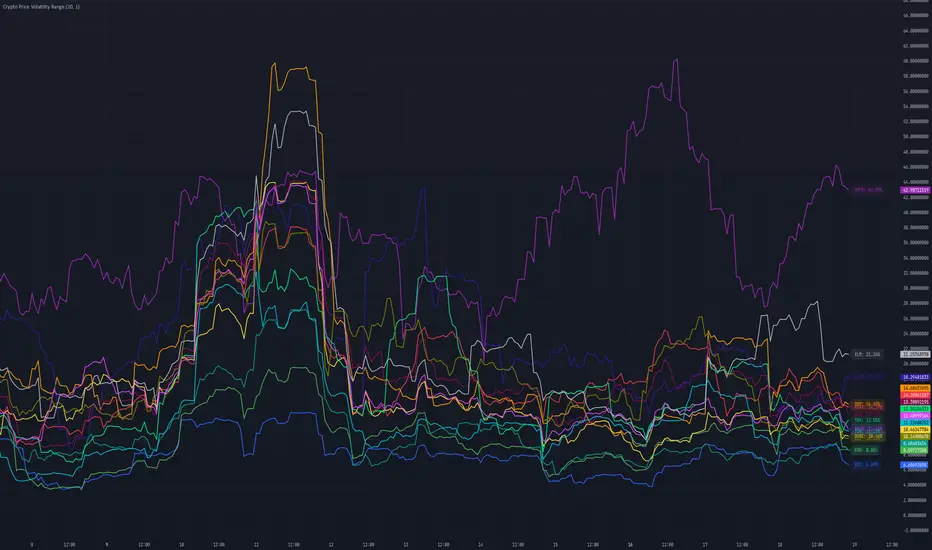
Crypto Price Volatility Range# Cryptocurrency Price Volatility Range Indicator
This TradingView indicator is a visualization tool for tracking historical volatility across multiple major cryptocurrencies.
## Features
- Real-time volatility tracking for 14 major cryptocurrencies
- Customizable period and standard deviation multiplier
- Individual color coding for each currency pair
- Optional labels showing current volatility values in percentage
## Supported Cryptocurrencies
- Bitcoin (BTC)
- Ethereum (ETH)
- Avalanche (AVAX)
- Dogecoin (DOGE)
- Hype (HYPE)
- Ripple (XRP)
- Binance Coin (BNB)
- Cardano (ADA)
- Tron (TRX)
- Chainlink (LINK)
- Shiba Inu (SHIB)
- Toncoin (TON)
- Sui (SUI)
- Stellar (XLM)
## Settings
- **Period**: Timeframe for volatility calculation (default: 20)
- **Standard Deviation Multiplier**: Multiplier for standard deviation (default: 1.0)
- **Show Labels**: Toggle label display on/off
## Calculation Method
The indicator calculates volatility using the following method:
1. Calculate daily logarithmic returns
2. Compute standard deviation over the specified period
3. Annualize (multiply by √252)
4. Convert to percentage (×100)
## Usage
1. Add the indicator to your TradingView chart
2. Adjust parameters as needed
3. Monitor volatility lines for each cryptocurrency
4. Enable labels to see precise current volatility values
## Notes
- This indicator displays in a separate window, not as an overlay
- Volatility values are annualized
- Data for each currency pair is sourced from USD pairs
Ultimate Volatility RateUltimate Volatility Rate
This indicator measures the volatility of price movements.
Support and Resistance Identification:
High volatility periods indicate larger price movements, which can be useful in assessing the potential for support and resistance levels to be broken.
Stop Loss (SL) and Take Profit (TP) Calculations:
The average volatility can be used to calculate dynamic Stop Loss (SL) and Take Profit (TP) levels:
SL: Placing it at a certain volatility multiplier below/above the entry price.
TP: Setting it at a certain volatility multiplier below/above the entry price.
For example:
SL: Entry price +/- (UVR × 1.5)
TP: Entry price +/- (UVR × 2)
Market Condition Analysis:
When the indicator value is high, it suggests that the market is volatile (active).
When the value is low, it indicates the market is in consolidation (sideways movement).
This information helps traders decide whether to take trend-following or consolidation-based positions.
Trend Reversal Monitoring:
A sudden increase in volatility often signals the start of a strong trend.
Conversely, a decrease in volatility can signal the slowing down or end of a trend.
