Bar Color Long / Short Indicator With Advised SL Rev 1This is the Revised Version of Bar Color Long / Short Indicator With Advised SL with some extra features
Overview
This script is a trading indicator named "Bar Color Long / Short Indicator With Advised SL" designed for the TradingView platform. The indicator's primary purpose is to provide entry signals for long and short positions, based on various technical analysis methods. Additionally, the indicator suggests stop-loss levels for both long and short positions.
User Inputs
The indicator has several user inputs, such as:
Length
Smoothing
Multiplier
Show bar colors (ON/OFF)
When the bar colors are turned off, the alert signals for long and short positions will be displayed instead.
Custom Risk Calculation
The script calculates a custom risk level based on a modified version of the RSI (Relative Strength Index) formula. The custom risk level is divided into three categories: low, medium, and high.
Sentiment Score Calculation
The indicator calculates a sentiment score based on a combination of methods resembling EMA (Exponential Moving Average), MACD (Moving Average Convergence Divergence), and ROC (Rate of Change). The sentiment score is used to determine if the sentiment is positive or negative.
Bollinger Bands Percent and Combined Signal
The Bollinger Bands Percent is calculated, and the custom risk, sentiment score, and Bollinger Bands Percent are combined to generate a new signal. This signal is used in conjunction with EMA10 to determine the bar colors and provide entry signals.
Bar Colors
Based on the combined signal and EMA10, the script determines the bar colors as follows:
Orange: Positive sentiment
Blue: Negative sentiment
Gray: Neutral
Entry Signals and Alerts
When the bar colors are turned off, the indicator displays large green arrow signals for long (buy) positions and red arrow signals for short (sell) positions based on the sentiment and EMA10 conditions. The script also includes alert conditions for long and short signals, which can be used to set up notifications when these signals are triggered in the TradingView platform.
Advised Stop-Loss Levels
The indicator plots stop-loss lines for both long and short positions at the last candle, accompanied by labels showing the advised stop-loss levels in numeric values
Rev 1
added / changed :
SMA50 slope check
EMA20 higher or lower than EMA10
color ON/OFF changed
Signal once Buy and Sell
Üstel Hareketli Ortalama (EMA)
Shifted EMAsJa verschobene EMAS halt lol.
Oder wie ChatGPT sagen würde:
The "Shifted EMAs" indicator on TradingView is a customizable tool that displays three Exponential Moving Averages (EMAs) on the chart. Users can adjust the EMA lengths and apply vertical shifts to the EMAs, enabling flexible analysis of trends and potential support/resistance levels. Each EMA is represented with distinct colors for easy differentiation, providing traders with valuable insights into price movements and aiding in making well-informed trading decisions.
Custom EMAsNow the indicator includes 10 different types of EMAs, each with a changeable length and selectable type. You can use the input settings to adjust the type and length for each EMA. The plot shows all 10 EMAs on the chart.

Multiple Exponential Moving AveragesThe "Multiple Exponential Moving Averages" indicator is a custom technical analysis tool created for TradingView. It combines five different Exponential Moving Averages (EMAs) into a single indicator. Each EMA has a user-defined length, and they are plotted on the chart with different colors to differentiate them.
Exponential Moving Averages are commonly used in technical analysis to smooth out price data and identify trends. They give more weight to recent price data, making them more responsive to recent price changes than Simple Moving Averages (SMAs). By combining multiple EMAs with different lengths, TradingView users will no longer have to worry that they will run out of slots when wanting to add new indicators to their chart.

RSI-Volume Oscillator Quick Scalping By Akhilesh PatelTitle: RSI-Volume Oscillator Quick Scalping Indicator
Description:
The "RSI-Volume Oscillator Quick Scalping" is a powerful and versatile custom indicator designed for traders who engage in scalping strategies. This indicator combines the Relative Strength Index (RSI) with a Volume Oscillator to provide valuable insights into momentum and volume dynamics in the market. Traders can also select their preferred moving average types (SMA, EMA, or HMA) to further customize the indicator's behavior.
Key Features:
RSI and Volume Oscillator Fusion: The indicator blends the RSI and a custom Volume Oscillator to offer a comprehensive view of both price momentum and volume trends. This integration provides valuable signals for quick scalping opportunities.
Customizable Moving Averages: Traders can choose from three popular moving average types (SMA, EMA, or HMA) for further customization. This flexibility allows users to align the indicator with their preferred trading strategies.
Clear Visualization: The Combined RSI-Volume Oscillator is plotted as a solid blue line, while the three selected moving averages are represented by orange, purple, and green lines, respectively. The zero line, overbought, and oversold levels for RSI are also indicated for easy reference.
Quick Scalping Signals: The indicator helps traders spot potential buy and sell signals efficiently, making it ideal for quick scalping strategies in rapidly moving markets.
Usage Instructions:
Customize the indicator by selecting your preferred RSI length, Volume Oscillator length, and moving average type (SMA, EMA, or HMA).
Observe the Combined RSI-Volume Oscillator and moving averages for potential entry and exit points.
Look for crossovers between the Combined RSI-Volume Oscillator and the selected moving averages for buy and sell signals.
The overbought (70) and oversold (30) levels for RSI can be used to identify potential reversal points.
Important Note:
Test the indicator on historical data and demo accounts before using it in live trading to ensure it aligns with your trading strategy.
Understand that no indicator guarantees profits, and trading involves risk. Always use proper risk management and discipline when executing trades.
Overall, the "RSI-Volume Oscillator Quick Scalping" indicator is a valuable addition to any scalper's toolkit, providing comprehensive insights into momentum and volume dynamics to enhance trading decisions. Happy scalping!

Dee EMA 5.0
1. Indicator Features:
- The indicator can plot four different sets of EMA on a chart.
- The EMA values can be displayed on the chart with their respective names (e.g., ema9, ema20, etc.).
- The indicator allows customization of the EMA values.
2. Purpose of Dee_EMA 5.0:
- Dee_EMA 5.0 is a unique EMA indicator specially designed for traders to provide better insights and aid in trading decisions.
- The primary reason for building this indicator is to address the challenge of managing multiple time frames while using normal EMA tables.
- Traditional EMA tables might not show all EMA values across different time frames simultaneously, leading to time-consuming processes like shifting time frames and refreshing charts.
- Dee_EMA 5.0 solves this issue by displaying EMA values for different time frames in one table, allowing traders to make quick judgments without repeatedly changing time frames and refreshing charts.
3. Importance of Different Time Frame EMA Values:
- Different time frames EMA values are crucial in trading because they provide valuable insights into the market dynamics at various levels.
- When using shorter time frames (e.g., 1-minute), EMA values can help identify short-term trends, support, and resistance levels.
- On the other hand, using larger time frames (e.g., 5-minute or 15-minute) provides more data and increases the accuracy of EMA-based analysis, enabling traders to identify longer-term trends and potential price movements.
4. EMA Crossover Table:
- Traders often prefer a clutter-free chart without too many lines, but they still need access to EMA values for analysis.
- The EMA table and EMA crossover table serve this purpose by providing EMA values and EMA crossover information in a structured table format.
- With the EMA crossover table, traders can quickly check EMA values and crossovers across different time frames without having to switch time frames repeatedly, saving time and facilitating faster decision-making during trading.
In summary, Dee_EMA 5.0 is an EMA indicator designed to help traders efficiently analyze EMA values across different time frames, allowing for faster and more informed trading decisions. The EMA crossover table provides additional convenience by presenting EMA crossovers without cluttering the chart.

Moving Average Exponential Angle DetectionMoving Average exponential angle detection use to find the angle of moving average so we can take trade according to our strategy.
Hope you like this.
Thanks and Regards,
TradingTail

EMA Envelope - Signal with Stoploss and Takeprofit LevelsDescription:
This Pine Script indicator implements the EMA Envelope strategy, which utilizes Exponential Moving Averages (EMA) to create an envelope around the price chart. The strategy generates buy and sell signals based on the crossing of the price above and below the upper and lower EMA envelopes, respectively. It also incorporates additional features such as stop-loss and take-profit levels for risk management.
Indicator Settings:
EMA Length: Specifies the period for the short-term Exponential Moving Average.
Long Term EMA Length: Defines the period for the long-term Exponential Moving Average used for signal filtering.
Take Profit Ratio: Determines the ratio for calculating the take-profit levels based on the stop-loss.
Filter Signal on Long Term EMA: Enables or disables the filtering of buy/sell signals using the long-term EMA.
Show only recent signal: When enabled, shows only the most recent buy/sell signals.
Buy and Sell Signals:
The indicator generates buy signals when the price crosses above the upper EMA envelope and the previous low was below the upper EMA envelope. Additionally, you can choose to filter buy signals based on whether the closing price is above the long-term EMA.
Conversely, sell signals are generated when the price crosses below the lower EMA envelope, and the previous high was above the lower EMA envelope. Similar to buy signals, sell signals can also be filtered using the long-term EMA.
Note: Signal works well on Higher Timeframes like Daily/8hrs/4hrs/1hr.
Stop-Loss and Take-Profit Levels:
For buy signals, the stop-loss is set at the lower EMA level, while the take-profit level is calculated by adding a specified ratio of the difference between the low and the stop-loss level to the low price.
For sell signals, the stop-loss is set at the upper EMA level, and the take-profit level is calculated by subtracting a specified ratio of the difference between the stop-loss level and the high price from the high price.
Disclaimer:
This indicator is provided for educational and informational purposes only. Trading involves significant risk, and past performance does not guarantee future results. Users are solely responsible for their trading decisions and should conduct their own research and risk management. The author shall not be held liable for any losses or damages arising from the use of this indicator.
Note: Always test the indicator thoroughly on historical data and consider paper trading before applying it to live trading environments.

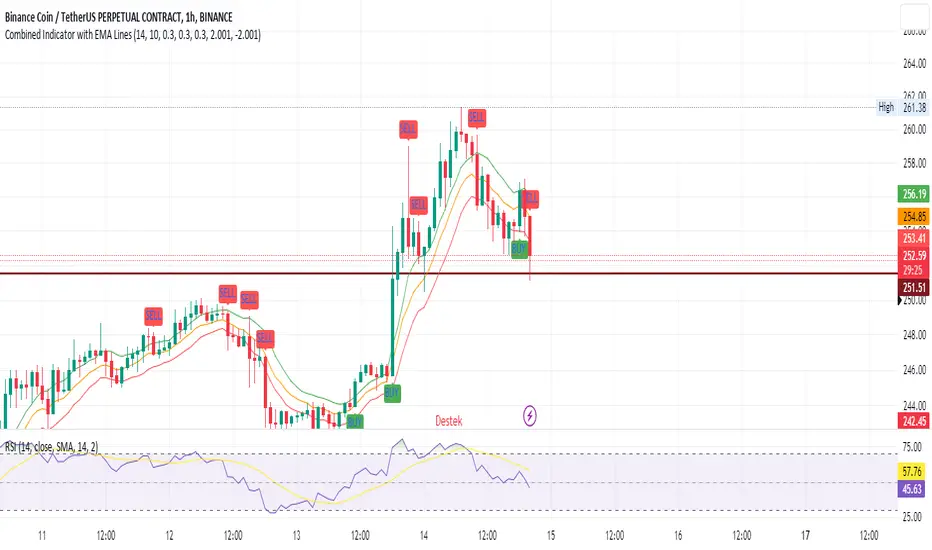
SEC-Combined Indicator with EMA LinesTitle: Combined Indicator with EMA Lines
Description:
The Combined Indicator with EMA Lines is a technical analysis tool that combines multiple indicators to provide insights into the market's strength and potential buying or selling opportunities. It incorporates the Relative Strength Index (RSI), Exponential Moving Average (EMA) lines, and the trend over the past three days to generate signals.
The indicator calculates a combined data value by assigning weights to the RSI, EMA, and past trend. The RSI measures the strength of price movements, while the EMA lines provide an indication of the average price over a specific period. The past trend considers the price behavior over the last three days. By combining these factors, the indicator offers a comprehensive view of market conditions.
Buy and sell signals are generated based on the change in the combined data. A buy signal occurs when there is an increase in the combined data above a specified threshold, indicating a potential buying opportunity. Conversely, a sell signal is triggered when there is a decrease in the combined data below a specified threshold, suggesting a potential selling opportunity.
The indicator also plots the EMA lines, which include the EMA High, EMA Average, and EMA Low. These lines provide additional visual cues about the price trend and potential support and resistance levels.
Traders can use the Combined Indicator with EMA Lines to identify potential entry and exit points in the market. It helps in capturing trends, evaluating price strength, and making informed trading decisions. The buy and sell signals, along with the EMA lines, aid in spotting potential reversals, confirming trends, and managing risk.
It's important to note that this indicator should be used in conjunction with other analysis techniques and risk management strategies. Traders should consider combining it with additional indicators, chart patterns, and fundamental analysis to enhance their trading decisions.
Remember to backtest and validate the indicator's performance using historical data before using it in real-time trading. Adjust the input parameters, such as RSI period, EMA period, and threshold values, to suit your trading style and market conditions.
Higher Fibonacci EMAOverall image:
If the closing price is higher than the three Fibonacci EMAs (uptrend):
Thanks to @ZenAndTheArtOfTrading and his indicator "Higher Timeframe EMA", URL =
This is a trend-discriminating indicator that uses 3 EMAs.
The Williams Alligator is the underlying philosophy, and we have applied it to capture the larger trend.
It is set up for the current time frame + 2 higher time frames.
One of the upper time legs has a daily EMA length of 13 Fibonacci numbers.
The top-level time leg has a weekly EMA with a length of 5 Fibonacci.
If the current closing price of the ticker leg is higher than these three EMAs, the bar color will be green. If it is lower, it will be red. If it is neither, it will be gray.
If the bar color is green, it suggests that the trend is upward. If it is red, you can consider entering short. If it is gray, it is best not to enter anything.

All in One EMA indicator with Average EMA Calculations The Indicator displays multiple exponential moving averages (EMAs) on the chart. The six available options will let you adjust and set ]exponential moving averages ( EMAS) as per your choice. Additionally I have added an Average ema which will calculate the average of all the emas that you have selected. This average ema works very strong and greatly to find potential zone of dynamic supports and resistance as well as to gauge the overall trend .. The average ema will also allow you to keep your chart clean and you wont have to add too many emas together.
The average of the selected EMAs are displayed as a single line. This helps identify trends and potential reversals in the market. i hope this indicator will help you with trading...
Plz use the chart BINANCE:LINKBTC as reference, for back testing and educational purposes only.
Thumbs up if you liked the script.
Happy trading..

Savitzky-Golay Filtered Chande Momentum OscillatorThe Savitzky-Golay Filtered Chande Momentum Oscillator (SGCMO) is a modified version of the Chande Momentum Oscillator that functions as a powerful analytical tool, capable of detecting trends and mean reversals. By applying a Savitzky-Golay filter to the price data, the oscillator provides enhanced visualization and smoother readings. (credit to © anieri for the Savitzky-Golay filter code: www.tradingview.com)
Chande Momentum Oscillator
The Chande Momentum Oscillator (CMO) is a technical indicator developed by Tushar Chande. It measures the momentum of an asset's price movement and provides insights into the overbought or oversold conditions of the market. The CMO calculates the difference between the sum of positive price changes and the sum of negative price changes over a specified period, and then normalizes it to a scale between -100 and +100. Traders and investors use the CMO to identify potential trend reversals, confirm the strength of a current trend, and generate buy or sell signals.
Smoothing
The Savitzky-Golay filter is a digital filter commonly employed for smoothing and noise reduction in time-series data. In the context of the SGCMO, the aim is to effectively smooth the CMO values, reducing the impact of short-term fluctuations and providing clearer insights into underlying trends. Additionally, an exponential moving average (EMA) filter is applied to further reduce noise and enhance trend visibility. This filtered CMO indicator may provide traders and investors with a clearer and more refined representation of momentum changes in the underlying asset, helping them make more informed trading decisions.
Application
The SGCMO serves as both a trend-following and mean-reversion tool. Traders can track the current trend using bullish white lines or bearish orange lines in trending markets. Alternatively, they can utilize green and red vertical lines, which indicate price retracement and help capture pullbacks and reversals. Green vertical lines appear when the trend reverses upwards in an oversold zone (-50 to -80), while red vertical lines indicate negative trend reversals in an overbought zone (50 to 80). Opening long positions when green and white lines appear, or short positions when red and orange lines are visible, can be considered. However, it is advisable to combine this indicator with other complementary technical analysis tools and incorporate it into a comprehensive trading strategy to maximize its effectiveness.

ALMA Smoothed Gaussian Moving AverageThis indicator is an altered version of the Gaussian Moving Average (GMA) (Credit to author: © LeafAlgo ). The GMA applies weights to the prices, giving more importance to the values closer to the current period and gradually diminishing the significance of older prices. The ALMA Smoothed Gaussian Moving Average (ASGMA) applies an ALMA smoothing to its price data to minimize lag and provide a more accurate representation of the underlying trend by dynamically adapting to changing market conditions. The Arnaud Legoux Moving Average (ALMA) is a specialized smoothing technique that adjusts the weights of the moving average based on market volatility. Its calculation uses Wavelet Transform techniques which enables this type of smoothing to capture both high-frequency and low-frequency components of a signal or data. The rationale for this mashup between ALMA and Gaussian filtering is to smooth the moving average line over the smoothed price data and produce stronger trend signals.
ASGMA serves as a trend-following indicator, identifying both bullish and bearish trends. It provides buy and sell signals indicated by "B" and "S" labels plotted alongside the price data. Additionally, the ASGMA's Exponential Moving Average (EMA) line alternates between green and red, indicating bullish and bearish momentum, respectively.
The ASGMA also incorporates two popular momentum indicators, the Relative Strength Index (RSI) and the Chande Momentum Oscillator (CMO). The inclusion of these indicators aims to enhance trend identification and reversal signals. For a strong buy signal, all three indicators (RSI, CMO, and ASGMA) must indicate bullish conditions, resulting in a vertical green line. Conversely, a vertical red line is plotted when all indicators indicate bearish conditions, representing a strong sell signal.
The ASGMA, with its unique combination of smoothing techniques and indicator amalgamation, provides traders and investors with powerful analytical tools. It can be applied in trend-following strategies using the regular buy and sell signals generated by labels and the EMA line. Alternatively, the vertical lines offer stronger buy and sell signals. These features aid in identifying potential entry and exit points, thereby enhancing trading decisions and market analysis. However, it is important to remember that the future performance of any trading strategy is fundamentally unknowable, and past results do not guarantee future performance.

Bank Nifty ScalpingThis indicator is designed for scalping purposes.
Users have the option to input the desired source and enable or disable the following indicators:
Multiple EMA (Exponential moving average)
Simultaneously displays multiple moving averages to quickly identify shifts in momentum and obtain confirmation from slower-moving averages.
By default, the EMA display settings are configured to show the 20-day EMA and the 200-day EMA. However, users have the flexibility to modify the display settings according to their preferences. This means that users can customize the indicator to show the EMA values of their choice, such as EMA 50 and EMA 100.
VWAP ( Volume weighted average price )
Default value is set to ‘hl2’
A bullish trend is indicated when the price is above the Volume Weighted Average Price (VWAP), while a bearish trend is indicated when the price is below the VWAP.
VWMA ( Volume weighted moving average )
In the VWMA (Volume Weighted Moving Average) indicator, a default value of 20 is used. If the price is higher than the VWMA, it typically indicates a bullish trend. Conversely, if the price is lower than the VWMA, it suggests a bearish trend. The VWMA takes into account both price and volume, providing a weighted average that can help identify shifts in market sentiment.
Multiple SuperTrends
Default value is 10 and 2 / 10 and 3
A bullish trend is identified when the price is above the SuperTrend indicator, whereas a bearish trend is observed when the price is below the SuperTrend indicator.
Camarilla Pivot Points (Level 3 and 4 only)
Levels 3 and 4 serve as crucial support and resistance levels, acting as the final line of defense against strong trends. These levels are expected to generate reversals, where price often changes direction.
CPR ( Central Pivot Points)
The Daily Central Pivot Point Indicator is a popular tool used in technical analysis. It calculates several levels based on the previous day's high, low, and closing prices.
Strong Volume
The user has the ability to set the average volume for Nifty and BankNifty indices to calculate strong volume.
Elder Impulse System
The Impulse System, developed by Alexander Elder and discussed in his book "New Trading for a Living," is a censorship trading system designed to determine whether a trade should be allowed or prohibited. Additionally, it can be used to identify when a trend is starting to weaken. The Impulse System relies on the following factors:
1. Slope of a Fast Exponential Moving Average (EMA): The fast EMA's slope reflects the price's inertia or momentum.
2. Slope of the Moving Average Convergence Divergence (MACD): The MACD's slope indicates the strength or power of the price movement.
Based on these factors, the Impulse System categorizes candles or price bars into three colors:
* Green Candle: When both the fast EMA and MACD are rising, indicating upward momentum.
* Red Candle: When both the fast EMA and MACD are declining, suggesting downward momentum.
* Blue Candle: In all other cases where the conditions for green or red candles are not met, representing a neutral or uncertain market condition.
By applying the Impulse System, traders can gain insights into the market trend, its strength, and potential shifts in momentum, helping them make informed trading decisions.
Happy Trading

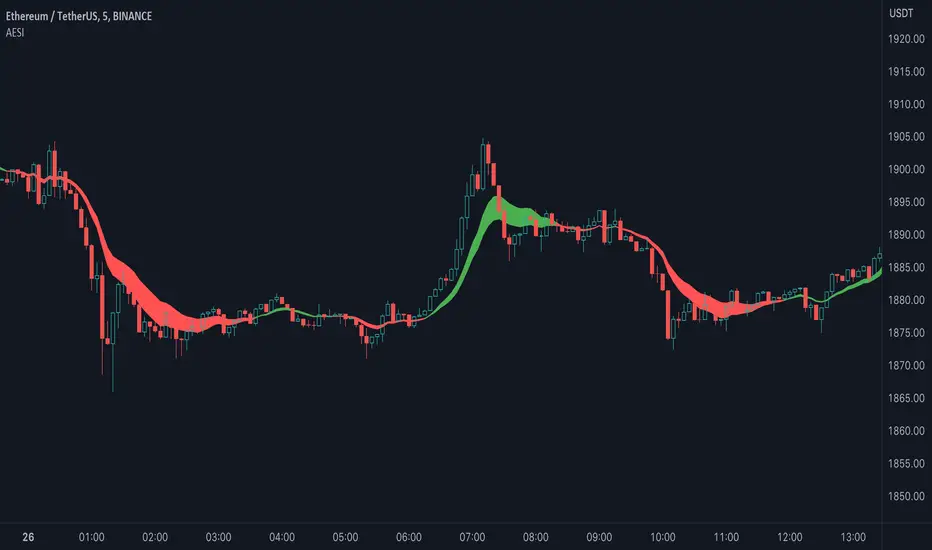
Advanced Exponential Smoothing Indicator (AESI) [AstrideUnicorn]The Advanced Exponential Smoothing Indicator (AESI) provides a smoothed representation of price data using the exponential smoothing technique. It helps traders identify the overall trend and potential reversal points in the market.
SETTINGS
Length: The number of periods used for the calculation of the exponential moving average (EMA). Higher values provide a smoother result but may lag behind price movements.
Alpha: The smoothing factor that determines the weight of the recent price data in the smoothing calculation. Higher values give more weight to recent data, resulting in a more responsive indicator.
Cloud Mode: Determines whether to display a cloud between the AESI line and the EMA line. When enabled, the cloud represents bullish (green) and bearish (red) market conditions.
HOW TO USE
The AESI indicator consists of a single line that represents the advanced exponential smoothing of the price data. It aims to provide a smoother version of the price series, reducing noise and revealing the underlying trend.
Bullish Condition: When the AESI line is above the EMA line, it indicates a bullish market condition. Traders may consider looking for buying opportunities or holding onto existing long positions.
Bearish Condition: When the AESI line is below the EMA line, it suggests a bearish market condition. Traders may consider looking for selling opportunities or holding onto existing short positions.
Optional Cloud Mode:
Enabling the cloud mode allows you to visualize bullish and bearish market conditions more clearly. The cloud appears between the AESI line and the EMA line, providing a visual representation of the prevailing market sentiment.
Bullish Cloud: When the AESI line is above the EMA line, the cloud is green, indicating a potential bullish market condition.
Bearish Cloud: When the AESI line is below the EMA line, the cloud is red, indicating a potential bearish market condition.
Note: The AESI indicator is most effective when used in conjunction with other technical analysis tools and indicators to confirm trading signals and make informed trading decisions.
Adjusting the Parameters:
You can adjust the Length and Alpha parameters to find the best ones for different timeframes and market conditions. Experimenting with different parameter values can help you find the optimal settings for your trading strategy.
It is recommended to backtest the AESI indicator on historical price data and evaluate its performance before using it in live trading. Remember that no indicator can guarantee profitable trades, and it is important to use risk management techniques and exercise caution when making trading decisions.
[FC] Multi EMA Cross Alerts Fltered with RSI and StochThis script prints Green Dots and Red Dots on candle close using Faster EMA ( 5 ) and Slower EMA (10 ) filtering with RSI (50)+ Stochastic %K ( 20 to 80 ) Smoothning(3).
The idea behind is to you use dots for scalping on smaller timeframe(5) ,(10) etc but you can modify all values to better fit your needs.
Explaination for Green Dots and Red Dots:
---> Green dot : 5 Ema crosses above 10 Ema ( i.e faster EMA crosses above slower EMA which signals price is trying to move up
RSI value > 50 (filtering for quick move)
stoch %k value between 20 and 80 ( filtering to know there is leg left in the move and all movement is already not done)
---> Red dot : 5 Ema crosses below 10 Ema ( i.e faster EMA crosses above slower EMA which signals price is trying to move down
RSI value < 50 (filtering for quick move)
stoch %k value between 20 and 80 ( filtering to know there is leg left in the move and all movement is already not done)

Banana RSIBanana RSI is not just ap-PEAL-ing to the eyes!
This simple little indicator provides a New Approach to determining Overbought and Oversold levels, as well as taking advantage of a non-typical smoothing method for this type of indicator.
Banana RSI uses a Cumulative High and Low Average to draw the upper, lower, and midline.
The High and Low Averages use the data only from above or below the Cumulative Average to calculate their respective line.
In simpler terms:
The High average is an average of every value ABOVE the full average.
The Low average is an average of every value BELOW the full average.
This creates an automated method to determine overbought and oversold territory based on the charts historical movement.
Since every chart can be different, these levels change with the chart.
Banana RSI also uses a linear regression smoothing method , by taking advantage of the built-in Least Squares Moving Average, we are able to view a better reacting/less-lagging moving average.
Included are 2 Length-Adjustable LSMA lines to use however needed.
Using the Regression Lines along with the High & Low Averages provides a new view on the classic RSI indicator.
Enjoy!
SmartVPSGTitle: Identifying Volume Spikes, Price Movements and Gap Ups: A TradingView Script
Introduction:
In the world of trading, identifying volume spikes and price movements can provide valuable insights into market trends and potential trading opportunities. In this article, we'll explore a TradingView script that helps traders visualize volume spikes, price up moves with volume spikes, and gap-up days on their charts.
Detecting Price Up Moves:
The script starts by calculating price up moves. It compares the current day's closing price with the previous day's closing price and checks if it has increased by 3% or more. This helps traders spot significant upward price movements.
Detecting Volume Spurts:
Next, the script focuses on detecting volume spikes, which are often associated with increased market activity and potential trading opportunities. It compares the current day's volume with the highest volume of the previous nine sessions. If the current volume exceeds all the volumes of the previous nine sessions, it is considered a volume spurt.
Example:
Let's consider a hypothetical scenario where we have the following volume data for a stock:
Day 1: 100,000
Day 2: 80,000
Day 3: 120,000
Day 4: 150,000
Day 5: 200,000
Day 6: 90,000
Day 7: 110,000
Day 8: 130,000
Day 9: 140,000
Day 10: 250,000 (current day)
To determine if there is a volume spurt on Day 10, the script compares the current day's volume (250,000) with the highest volume of the previous nine sessions. In this case, the highest volume among the previous nine sessions is 200,000 (on Day 5). Since the current day's volume (250,000) exceeds the highest volume of the previous nine sessions (200,000), it is considered a volume spurt.
Identifying Gap-Up Days:
Gap-up days occur when the market opens significantly higher than the previous day's close. To identify these days, the script compares the current day's low price with the previous day's high price. If the low price is greater than the previous day's high, it is marked as a gap-up day.
Visualizing the Findings:
To provide a clear visual representation of the identified patterns, the script uses different shapes and colors. First, it plots small red dots above the candles whenever a volume spurt is detected. These dots help traders quickly identify periods of increased volume activity.
For price up moves with volume spikes, the script utilizes blue triangular shapes below the candles. This allows traders to pinpoint instances where both price and volume are showing positive signs, indicating potential bullish movements.
Additionally, the script incorporates green candles to represent gap-up days. These candles help traders recognize days when the market opens with a significant upward gap, suggesting a potential shift in market sentiment.
Conclusion:
The TradingView script discussed in this article provides traders with a visual representation of volume spikes , price up moves with volume spikes , and gap-up days . By incorporating these visual cues into their analysis, traders can gain valuable insights into market trends and potential trading opportunities.
Remember, this script should be used for educational and informational purposes only and does not serve as financial advice or recommendations. Traders are encouraged to customize and modify the script according to their specific trading strategies and risk tolerance.
Share this script with other traders on TradingView to enhance their chart analysis and trading decisions.
PS: This TradingView script is designed to work specifically on the daily timeframe (daily candles). It calculates and identifies volume spurts based on the volume data of the daily timeframe. Since it is designed for the daily timeframe, it may not produce accurate results or work as intended on other timeframes.

Parabolic SAR + EMA 200 + MACD SignalsParabolic SAR + EMA 200 + MACD Signals Indicator, a powerful tool designed to help traders identify optimal entry points in the market.
This indicator combines three popular technical indicators: Parabolic SAR (Stop and Reverse), EMA200 (Exponential Moving Average 200) and MACD (Moving Average Convergence Divergence) - to provide clear and concise buy and sell signals based on market trends.
The MACD component of this indicator calculates the difference between two exponentially smoothed moving averages, providing insight into the trend strength of the market. The Parabolic SAR component helps identify potential price reversals, while the EMA200 acts as a key level of support and resistance, providing additional confirmation of the overall trend direction.
Whether you're a seasoned trader or just starting out, the MACD-Parabolic SAR-EMA200 Indicator is a must-have tool for anyone looking to improve their trading strategy and maximize profits in today's dynamic markets.
Buy conditions
The price should be above the EMA 200
Parabolic SAR should show an upward trend
MACD Delta should be positive
ُSell conditions
The price should be below the EMA 200
Parabolic SAR should show an downward trend
MACD Delta should be negative

Trend hunter strategy - buy & sellThe indicator combines multiple technical indicators and conditions to generate buy and sell signals.
Here's how the indicator works and how to use it:
Strategy Selection:
The indicator provides a dropdown menu to choose the type of strategy. The available options are "Pullback" and "Simple."
Supertrend Settings:
The Supertrend indicator is used to identify the trend direction.
The indicator takes two input parameters:
ATR Length: Specifies the length of the Average True Range (ATR) used in the Supertrend calculation. The default value is 10.
Factor: Specifies the factor used in the Supertrend calculation. The default value is 3.0.
EMA Settings:
The indicator also includes an Exponential Moving Average (EMA) condition.
You can enable or disable the EMA condition using the "Ema Condition On/Off" checkbox.
If enabled, the indicator calculates an EMA based on the close price.
You can specify the length of the EMA using the "Ema Length" input parameter. The default value is 200.
RSI Settings:
The Relative Strength Index (RSI) indicator is used to generate additional conditions.
You can enable or disable the RSI condition using the "Rsi Condition On/Off" checkbox.
If enabled, the indicator calculates the RSI based on the close price.
You can specify the length of the RSI using the "Rsi Length" input parameter. The default value is 14.
Additionally, you can set the overbought and oversold levels for the RSI using the "RSI BUY Level" and "RSI SELL Level" input parameters, respectively. The default value for both is 50.
Final Conditions:
The indicator combines the Supertrend, EMA, and RSI conditions to generate buy and sell signals.
The specific conditions depend on the chosen strategy:
For the "Simple" strategy, the buy condition is when the Supertrend is in an up trend, not in a previous long position, the RSI is above the overbought level, and the close price is above the EMA.
For the "Pullback" strategy, the buy condition is when there is a cross under of the previous low with the Supertrend, the Supertrend is in an up trend, the RSI is above the overbought level, and the close price is above the EMA.
The sell conditions are the opposite of the respective buy conditions.
Backtest Period:
You can specify the start and end dates for the backtesting using the "Start calculations from" and "End calculations" inputs, respectively. The default start date is "2005-01-01" and the default end date is "2045-03-01." (this is work in progress) Still working on the table part, it is a bit tricky.
Trade Direction:
You can choose the trade direction using the "Trade Direction" input parameter. The available options are "Long," "Short," and "Both."
Depending on the selected trade direction, the indicator will generate signals accordingly.
Visual Display:
The indicator plots the Supertrend line on the price chart.
Buy signals are shown as green labels below the price bars.
Sell signals are shown as red labels above the price bars.
Adjust the input parameters according to your preferences, and then apply the indicator to a chart to see the generated signals. Please note that this indicator should be used for educational purposes only and should be thoroughly tested before using it for real trading.

3 Fib EMAs To Scalp Them AllThe "3 Fib EMAs To Scalp Them All" was made in order to clear up when we should look for shorts, longs, or walk away. Also it can alert you when a trend starts, or when there is a possible reversal. I use it for scalping/day trading in 5m-1h timeframes.
1. EMAs: By default, the indicator uses Fibonacci numbers (21, 55, 233), but you can change them.
2. Color Changes: The color of the Micro EMA line changes depending on its relation to the Mid and Macro EMAs.
When Micro EMA < Mid < Macro EMA, it turns red, indicating a potential bearish trend - that's when you should look for shorts
When Micro EMA > Mid > Macro EMA, it turns green, indicating a potential bullish trend - that's when you should look for longs
A white Micro EMA is when you need to take some rest, enjoy your coffee, and avoid overtrading.
3. Signals: The indicator provides visual signals in the form of diamonds and crosses and corresponding alert signals.
A red diamond above the bar signals a potential beginning of a downtrend
A red cross above the bar signals the end of the downtrend and can be used as a signal for a possible reversal up/breakout.
A green diamond below the bar signals a potential beginning of a downtrend,
A green cross below the bar signals the end of the uptrend and can be used as a signal for a possible reversal down/breakout.
4. Alerts: For algo traders and people who prefer to stay away from the monitor... there are alerts for every signal.
Friendly note: Don't blindly follow the signals for your long and short entries. The signals only pop up when the EMA cross value gets a confirmation. A smart move would be to wait for a retracement to the EMA line and use momentum indicators like market cipher B to pinpoint those ideal entry points.

EMA with Buy/Sell Signals by lbkindCertainly! Here's a description of the code:
This Pine Script code is designed to plot Exponential Moving Averages (EMAs) on a chart and generate buy/sell signals based on specific conditions. The code includes a filter to reduce false signals by considering the trend of the EMA 200.
The key components of the code are as follows:
1. Input Variables: The code starts by defining input variables such as the periods for the EMAs (ema200Period, ema50Period, ema13Period), the Average True Range period (atrPeriod), and the chopiness threshold (chopinessThreshold).
2. Calculating EMAs: The EMAs (ema200, ema50, ema13) are calculated using the `ema()` function based on the closing price.
3. Average True Range (ATR): The ATR is calculated using the `atr()` function with the specified period (atrPeriod).
4. Normalized ATR: The normalized ATR is computed by dividing the ATR by the closing price and multiplying by 100. This allows for better comparison across different price levels.
5. EMA 200 Trend Direction: The code determines the trend direction of the EMA 200 by comparing the current value with the previous value. The variables `ema200TrendUp` and `ema200TrendDown` are assigned `true` or `false` values based on the trend direction.
6. Generate Buy/Sell Signals: The buySignal is generated when the following conditions are met:
- There is a crossover of the shorter EMAs (ema13, ema50).
- The EMA 200 is in an uptrend (`ema200TrendUp` is true).
- The current close is above the EMA 200.
- The normalized ATR is below the specified chopiness threshold.
The sellSignal is generated when the opposite conditions are met.
7. Plotting: The EMAs (ema200, ema50, ema13) are plotted on the chart using the `plot()` function. The buy and sell signals are plotted as labels using the `plotshape()` function. The buySignal is displayed below the candle (`location=location.belowbar`), and the sellSignal is displayed above the candle (`location=location.abovebar`).
By incorporating these features, the code provides a visual representation of the EMAs, along with buy and sell signals that consider the EMA 200 trend, crossover of shorter EMAs, and the normalized ATR condition. This helps in identifying potential entry and exit points in the market while attempting to reduce false signals.
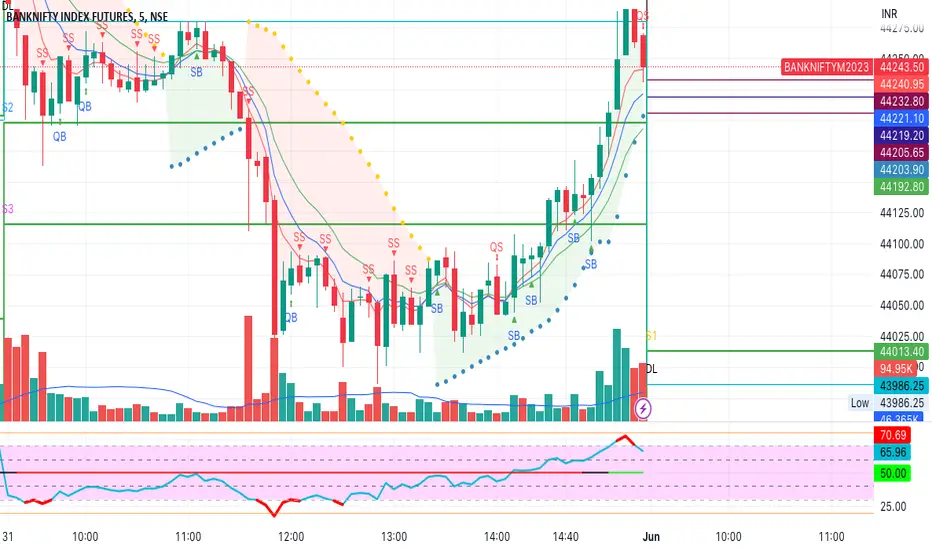
Buy Sell using 5-8-13 EMA, RSI, PSAR IndicatorThis indicator generates Scalping and Strong Buy/Sell Signals.
Quick Scalp signals are generated using 5 EMA and RSI.
Strong Buy/Sell Signals are generated using combination of 5-8-13 EMA and Parabolic SAR.
Signals generated:
QB: Quick Buy
QS: Quick Sell
SB: Strong Buy
SS: Strong Sell