EMA Crossover PredictionThis indicator predicts potential EMA crossovers by analyzing the rate of change between short and long EMAs. It calculates future EMA values based on current trends and displays predicted crossover points with their estimated timeframe and price level. The script uses customizable periods for both EMAs and forecast length, making it adaptable for different trading timeframes. Green labels indicate predicted bullish crossovers (short EMA crossing above long EMA), while red labels show bearish crossover predictions (short EMA crossing below long EMA).
Üstel Hareketli Ortalama (EMA)

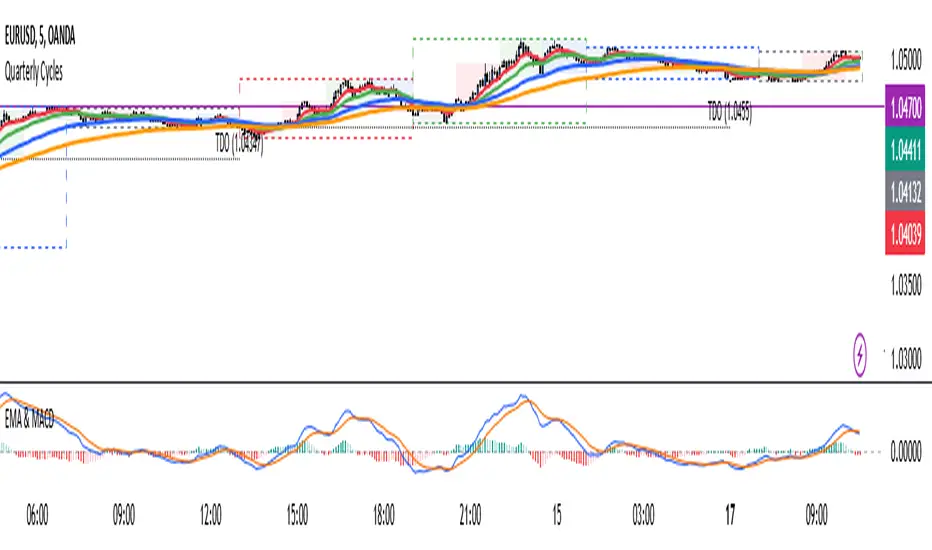
4 EMA & MACDThe indicator that combines Moving Average and MACD into one is very useful for providing a more complete picture of the market. Here's how it works:
Moving Average (MA): This is a trend indicator that smooths the price to show the dominant trend direction. MA helps traders determine whether the market is in an uptrend, downtrend, or sideways. For example, if the price is above the MA, it might indicate an uptrend, while if the price is below the MA, it might indicate a downtrend.
MACD (Moving Average Convergence Divergence): MACD measures market momentum and can provide entry and exit signals based on the difference between two moving averages (fast MA and slow MA). A buy signal occurs when the MACD crosses above the signal line, and a sell signal occurs when the MACD crosses below the signal line.
Combining both gives traders a more complete view:
MA provides an overview of the larger trend direction.
MACD helps identify moments when momentum supports a position for entering or exiting.
Common usage:
Entry: If the price is above the Moving Average (uptrend) and the MACD shows a buy signal (for example, MACD crossing above the signal line), it can be a signal to buy.
Exit: If the price starts moving below the MA and the MACD shows a sell signal, it can be a signal to sell or exit the position.
There is an indicator called MACD + Moving Average Cross, which combines both elements, providing stronger signals and making it easier to follow the market.
Multi-Timeframe Confluence IndicatorThe Multi-Timeframe Confluence Indicator strategically combines multiple timeframes with technical tools like EMA and RSI to provide robust, high-probability trading signals. This combination is grounded in the principles of technical analysis and market behavior, tailored for traders across all styles—whether intraday, swing, or positional.
1. The Power of Multi-Timeframe Confluence
Markets are influenced by participants operating on different time horizons:
• Intraday traders act on short-term price fluctuations.
• Swing traders focus on intermediate trends lasting days or weeks.
• Position traders aim to capture multi-month or long-term trends.
By aligning signals from a higher timeframe (macro trend) with a lower timeframe (micro trend), the indicator ensures that short-term entries are in harmony with the broader market direction. This multi-timeframe approach significantly reduces false signals caused by temporary market noise or counter-trend moves.
Example: A bullish trend on the daily chart (higher timeframe) combined with a bullish RSI and EMA alignment on the 15-minute chart (lower timeframe) provides a stronger confirmation than relying on the 15-minute chart alone.
2. Why EMA and RSI Are Essential
Each element of the indicator serves a unique role in ensuring accuracy and reliability:
• EMA (Exponential Moving Average):
• A dynamic trend filter that adjusts quickly to price changes.
• On the higher timeframe, it establishes the overall trend direction (e.g., bullish or bearish).
• On the lower timeframe, it identifies precise entry/exit zones within the trend.
• RSI (Relative Strength Index):
• Adds a momentum-based perspective, confirming whether a trend is backed by strong buying or selling pressure.
• Ensures that signals occur in areas of strength (RSI > 55 for bullish signals, RSI < 45 for bearish signals), filtering out weak or uncertain price movements.
By combining EMA (trend) and RSI (momentum), the indicator delivers confluence-based validation, where both trend and momentum align, making signals more reliable.
3. Cooldown Period for Signal Optimization
Trading in choppy or sideways markets often leads to overtrading and false signals. The cooldown period ensures that once a signal is generated, subsequent signals are suppressed for a defined number of bars. This prevents traders from entering low-probability trades during indecisive market phases, improving overall signal quality.
Example: After a bullish confluence signal, the cooldown period prevents a bearish signal from being triggered prematurely if the market enters a temporary retracement.
4. Use Cases Across Trading Styles
This indicator caters to various trading styles, each benefiting from the confluence of timeframes and technical elements:
• Intraday Trading:
• Use a 1-hour chart as the higher timeframe and a 5-minute chart as the lower timeframe.
• Benefit: Align intraday entries with the hourly trend for higher win rates.
• Swing Trading:
• Use a daily chart as the higher timeframe and a 1-hour chart as the lower timeframe.
• Benefit: Capture multi-day moves while avoiding counter-trend entries.
• Scalping:
• Use a 30-minute chart as the higher timeframe and a 1-minute chart as the lower timeframe.
• Benefit: Enhance scalping efficiency by ensuring short-term trades align with broader intraday trends.
• Position Trading:
• Use a weekly chart as the higher timeframe and a daily chart as the lower timeframe.
• Benefit: Time long-term entries more precisely, maximizing profit potential.
5. Robustness Through Customization
The indicator allows traders to customize:
• Timeframes for higher and lower analysis.
• EMA lengths for trend filtering.
• RSI settings for momentum confirmation.
• Cooldown periods to adapt to market volatility.
This flexibility ensures that the indicator can be tailored to suit individual trading preferences, market conditions, and asset classes, making it a comprehensive tool for any trading strategy.
Why This Mashup Stands Out
The Multi-Timeframe Confluence Indicator is more than a sum of its parts. It leverages:
• EMA’s ability to identify trends, combined with RSI’s insight into momentum, ensuring each signal is well-supported.
• A multi-timeframe perspective that incorporates both macro and micro trends, filtering out noise and improving reliability.
• A cooldown mechanism that prevents overtrading, a common pitfall for traders in volatile markets.
This integration results in a powerful, adaptable indicator that provides actionable, high-confidence signals, reducing uncertainty and enhancing trading performance across all styles.

Ultimate Total MA + ATRIndicator Description (English)
Name: Tendencias FX - Multi-Line with Customizable Offsets (1x..6x)
This script is a multi-purpose trend-following indicator that calculates a central Moving Average (Mid Line) plus a set of 6 different bands (1x to 6x) above and below that average. Each band is determined by a user-defined ATR length and multiplier. Key features include:
Independent MA Types
Choose different moving average methods for the Mid Line and for the ATR calculation.
Available types: SMA, EMA, WMA, RMA, HMA, and ALMA.
Separate Lengths
Configure the length of the Mid Line independently from the ATR length.
This allows fine-tuning of both the central average and the volatility measure.
6 Customizable Multipliers
Bands are calculated for 1x, 2x, 3x, 4x, 5x, and 6x multiples of the chosen ATR.
Each level has its own checkbox in the Inputs tab so you can show or hide them at will.
Color Dynamics
The Mid Line automatically changes color to green when its current value is higher than the previous bar’s value, and red otherwise.
All upper/lower bands are rendered in a neutral gray (#787b86) for easy distinction.
Time Shift (Offset)
An offset parameter allows shifting the entire indicator (Mid Line plus bands) forward (to the right) or backward (to the left) by a certain number of bars.
This can help evaluate leads/lags, or compare the past behavior of these lines against future price developments.
Check Boxes for Visibility
Checkboxes in the Inputs let you toggle 1x..6x band levels.
By default, 1x, 2x, and 3x are visible, while 4x, 5x, and 6x are off.
Overlay with Shared Price Scale
The script is set as overlay=true and uses scale=scale.right, so it draws directly on the main chart and shares the same price axis as your candles.
This indicator is ideal if you want:
A central MA for trend detection.
ATR-based volatility bands (up to 6 multipliers).
Full control over the type and length of both the Mid Line MA and the ATR.
An optional offset to shift the lines in time for backtesting or forward-projection.
Usage Tips
In the Inputs tab, customize:
Mid Line length and ATR length independently.
MA methods for both Mid Line and ATR (SMA, EMA, WMA, RMA, HMA, ALMA).
Band visibility via checkboxes for 1x..6x.
Offset for shifting lines in time.
In the Style tab, you can further customize colors, line widths, and visibility of each element (Mid line, ±1x..±6x).
Enjoy exploring different settings to best match your preferred trading style and timeframe!

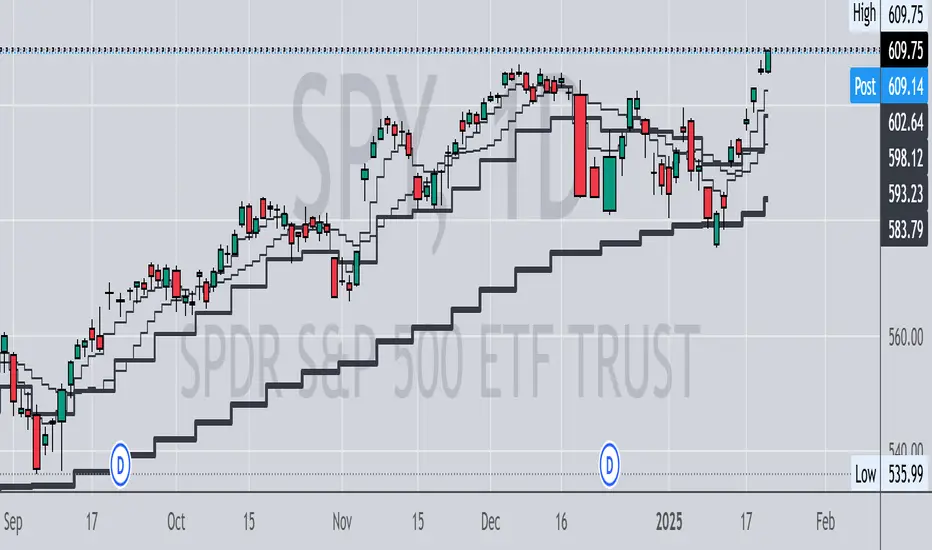
Multi Timeframe MAsThis Pine Script indicator, titled "Multi Timeframe MAs," allows you to plot Exponential Moving Averages (EMAs) or Simple Moving Averages (SMAs) from multiple timeframes on a single chart. This helps traders and analysts visualize and compare different moving averages across various timeframes without having to switch between charts.
Key Features:
Multiple Timeframes:
The script supports six different timeframes, ranging from minutes to weekly intervals.
Users can input their desired timeframes, including custom settings such as "60" (60 minutes), "D" (daily), and "W" (weekly).
Moving Average Types:
Users can choose between Exponential Moving Averages (EMA) and Simple Moving Averages (SMA) for each timeframe.
The script utilizes a ternary operator to determine whether to calculate an EMA or an SMA based on user input.
Customizable Periods:
Each moving average can have a different period, allowing for flexibility in analysis.
The default periods are set to commonly used values (e.g., 15, 20, 5, 12).
Visibility Controls:
Users can toggle the visibility of each moving average line, enabling or disabling them as needed.
This feature helps declutter the chart when specific moving averages are not required.
Black Stepped Lines:
All moving averages are plotted as black, stepped lines to provide a clear and consistent visual representation.
This makes it easy to distinguish these lines from other elements on the chart.
Example Use Cases:
Trend Analysis: Compare short-term and long-term trends by visualizing moving averages from different timeframes on a single chart.
Support and Resistance Levels: Identify key support and resistance levels across multiple timeframes.
Cross-Timeframe Strategy: Develop and test trading strategies that rely on the confluence of moving averages from different timeframes.
This script offers a powerful tool for traders and analysts who want to gain deeper insights into market movements by examining moving averages across multiple timeframes. With its customizable settings and user-friendly interface, it provides a versatile solution for a wide range of trading and analytical needs.
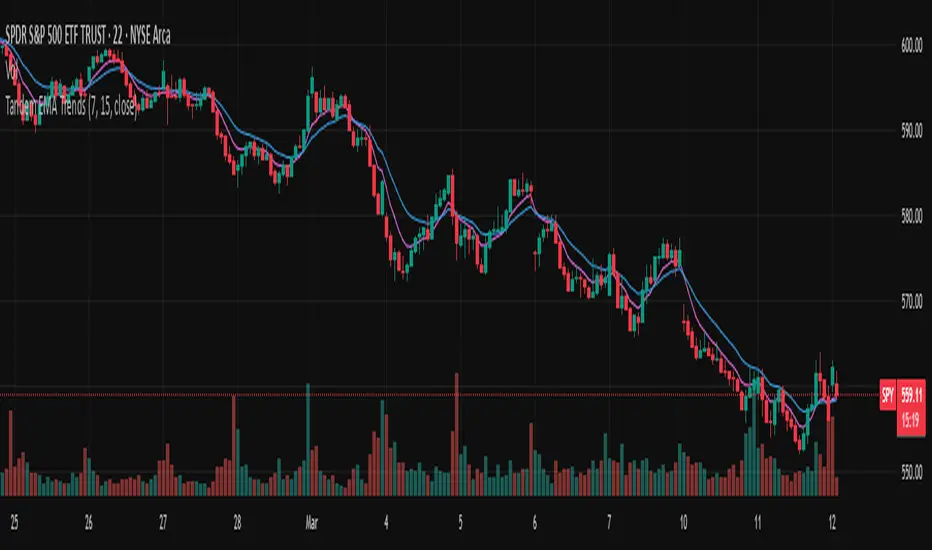
Tandem EMA TrendsThis indicator helps to identify trends using 2 (tandem) EMAs: a fast EMA and a slow EMA. Set the lengths of the EMAs in the inputs (fast EMA should be a smaller number than the slow EMA).
The trend is bullish if the current value of the fast EMA > current value of the slow EMA AND the current value of the fast EMA > the prior bar's value of the fast EMA.
The trend is bearish if the current value of the fast EMA < current value of the slow EMA AND the current value of the fast EMA < the prior bar's value of the fast EMA.
The fast EMA is countertrend to the slow EMA if either of the following 2 conditions exist:
The current value of the fast EMA > current value of the slow EMA AND the current value of the fast EMA < the prior bar's value of the fast EMA (bullish countertrend).
-OR-
The current value of the fast EMA < current value of the slow EMA AND the current value of the fast EMA > the prior bar's value of the fast EMA (bearish countertrend).
Use this script to set custom alerts based off of the current trend like sending webhooks when specific conditions exist.
Customize the colors of the plots.
Timeframe-Based Dynamic MA [odnac]
This code is a Timeframe-Based Dynamic MA indicator, written in Pine Script, that dynamically calculates and displays the Simple Moving Average (SMA), Exponential Moving Average (EMA), and Volume Weighted Moving Average (VWMA) based on a 24-hour period, according to the selected timeframe. It automatically adjusts the length of the moving averages for each timeframe, showing the appropriate value optimized for that specific timeframe.
Code Explanation:
Settings:
inputLength: A user input that allows setting the base time (24 hours by default). This value determines the reference for calculating the length of the moving averages according to the timeframe.
transp: A setting for the transparency of the moving average lines. It can accept values from 0 to 100 (0 is opaque, 100 is fully transparent).
Timeframe-Based Moving Average Calculation:
The length variable is dynamically calculated based on the current chart's timeframe.
For shorter timeframes like 1-minute, 2-minute, 3-minute, 5-minute, 10-minute, 15-minute, 30-minute, and 45-minute, the length is calculated by multiplying 60 / selected timeframe to obtain the moving average length based on a 24-hour period.
For longer timeframes like 1 hour, 4 hours, and 1 day, fixed values are used to set the moving average length.
Moving Average Calculation:
sma, ema, vwma: These are the Simple Moving Average, Exponential Moving Average, and Volume Weighted Moving Average calculated based on the length.
else_sma, else_ema, else_vwma: These represent the moving averages fetched from the 1-hour chart. For timeframes that are not calculated directly, the values are taken from the 1-hour chart.
Displaying the Moving Averages:
The moving averages are plotted according to the length calculated for the current timeframe.
If the length for the current timeframe is valid, the corresponding SMA, EMA, and VWMA values are displayed. Otherwise, the values fetched from the 1-hour chart are used.
The moving averages are displayed with the transparency (transp) value set by the user, controlling their opacity on the chart.
How to Use:
Base Time: The user sets a base time. For example, setting inputLength to 24 will calculate the moving average length based on a 24-hour period, which will be dynamically adjusted and displayed according to the selected timeframe.
Transparency Setting: The transparency of the moving average lines can be adjusted using the transp value.
Supported Timeframes:
For shorter timeframes (1-minute, 2-minute, 3-minute, 5-minute, 10-minute, 15-minute, 30-minute, 45-minute), the moving average lengths are dynamically calculated and displayed.
For longer timeframes (1 hour, 4 hours, 1 day), fixed length values are used.
This indicator allows you to dynamically calculate daily moving averages across different timeframes and visually check which moving average is the most appropriate for the selected timeframe.

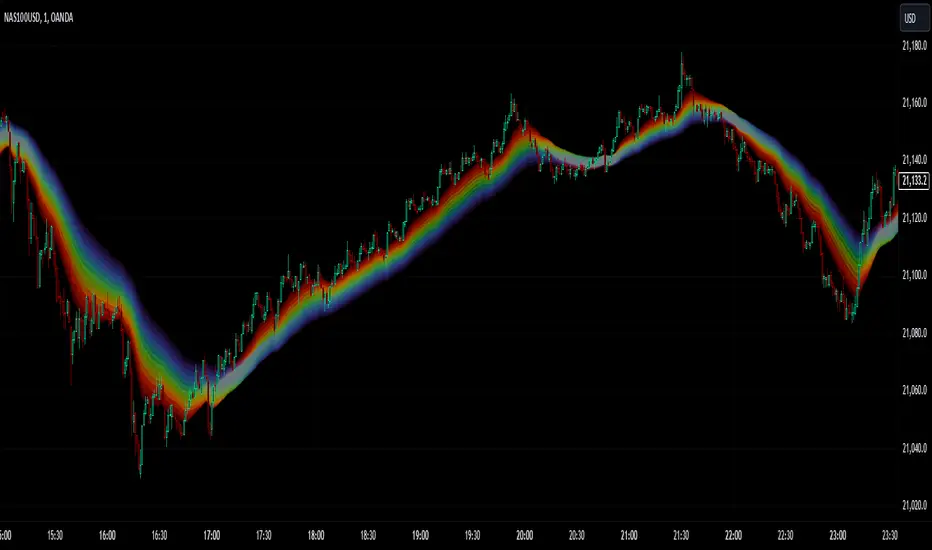
Emergent Rays - NovaTheMachineEmergent Rays
An emergent ray is a refracted ray of light that exits a medium or channel. Emergent rays can be created when light passes through a prism, glass slab, or mirror
This visual indicator has been designed to aid in developing psychological understanding of price action. Many traders often struggle with developing strategy that they can act on, repeatedly. The difference between gambling and trading successfully comes down to following a plan, that you have tested and determined to be profitable over the long term.
Some traders experience anxiety when trading trends, trying to time a reversal, or entering a trade based on emotions and are unsure where they should place a stop - if they bother to place one at all.
I developed this indicator to help traders practice responsible trading practices and develop discipline. When applied to a chart an array of light rays will be plotted, similarly to those that are emitted from light passing through a medium such as a prism. These rays are a series of EMAs high & low values, filled with an assigned color.
The indicator does not suggest an entry or exit, it allows for freedom of user interpretation, however - when in a trending market you may notice that the rays are tested multiple times when the market is trending in the same direction. When trading trends it makes sense to enter at the discounted value (pullbacks) and exit on extensions. There are two main reasons for this; first is manage risk, second is to profit from a successful trade.
To practice discipline and remove emotions from trading, one must be willing to accept the outcome of a trade - regardless of whether it was profitable or not, based on their strategy.
The visual gradient of the rays signifies the pullback to stoploss risk. As price expands it is clear to see that the distance from red to blue rays increases, which means entering a trade on a touch of the red ray requires a larger stoploss than entering a pullback to the green or blue rays. When price closes on the opposite side of a ray from where it was trending - we accept the trend may have ended and must wait for the next trend cycle. If the price action is range bound we will notice the rays melting together to create a grey ray that signifies this is not the best place to be trading any type of trend following strategy.
Using this indicator in an uptrend (price expansion upwards), we look to enter long positions of retests (pullbacks) into the rays - with a stoploss set below the lowest rays; as we do not believe the uptrend is over until the trend has been broken.
Using this indicator in a downtrend (price expansion downwards), we look to enter short positions of retests (pullbacks) into the rays - with a stoploss set below the lowest rays; as we do not believe the uptrend is over until the trend has been broken.
When price is range bound or consolidating, we do not enter trades; wait for clear trend to be established.
By practicing discipline, we are able to overcome the emotions involved with trading, remove hesitation, and trade our plans more confidently through appropriate risk management and radical acceptance.
Smart Moving AveragesSmart Moving Averages analyzes the dynamic interplay between price action and multiple moving averages to identify high-probability support and resistance zones.
The script's distinguishing features include:
Bounce detection that filters out noise by requiring specific penetration thresholds (0.1-1.5%), helping traders identify genuine support tests versus false signals
Real-time MA clustering analysis that reveals zones where multiple moving averages converge, indicating potentially stronger support/resistance levels
Statistical tracking of bounce success rates for each MA, allowing traders to identify which moving averages are most reliable for the current market conditions
Power bounce detection that combines EMA spread analysis with trend confirmation, highlighting especially strong bullish setups
Visual stack status system that instantly communicates market health through an intuitive color-coded display showing how many MAs are below price
The script helps traders make more informed decisions by quantifying the historical reliability of different moving averages while providing real-time analysis of MA interactions with price. This systematic approach moves beyond simple MA crossovers to identify higher probability trading opportunities.

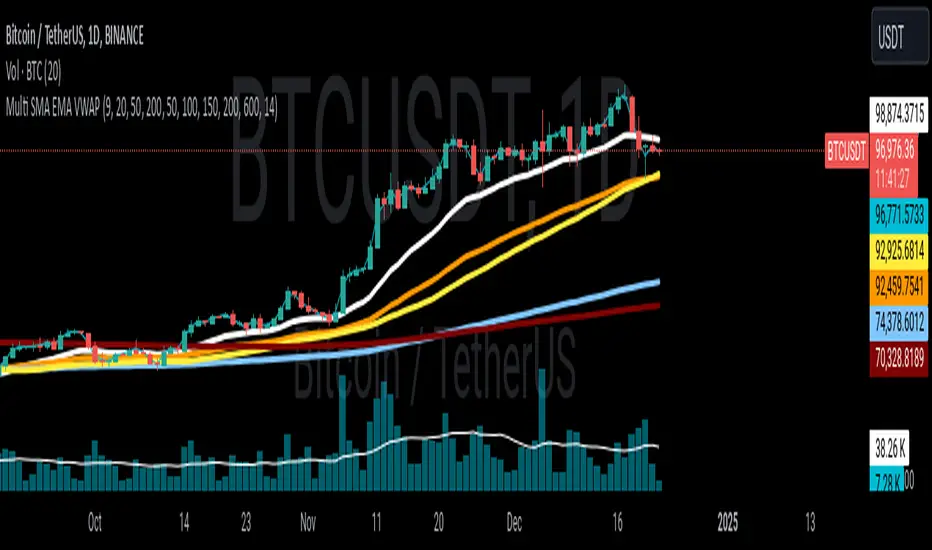
BTCUSDT Premium Prices and EMA360The Exponential Moving Average (EMA) is a widely used technical indicator in trading that helps analysts and traders identify price trends over a specified period. Unlike the Simple Moving Average (SMA), which treats all data points equally, the EMA gives more weight to recent prices, making it more sensitive to recent price movements. This characteristic allows the EMA to react quickly to changes in market conditions, providing timely insights into potential trends.
## **Key Features of EMA**
- **Weighting Mechanism**: The EMA uses a smoothing factor that emphasizes recent price data while still considering older observations. This leads to a more dynamic representation of price trends compared to the SMA .
- **Trend Identification**: The EMA is particularly effective for identifying the direction of a stock's price movement. A rising EMA indicates an uptrend, while a declining EMA suggests a downtrend. Traders often use multiple EMAs with different periods to spot crossovers, which can signal potential buy or sell opportunities .
- **Calculation**: To calculate the EMA, one typically starts with an initial Simple Moving Average (SMA) for the first period, then applies the following formula for subsequent periods:
$$
\text{EMA}_{\text{today}} = \left(\text{Price}_{\text{today}} \times \left(\frac{2}{N + 1}\right)\right) + \left(\text{EMA}_{\text{yesterday}} \times \left(1 - \frac{2}{N + 1}\right)\right)
$$
Where $$N$$ is the number of periods .
## **Applications in Trading**
Traders utilize the EMA in various strategies, including:
- **Crossover Strategies**: By monitoring two EMAs of different lengths (e.g., 50-day and 200-day), traders can identify bullish or bearish signals when one crosses above or below the other .
- **Combining Indicators**: The EMA can be combined with other indicators like the Relative Strength Index (RSI) or Moving Average Convergence Divergence (MACD) for enhanced decision-making .
In summary, the Exponential Moving Average is a crucial tool for traders seeking to navigate market trends effectively. Its ability to prioritize recent data makes it an essential component of many trading strategies, providing insights that can lead to informed investment decisions.
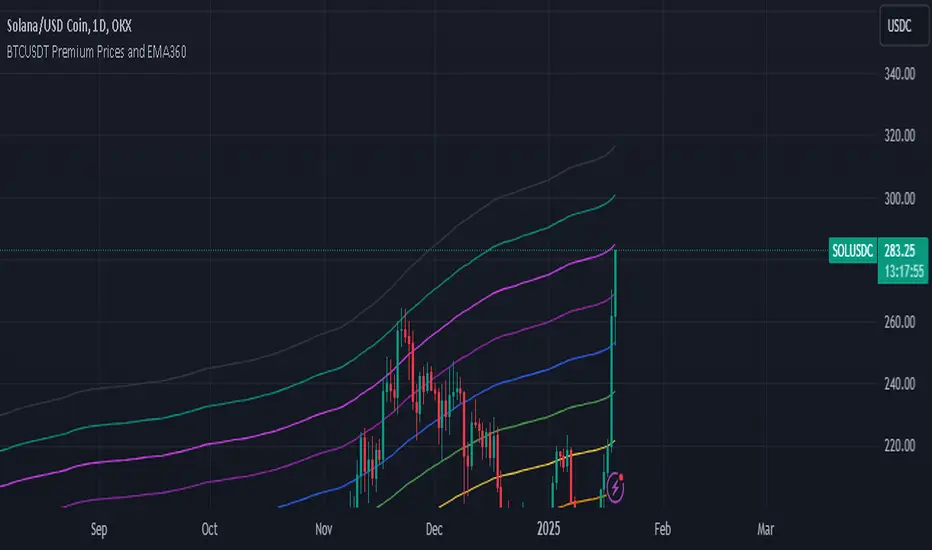
Dekkapok Premium Prices and EMA360Overview:
The EMA360 Premium Levels indicator is designed to help traders identify key price levels above the EMA360 (Exponential Moving Average) on a daily timeframe. These levels, referred to as "premium levels" are calculated as multiples of the EMA360 and can act as potential resistance or support zones for price action analysis.
Features:
EMA360 Calculation:
The script calculates the EMA360 using the daily timeframe (or any user-specified timeframe).
EMA360 is plotted as a bold blue line for clear visibility.
Premium Levels:
Multiple levels above the EMA360 are plotted as horizontal green lines.
These levels are calculated by multiplying the EMA360 value by user-defined multipliers (e.g., 1.2x, 1.3x, etc.).
Premium levels can help identify overbought or extended price zones relative to EMA360.
Customizable Inputs:
EMA Length: Default is set to 360, but users can adjust the EMA length as needed.
Timeframe: EMA360 is calculated using the daily timeframe by default, but any timeframe can be selected.
Multipliers: Traders can input their desired multipliers (e.g., 1.2, 1.3, 1.5) as a comma-separated list.
Clean Visualization:
EMA360 and premium levels are plotted directly on the price chart for intuitive analysis.
Premium level lines are semi-transparent green to minimize clutter while maintaining focus on critical levels.
Use Cases:
Trend Analysis: Use the EMA360 to identify the broader market trend. Prices above the EMA360 generally indicate an uptrend, while prices below may indicate a downtrend.
Overextension Zones: Premium levels help traders identify zones where the price may be overbought or overextended relative to EMA360.
Dynamic Support/Resistance: The premium levels can act as dynamic resistance zones during uptrends and support zones during pullbacks.
How to Use:
Apply the indicator to your chart in TradingView.
Observe the EMA360 line to understand the market trend.
Use the green premium level lines to identify potential resistance zones as the price moves above the EMA360.
Customization Options:
Adjust the EMA Length and Timeframe to match your trading style.
Modify the Premium Multipliers to suit your market analysis needs (e.g., add or reduce levels like 1.1x, 1.8x, etc.).
This indicator is especially useful for trend-following traders who want to leverage EMA-based levels for strategic decision-making.
- Dekkapok

Dekkapok Premium Prices and EMA360 [Clean Ver.]Overview:
The EMA360 Premium Levels indicator is designed to help traders identify key price levels above the EMA360 (Exponential Moving Average) on a daily timeframe. These levels, referred to as "premium levels" are calculated as multiples of the EMA360 and can act as potential resistance or support zones for price action analysis.
Features:
EMA360 Calculation:
The script calculates the EMA360 using the daily timeframe (or any user-specified timeframe).
EMA360 is plotted as a bold blue line for clear visibility.
Premium Levels:
Multiple levels above the EMA360 are plotted as horizontal green lines.
These levels are calculated by multiplying the EMA360 value by user-defined multipliers (e.g., 1.2x, 1.3x, etc.).
Premium levels can help identify overbought or extended price zones relative to EMA360.
Customizable Inputs:
EMA Length: Default is set to 360, but users can adjust the EMA length as needed.
Timeframe: EMA360 is calculated using the daily timeframe by default, but any timeframe can be selected.
Multipliers: Traders can input their desired multipliers (e.g., 1.2, 1.3, 1.5) as a comma-separated list.
Clean Visualization:
EMA360 and premium levels are plotted directly on the price chart for intuitive analysis.
Premium level lines are semi-transparent green to minimize clutter while maintaining focus on critical levels.
Use Cases:
Trend Analysis: Use the EMA360 to identify the broader market trend. Prices above the EMA360 generally indicate an uptrend, while prices below may indicate a downtrend.
Overextension Zones: Premium levels help traders identify zones where the price may be overbought or overextended relative to EMA360.
Dynamic Support/Resistance: The premium levels can act as dynamic resistance zones during uptrends and support zones during pullbacks.
How to Use:
Apply the indicator to your chart in TradingView.
Observe the EMA360 line to understand the market trend.
Use the green premium level lines to identify potential resistance zones as the price moves above the EMA360.
Customization Options:
Adjust the EMA Length and Timeframe to match your trading style.
Modify the Premium Multipliers to suit your market analysis needs (e.g., add or reduce levels like 1.1x, 1.8x, etc.).
This indicator is especially useful for trend-following traders who want to leverage EMA-based levels for strategic decision-making.
- Dekkapok

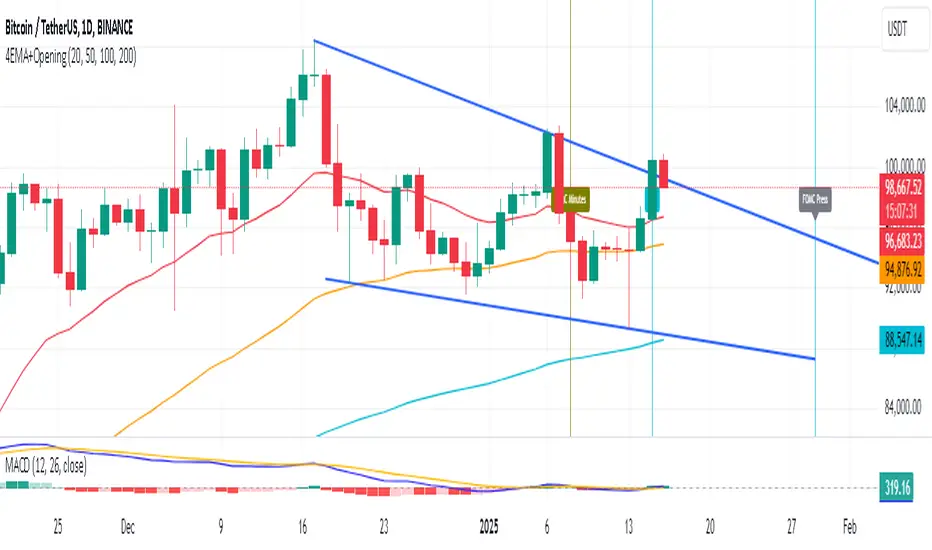
4EMAs+OpenHrs+FOMC+CPIThis script displays 4 custom EMAs of your choice based on the Pine script standard ema function.
Additionally the following events are shown
1. Opening hours for New York Stock exchange
2. Opening Time for London Stock exchange
3. US CPI Release Dates
4. FOMC press conference dates
5. FOMC meeting minutes release dates
I have currently added FOMC and CPI Dates for 2025 but will keep updating in January of every year (at least as long as I stay in the game :D)
BS | Buy&Sell Signals With EMAKey Features:
EMA Intersections: Generates clear buy and sell signals based on predefined EMA crossings.
5 EMA Lines: Visualize market trends with five distinct EMA lines plotted on the chart.
Support and Resistance Levels: Easily identify crucial support and resistance levels with our integrated marker.
Comprehensive Indicator Panel: At the bottom of the chart, track Stochastic, RSI, Supertrend, and SMA across multiple timeframes (1m, 5m, 15m, 1H, 4H, Daily, Weekly).
Fully Customizable: Almost every indicator within the tool is adjustable to suit your preferences and trading style.
Alarm Feature: Set up alarms to stay informed of important market movements.
Unlock the full potential of your trading strategy with BS | Buy&Sell Signals With EMA. Customize, analyze, and trade with confidence.
created by @bahadirsezer

Trading TimesThis script is based on the 9 and 20 EMA Strategy and combines Fibonacci Levels for added confluence.
When the price retests after breaking the EMAs, we take the trade in the same direction. That is on breakup, we take a long and on a breakdown we take a short.
VWAP can be enabled from settings for more data. institutions use it to average out their trades for both buy and sell orders.

HKM - Renko Emulator with EMA TrendThis is a Renko based Emulator to plot on any chart type which prints the box as printed on a Renko charts and is a Non-Repaint version. You can use either Traditional or ATR Method on current chart Timeframe. Option to plot an EMA Line is provided with Trend indication.

GocchiMulti-Indicator: RSI & Moving Averages
This versatile TradingView indicator combines two essential tools for technical analysis—Relative Strength Index (RSI) and Moving Averages (MAs)—into one comprehensive solution. It is designed for traders seeking flexibility, customization, and efficiency in their charting experience.
Features:
Relative Strength Index (RSI):
Customizable RSI length.
Adjustable overbought and oversold levels.
Selectable source input (e.g., close, open, high, low).
Visual levels for overbought and oversold zones, aiding in quick trend and momentum identification.
Three Moving Averages:
Three independently customizable moving averages.
Options for Simple Moving Average (SMA) or Exponential Moving Average (EMA) for each line.
Adjustable lengths for short-, medium-, and long-term trend tracking.
Visual Enhancements:
Clear, color-coded plots for RSI and each moving average.
Overbought and oversold zones are highlighted with horizontal dotted lines.
Alerts:
Get notified when RSI crosses above the overbought level or below the oversold level.
Alerts help traders stay on top of potential market reversals or breakout opportunities.
Use Cases:
RSI Analysis: Spot overbought or oversold conditions to identify potential reversals.
Trend Following: Use moving averages to confirm trends or identify crossovers for potential entry and exit points.
Custom Strategies: Tailor the settings to fit specific trading styles, such as scalping, swing trading, or long-term investing.
This all-in-one indicator streamlines your analysis by reducing the need for multiple overlays, making your charts cleaner and more actionable. Whether you're a novice or an experienced trader, this tool provides the flexibility and insights you need to succeed in any market condition.

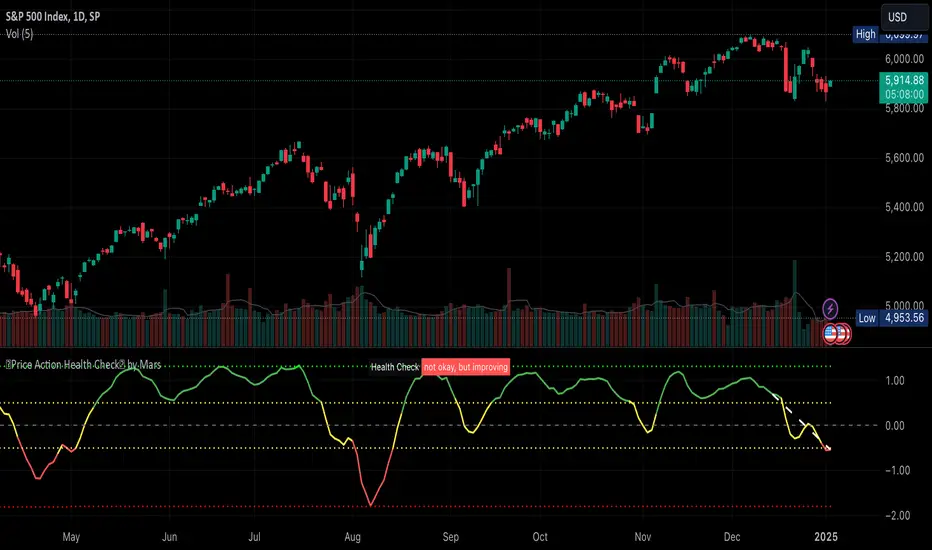
Price Action Health CheckThis is a price action indicator that measures market health by comparing EMAs, adapting automatically to different timeframes (Weekly/Daily more reliable) and providing context-aware health status.
Key features:
Automatically adjusts EMA periods based on timeframe
Measures price action health through EMA separation and historical context
Provides visual health status with clear improvement/deterioration signals
Projects a 13-period trend line for directional context
Trading applications:
Identify shifts in market health before major trend changes
Validate trend strength by comparing current readings to historical averages
Time entries/exits based on health status transitions
Filter trades using timeframe-specific health readings
I like to use it to keep SPX in check before deciding the market is going down.
Note: For optimal analysis, use primarily on Weekly and Daily timeframes where price action patterns are more significant.
UM VIX status table and Roll Yield with EMA
Description :
This oscillator indicator gives you a quick snapshot of VIX, VIX futures prices, and the related VIX roll yield at a glance. When the roll yield is greater than 0, The front-month VX1 future contract is less than the next-month VX2 contract. This is called Contango and is typical for the majority of the time. If the roll yield falls below zero. This is considered backwardation where the front-month VX1 contract is higher than the value of the next-month VX2 contract. Contango is most common. When Backwardation occurs, there is usually high volatility present.
Features :
The red and green fill indicate the current roll yield with the gray line being zero.
An Exponential moving average is overlaid on the roll yield. It is red when trending down and green when trending up. If you right-click the indicator, you can set alerts for roll yield EMA color transitions green to red or red to green.
Suggested uses:
The author suggests a one hour chart using the 55 period EMA with a 60 minute setting in the indicator. This gives you a visual idea of whether the roll yield is rising or falling. The roll yield will often change directions at market turning points. For example if the roll yield EMA changes from red to green, this indicates a rising roll yield and volatility is subsiding. This could be considered bullish. If the roll yield begins falling, this indicates volatility is rising. This may be negative for stocks and indexes.
I look for short volatility positions (SVIX) when the roll yield is rising. I look for long volatility positions (VXX, UVXY, UVIX) when the roll yield begins falling. The indicator can be added to any chart. I suggest using the VX1, SPY, VIX, or other major stock index.
Set the time frame to your trading style. The default is 60 minutes. Note, the timeframe of the indicator does NOT utilize the current chart timeframe, it must be set to the desired timeframe. I manually input text on the chart indicator for understanding periods of Long and Short Volatility.
Settings and Defaults
The EMA is set to 55 by default and the table location is set to the lower right. The default time frame is 60 minutes. These features are all user configurable.
Other considerations
Sometimes the Tradingview data when a VX contract expires and another contract begins, may not transition cleanly and appear as a break on the chart. Tradingview is working on this as stated from my last request. This VX contract from one expiring contract to the next can be fixed on the price chart manually: ( Chart settings, Symbol, check the "Adjust for contract changes" box)
Observations
Pull up a one-hour chart of VX1 or SPY. Add this indicator. roll it back in time to see how the market and volatility reacts when the EMA changes from red to green and green to red. Adjust the EMA to your trading style and time frame. Use this for added confirmation of your long and short volatility trades with the Volatility ETFs SVIX, SVXY, VXX, UVXY, UVIX. or use it for long/short indexes such as SPY.

Bitcoin Reversal PredictorOverview
This indicator displays two lines that, when they cross, signal a potential reversal in Bitcoin's price trend. Historically, the high or low of a bull market cycle often occurs near the moment these lines intersect. The lines consist of an Exponential Moving Average (EMA) and a logarithmic regression line fitted to all of Bitcoin's historical data.
Inspiration
The inspiration for this indicator came from the PI Cycle Top indicator, which has accurately predicted past bull market peaks. However, I believe the PI Cycle Top indicator may not be as effective in the future. In that indicator, two lines cross to mark the top, but the extent of the cross has been diminishing over time. This was especially noticeable in the 2021 cycle, where the lines barely crossed. Because of this, I created a new indicator that I think will continue to provide reliable reversal signals in the future.
How It Works
The logarithmic regression line is fitted to the Bitcoin (BTCUSD) chart using two key factors: the 'a' factor (slope) and the 'b' factor (intercept). This results in a steadily decreasing line. The EMA oscillates above and below this regression line. Each time the two lines cross, a vertical colored bar appears, indicating that Bitcoin's price momentum is likely to reverse.
Use Cases
- Price Bottoming:
Bitcoin often bottoms out when the EMA crosses below the logarithmic regression line.
- Price Topping:
In contrast, Bitcoin often peaks when the EMA crosses above the logarithmic regression line.
- Profitable Strategy:
Trading at the crossovers of these lines can be a profitable strategy, as these moments often signal significant price reversals.

Golden & Death Cross with Re-Activation [By Oberlunar]🎄 Merry Christmas to All Traders! 🎄
Let me introduce you to a practical and customizable classic tool: the Golden & Death Cross with Re-Activation. This script is designed to help you navigate the markets with precision and adaptability.
Why Is This Script Important?
1. Customizable Moving Averages
You can choose from SMA, EMA, WMA, HMA, or RMA for both moving averages. This flexibility allows you to tailor the strategy to fit different markets and trading styles.
2. Smart Signal Handling
The script generates Golden Cross (LONG) and Death Cross (SHORT) signals while deactivating them automatically when the moving averages start to converge, avoiding unnecessary noise.
3. Reactivation Based on Distance Threshold
With the treshold parameter, signals are reactivated only when the moving averages move apart sufficiently, ensuring that the signals remain meaningful and not just random market noise.
What Are These Moving Averages?
SMA (Simple Moving Average),
EMA (Exponential Moving Average),
WMA (Weighted Moving Average),
HMA (Hull Moving Average),
RMA (Relative Moving Average)
Community Input
We invite you to test this script on various markets (forex, stocks, crypto) and share your insights:
Which moving average combination works best for EUR/USD?
How about BTC/USD?
Does the treshold make a noticeable difference?
Let us know in the comments!
Example Settings
MA 1 Type: HMA, Length: 21
MA 2 Type: HMA, Length: 200
Reactivation Threshold: 0.5
Experiment with it, and let us know your findings.
Wishing you a calm holiday season and a profitable new year ahead! 🎁
🎄 Merry Christmas and Happy Trading! 🎄

RSI+EMA+MZONES with DivergencesFeatures:
1. RSI Calculation:
Uses user-defined periods to calculate the RSI and visualize momentum shifts.
Plots key RSI zones, including upper (overbought), lower (oversold), and middle levels.
2. EMA of RSI:
Includes an Exponential Moving Average (EMA) of the RSI for trend smoothing and confirmation.
3. Bullish and Bearish Divergences:
Detects Regular divergences (labeled as “Bull” and “Bear”) for classic signals.
Identifies Hidden divergences (labeled as “H Bull” and “H Bear”) for potential trend continuation opportunities.
4. Customizable Labels:
Displays divergence labels directly on the chart.
Labels can be toggled on or off for better chart visibility.
5. Alerts:
Predefined alerts for both regular and hidden divergences to notify users in real time.
6. Fully Customizable:
Adjust RSI period, lookback settings, divergence ranges, and visibility preferences.
Colors and styles are easily configurable to match your trading style.
How to Use:
RSI Zones: Use RSI and its zones to identify overbought/oversold conditions.
EMA: Look for crossovers or confluence with divergences for confirmation.
Divergences: Monitor for “Bull,” “Bear,” “H Bull,” or “H Bear” labels to spot key reversal or continuation signals.
Alerts: Set alerts to be notified of divergence opportunities without constant chart monitoring.

Multi SMA EMA VWAP1. Moving Average Crossover
This is one of the most common strategies with moving averages, and it involves observing crossovers between EMAs and SMAs to determine buy or sell signals.
Buy signal: When a faster EMA (like a short-term EMA) crosses above a slower SMA, it can indicate a potential upward movement.
Sell signal: When a faster EMA crosses below a slower SMA, it can indicate a potential downward movement.
With 4 EMAs and 5 SMAs, you can set up crossovers between different combinations, such as:
EMA(9) crosses above SMA(50) → buy.
EMA(9) crosses below SMA(50) → sell.
2. Divergence Confirmation Between EMAs and SMAs
Divergence between the EMAs and SMAs can offer additional confirmation. If the EMAs are pointing in one direction and the SMAs are still in the opposite direction, it is a sign that the movement could be stronger and continue in the same direction.
Positive divergence: If the EMAs are making new highs while the SMAs are still below, it could be a sign that the market is in a strong trend.
Negative divergence: If the EMAs are making new lows and the SMAs are still above, you might consider that the market is in a downtrend or correction.
3. Using EMAs as Dynamic Support and Resistance
EMAs can act as dynamic support and resistance in strong trends. If the price approaches a faster EMA from above and doesn’t break it, it could be a good entry point for a long position (buy). If the price approaches a slower EMA from below and doesn't break it, it could be a good point to sell (short).
Buy: If the price is above all EMAs and approaches the fastest EMA (e.g., EMA(9)), it could be a good buy point if the price bounces upward.
Sell: If the price is below all EMAs and approaches the fastest EMA, it could be a good sell point if the price bounces downward.
4. Combining SMAs and EMAs to Filter Signals
SMAs can serve as a trend filter to avoid trading in sideways markets. For example:
Bullish trend condition: If the longer-term SMAs (such as SMA(100) or SMA(200)) are below the price, and the shorter EMAs are aligned upward, you can look for buy signals.
Bearish trend condition: If the longer-term SMAs are above the price and the shorter EMAs are aligned downward, you can look for sell signals.
5. Consolidation Zone Between EMAs and SMAs
When the price moves between EMAs and SMAs without a clear trend (consolidation zone), you can expect a breakout. In this case, you can use the EMAs and SMAs to identify the direction of the breakout:
If the price is in a narrow range between the EMAs and SMAs and then breaks above the fastest EMA, it’s a sign that an upward trend may begin.
If the price breaks below the fastest EMA, it could indicate a potential downward trend.
6. "Golden Cross" and "Death Cross" Strategy
These are classic strategies based on crossovers between moving averages of different periods.
Golden Cross: Occurs when a faster EMA (e.g., EMA(50)) crosses above a slower SMA (e.g., SMA(200)), which suggests a potential bullish trend.
Death Cross: Occurs when a faster EMA crosses below a slower SMA, which suggests a potential bearish trend.
Additional Recommendations:
Combining with other indicators: You can combine EMA and SMA signals with other indicators like the RSI (Relative Strength Index) or MACD (Moving Average Convergence/Divergence) for confirmation and to avoid false signals.
Risk management: Always use stop-loss and take-profit orders to protect your capital. Moving averages are trend-following indicators but don’t guarantee that the price will move in the same direction.
Timeframe analysis: It’s recommended to use different timeframes to confirm the trend (e.g., use EMAs on hourly charts along with SMAs on daily charts).
VWAP
1. VWAP + EMAs for Trend Confirmation
VWAP can act as a trend filter, confirming the direction provided by the EMAs.
Buy Signal: If the price is above the VWAP and the EMAs are aligned in an uptrend (e.g., short-term EMAs are above longer-term EMAs), this indicates that the trend is bullish and you can look for buy opportunities.
Sell Signal: If the price is below the VWAP and the EMAs are aligned in a downtrend (e.g., short-term EMAs are below longer-term EMAs), this suggests a bearish trend and you can look for sell opportunities.
In this case, VWAP is used to confirm the overall trend. For example:
Bullish: Price above VWAP, EMAs aligned to the upside (e.g., EMA(9) > EMA(50) > EMA(200)), buy.
Bearish: Price below VWAP, EMAs aligned to the downside (e.g., EMA(9) < EMA(50) < EMA(200)), sell.
2. VWAP as Dynamic Support and Resistance
VWAP can act as a dynamic support or resistance level during the day. Combining this with EMAs and SMAs helps you refine your entry and exit points.
Support: If the price is above VWAP and starts pulling back to VWAP, it could act as support. If the price bounces off the VWAP and aligns with bullish EMAs (e.g., EMA(9) crossing above EMA(50)), you can consider entering a buy position.
Resistance: If the price is below VWAP and approaches VWAP from below, it can act as resistance. If the price fails to break through VWAP and aligns with bearish EMAs (e.g., EMA(9) crossing below EMA(50)), it could be a good signal for a sell.