Momentum-Reversal System Signals Pro
Momentum-Reversal System Signals Pro
Overview
A sophisticated signaling system designed to identify high-probability trend-following entries after a price pullback. This indicator is optimized for index futures like the S&P 500 (ES/SPX) on a 5-minute timeframe .
It performs best during periods of established trends and lower volatility. To aid in this, the indicator includes a customizable "No-Trade Zone" highlighter, which is pre-set to the often volatile 8:30 AM - 11:30 AM EST market open. While the default settings are robust and effective in most conditions, the indicator is fully customizable to suit your specific trading style.
How It Works
The core logic is based on a three-step process to filter for high-quality setups:
Trend Confirmation: The script first establishes the overall market direction using an EMA on a higher timeframe (15-minute by default). This ensures you are only looking for trades that align with the dominant trend.
Pullback Detection: Once the trend is confirmed, the script waits for the price to pull back to a dynamic area of value on the main chart (5-minute by default). This "pullback zone" is defined by the 5m EMA and an ATR-based channel around it, which adapts to current market volatility.
Momentum Entry: After a valid pullback occurs, the script waits for a clear sign that momentum is returning in the direction of the primary trend. This is confirmed by a combination of a MACD crossover and a strong RSI reading, signaling that the pullback has likely ended and the trend is ready to resume.
Advanced Quality Filters
What makes this indicator powerful is its multi-layered filtering system designed to weed out low-probability signals and avoid choppy market conditions.
Trend Strength: It doesn't just check the trend direction; it measures the slope of the 15m EMA to ensure the trend has sufficient strength. This is a key filter for avoiding flat, sideways markets.
Momentum Confirmation: An RSI "Dead Zone" around the 50-level ensures that the RSI shows decisive momentum before a signal is generated.
Signal Cooldown: A built-in timer ( Min Bars Between Signals ) prevents the same signal from firing repeatedly in a short period, reducing noise and over-trading.
RSI Volatility: The script checks that the RSI itself is not flat, which is often a sign of market indecision and a precursor to chop.
Pullback Quality: An optional filter ensures that by the time the signal fires, the price has already moved back to the "correct" side of the 5m EMA, confirming the reversal's strength.
Volatility Filter: A crucial risk management filter that blocks signals on abnormally large, high-risk "gasoline" bars that could lead to immediate stops.
How To Use
For Long Signals (Green 'Long' Tag):
Look for the 15m EMA to be green and trending upwards.
Wait for price to pull back towards the orange 5m EMA.
A "Long" signal appears when momentum indicators confirm a reversal back in the direction of the trend.
For Short Signals (Red 'Short' Tag):
Look for the 15m EMA to be red and trending downwards.
Wait for price to pull back towards the orange 5m EMA.
A "Short" signal appears when momentum indicators confirm a reversal back in the direction of the trend.
This tool provides high-probability signals, not guarantees. It is designed to be a core component of a complete trading plan. Always use proper risk management and confluence from your own analysis.
Fine-Tuning & Customization
All settings are fully adjustable in the script's "Inputs" tab to match your risk tolerance and market conditions.
Timeframe & EMA Settings: Adjust the core moving averages that define the trend and pullback zones.
Pullback Settings: Define what constitutes a valid pullback by adjusting the lookback period and the size of the ATR-based "near" zone.
Quality Filters: This is the most important section for tailoring the script's strictness. Increase the EMA Slope, RSI Dead Zone, or Signal Cooldown to receive fewer but potentially higher-quality signals.
Advanced Filters: Enable or disable the Pullback Quality and Volatility filters for an extra layer of confirmation or risk management.
No-Trade Zone Highlighter: Adjust the session and timezone to highlight periods you wish to avoid, such as news events or low-liquidity hours.
Happy trading, and please use this tool responsibly.
Üstel Hareketli Ortalama (EMA)

Trend Continuation IndicatorTrend Continuation Indicator
The Trend Continuation Indicator is designed to assist traders in identifying potential continuation setups within established market trends. It is particularly suited for use in strong trending environments and is optimized for lower timeframes, with a recommended chart setting of 5-minute candles and an EMA timeframe set to 1 hour.
The indicator combines multiple technical elements:
RSI (Relative Strength Index): Used to assess potential overbought and oversold conditions relative to the trend.
EMA (Exponential Moving Average): A multi-timeframe EMA is used as a directional filter, helping to align entries with the broader trend.
Candle Structure and Momentum Filters: The logic includes real-time candle analysis and volume dynamics to identify momentum-driven signals.
Buy signals are generated when price action shows bullish momentum and RSI confirms potential oversold conditions within an uptrend. Conversely, sell signals are triggered when bearish momentum aligns with overbought RSI levels in a downtrend.
This tool is intended for use as part of a broader trading strategy and is best applied in trending markets where continuation patterns are more likely to follow through.
THE INDICATOR ITSELF IS NO FINANCIAL ADVISE!
Here are some usecase examples:

LANZ Strategy 5.0🔷 LANZ Strategy 5.0 — Intraday BUY Signals, Dynamic Lot Size per Account, Real-Time Dashboard and Smart Execution
LANZ Strategy 5.0 is a powerful intraday tool designed for traders who need a visual-first, data-backed BUY system, enhanced with risk-aware lot size calculation and a real-time performance dashboard. This indicator intelligently detects strong momentum setups and provides visual and statistical clarity throughout the session.
📌 This is an indicator, not a strategy — It does not place trades automatically but provides precise conditions, alerts, and visual guides to support execution.
🧠 Core Logic & Features
BUY Entry Conditions (Signal Engine)
A BUY signal is triggered when:
The current price is above the EMA200 (trend filter)
The last 3 candles are bullish (candle body close > open)
You are within the defined session window (NY time)
When all conditions are met and you haven’t reached the daily trade limit, a signal appears on the chart and an optional alert is triggered.
Operational Hours Filter (NY Time)
You define:
Start time (e.g., 01:15 NY)
End time (e.g., 16:00 NY)
The system only evaluates and executes signals within this period. If a BUY setup occurs outside the window, it’s ignored. The chart is also highlighted with a transparent teal background to visually show active trading hours.
Lot Size Panel with Per-Account Risk Management
Designed for traders managing multiple accounts or capital sources. You can enable up to 5 accounts, each with:
Its own capital
Its own risk percentage per trade
The system uses the defined SL in pips, plus the instrument’s pip value, to calculate the lot size per account. All values are shown in a dedicated panel at the bottom-right, automatically updating with each new trade.
The emojis (🐣🦊🦁🐲🐳) distinguish each account visually.
Trade Visualization with Customizable Lines
When a signal is triggered:
An Entry Point (EP) line is drawn at the candle’s close.
A Stop Loss (SL) line is placed X pips below the entry.
A Take Profit (TP) line is placed Y pips above the entry.
All three lines are fully customizable in style, color, and thickness. You define how many bars the lines should extend.
Outcome Tracking & Real-Time Dashboard
Each trade outcome is measured:
SL hit = –1.00%
TP hit = +3.00%
Manual close = calculated dynamically based on price at close time
Each result is labeled on the chart near its level, and stored.
The top-right dashboard updates in real time:
✅ Number of trades
📈 Cumulative % gain/loss of the day (color-coded)
Alerts You Can Trust:
You’ll get a Buy Alert when a valid signal is formed
You’ll get a Trade Executed Alert when the visual operation is plotted
You’ll get a SL/TP Hit Alert with price and result
You’ll get a Manual Close Alert if the configured time is reached and the trade is still active
⚙️ Step-by-Step Execution Flow
At every bar, the system checks:
Are we within the session time window?
Is price above EMA?
Are the last 3 candles bullish?
✅ If yes:
A BUY signal is plotted
Entry/SL/TP lines are drawn
Lot sizes are calculated and displayed
Trade is added to the daily count
🕐 At the configured Manual Close time (e.g., 16:00 NY):
If the trade is still open, it's closed
A label is added with the exact result in %
💡 Ideal For:
Intraday traders who operate within fixed time sessions
Traders managing multiple accounts or capital pools
Anyone who wants full visual clarity of every decision point
Traders who appreciate dynamic lot size calculation and clean execution tracking
👨💻 Credits:
💡 Developed by: LANZ
🧠 Strategy concept & execution model: LANZ
🧪 Tested on: 1H charts with visual-only execution
📈 Designed for: Clarity, adaptability, and full intraday control

EMA Curl Strength+EMA Curl Strength+
Description:
This indicator provides a statistically normalized view of EMA slope momentum using Z-score transformation. By evaluating the rate of change of an EMA and comparing it against its historical behavior, the script highlights momentum shifts in a dynamic, adaptive way.
⸻
How It Works:
• Calculates the slope (percentage change) of a chosen EMA.
• Normalizes the slope using Z-score over a custom lookback period.
• Smooths the resulting signal and computes two signal lines for comparison.
• Assigns dynamic colors based on user-defined Z-score thresholds for mild, moderate, and strong momentum in both directions.
⸻
Visual Features:
• Gradient fill between the Z Curl Line and Signal 1 to highlight slope acceleration.
• Histogram showing the difference between the Z Curl Line and its signal.
• Optional signal crossover shapes between configurable pairs (e.g., Z Curl vs. Signal).
• Background highlights when the Z Curl Line exceeds ±2, indicating strong trending behavior.
⸻
Customization:
• Adjustable EMA length, smoothing lengths, signal lengths, histogram smoothing, and Z-score lookback.
• Separate color controls for:
• Z-score strength bands (mild/moderate/strong up/down)
• Histogram bars
• Signal lines
• Background highlight zones
• Crossover shapes
⸻
Use Cases:
• Momentum Confirmation: Confirm strength when Z Curl exceeds ±2 with matching background highlights.
• Trend Entry Timing: Look for trades when Z Curl crosses above or below the 0-line.
• Scalping: Capture quick directional moves when momentum accelerates.
• Trend Following: Use strong Z Curl values to confirm trade direction and filter sideways action.
• Divergence Detection: Spot divergences between price and Z Curl movement to anticipate reversals.

Hybrid Strategy with Position Control//@version=6
indicator('Hybrid Strategy with Position Control', overlay=true)
// === INPUTS ===
emaFastLen = input.int(8, 'Fast EMA')
emaSlowLen = input.int(21, 'Slow EMA')
rsiLen = input.int(14, 'RSI Length')
rsiOverbought = input.int(70, 'RSI Overbought')
rsiOversold = input.int(30, 'RSI Oversold')
macdFast = input.int(12, 'MACD Fast')
macdSlow = input.int(26, 'MACD Slow')
macdSignal = input.int(9, 'MACD Signal')
// === CALCULATIONS ===
emaFast = ta.ema(close, emaFastLen)
emaSlow = ta.ema(close, emaSlowLen)
rsi = ta.rsi(close, rsiLen)
= ta.macd(close, macdFast, macdSlow, macdSignal)
// === POSITION TRACKING ===
var int position = 0 // 0 = no position, 1 = long, -1 = short
// === ENTRY CONDITIONS ===
longCondition = ta.crossover(emaFast, emaSlow) and rsi < rsiOverbought and macdLine > signalLine and position != 1
shortCondition = ta.crossunder(emaFast, emaSlow) and rsi > rsiOversold and macdLine < signalLine and position != -1
// === EXIT CONDITIONS (Optional logic for reset) ===
exitLong = ta.crossunder(emaFast, emaSlow)
exitShort = ta.crossover(emaFast, emaSlow)
// === SIGNAL PLOTS ===
buySignal = longCondition
sellSignal = shortCondition
plotshape(buySignal, title='Buy Signal', location=location.belowbar, color=color.green, style=shape.triangleup, size=size.small, text='BUY')
plotshape(sellSignal, title='Sell Signal', location=location.abovebar, color=color.red, style=shape.triangledown, size=size.small, text='SELL')
// === STATE MANAGEMENT ===
if (longCondition)
position := 1
if (shortCondition)
position := -1
// Reset position if trend reverses
if (exitLong and position == 1)
position := 0
if (exitShort and position == -1)
position := 0
// === PLOT EMAs ===
plot(emaFast, color=color.orange, title='Fast EMA')
plot(emaSlow, color=color.blue, title='Slow EMA')

Strategy with DI+/DI-, ADX, RSI, MACD, EMA + Time Stop [EXP. 1]Strategy Overview
This is an experimental trend-following strategy combining directional movement indicators, momentum filters, and time-based exits. Built for low timeframes like BTCUSDT 5m, it aims to detect clean directional setups while managing risk tightly.
Indicator Components
• DI+/DI- + ADX – Confirms trend direction and strength
• RSI (14) – Momentum filter (entries only if RSI > 55 or < 45)
• MACD Histogram – Confirms momentum shift in signal direction
• Candle Body % Filter – Screens for strong price commitment bars
• EMA 600 & EMA 2400 – Defines long-term trend alignment
• Time-Based Stop – Closes trade if it doesn’t move 0.75% in 85 bars
• Reward:Risk – 1% stop-loss, 7.5:1 reward-to-risk
• One Trade per EMA Cross – Only trades first valid signal per trend shift
Entry Logic
Long Entry:
• DI+ crosses above DI−
• RSI > 55
• MACD histogram > 0
• Strong bullish candle
• EMA600 > EMA2400
• Occurs within 25 bars of an EMA crossover
Short Entry:
• DI+ crosses below DI−
• RSI < 45
• MACD histogram < 0
• Strong bearish candle
• EMA2400 > EMA600
• Occurs within 25 bars of an EMA crossover
Exit Logic
• Stop-loss: 1% from entry
• Take-profit: 7.5x risk
• Time-stop: Trade closed if price doesn’t move 0.75% in 85 bars
Testing Parameters
• Initial Capital: $10,000
• Commission: 0.04% per trade
• Timeframe: 5-minute
• Tested on: BTCUSDT
• ⚠️ Early-stage strategy — trade count may be low depending on market context. This is shared for educational use and community feedback.
Notes
• This script is experimental and educational
• Please forward-test in a demo environment before using it live
• Open-source for learning and improvement — contributions welcome!

EMA and Dow Theory Strategies🌐 Strategy Description
📘 Overview
This is a hybrid strategy that combines EMA crossovers, Dow Theory swing logic, and multi-timeframe trend overlays. It is suitable for intraday to short-term trading on any asset class: crypto, forex, stocks, and indices.
The strategy provides precise entry/exit signals, dynamic stop-loss and scale-out, and highly visual trade guidance.
🧠 Key Features
・Dual EMA crossover system (applied to both symbol and external index)
・Dow Theory-based swing high/low detection for trend confirmation
・Visual overlay of higher timeframe swing trend (htfTrend)
・RSI filter to avoid overbought/oversold entries
・Dynamic partial take-profit when trend weakens
・Custom stop-loss (%) control
・Visualized trade PnL labels directly on chart
・Alerts for entry, stop-loss, partial exit
・Gradient background zones for swing zones and trend visualization
・Auto-tracked metrics: APR, drawdown, win rate, equity curve
⚙️ Input Parameters
| Parameter | Description |
| ------------------------- | -------------------------------------------------------- |
| Fast EMA / Slow EMA | Periods for detecting local trend via EMAs |
| Index Fast EMA / Slow EMA | EMAs applied to external reference index |
| StopLoss | Maximum loss threshold in % |
| ScaleOut Threshold | Scale-out percentage when trend changes color |
| RSI Period / Levels | RSI period and overbought/oversold levels |
| Swing Detection Length | Number of bars used to detect swing highs/lows |
| Stats Display Options | Toggle PnL labels and position of statistics table |
🧭 About htfTrend (Higher Timeframe Trend)
The script includes a higher timeframe trend (htfTrend) calculated using Dow Theory (pivot highs/lows).
This trend is only used for visual guidance, not for actual entry conditions.
Why? Strictly filtering trades by higher timeframe often leads to missed opportunities and low frequency.
By keeping htfTrend visual-only, traders can still refer to macro structure but retain trade flexibility.
Use it as a contextual tool, not a constraint.
ストラテジー説明
📘 概要
本ストラテジーは、EMAクロスオーバー、ダウ理論によるスイング判定、**上位足トレンドの視覚表示(htfTrend)**を組み合わせた複合型の短期トレーディング戦略です。
仮想通貨・FX・株式・指数など幅広いアセットに対応し、デイトレード〜スキャルピング用途に適しています。
動的な利確/損切り、視覚的にわかりやすいエントリー/イグジット、統計表示を搭載しています。
🧠 主な機能
・対象銘柄+外部インデックスのEMAクロスによるトレンド判定
・ダウ理論に基づいたスイング高値・安値検出とトレンド判断
・上位足スイングトレンド(htfTrend)の視覚表示
・RSIフィルターによる過熱・売られすぎの回避
・トレンドの弱まりに応じた部分利確(スケールアウト)
・**損切り閾値(%)**をカスタマイズ可能
・チャート上に損益ラベル表示
・アラート完備(エントリー・決済・部分利確)
・トレンドゾーンを可視化する背景グラデーション
・勝率・ドローダウン・APR・資産増加率などの自動表示
| 設定項目名 | 説明内容 |
| --------------------- | -------------------------- |
| Fast EMA / Slow EMA | 銘柄に対して使用するEMAの期間設定 |
| Index Fast / Slow EMA | 外部インデックスのEMA設定 |
| 損切り(StopLoss) | 損切りラインのしきい値(%で指定) |
| 部分利確しきい値 | トレンド弱化時にスケールアウトする割合(%) |
| RSI期間・水準 | RSI計算期間と、過熱・売られすぎレベル設定 |
| スイング検出期間 | スイング高値・安値の検出に使用するバー数 |
| 統計表示の切り替え | 損益ラベルや統計テーブルの表示/非表示選択 |
🧭 上位足トレンド(htfTrend)について
本スクリプトには、上位足でのスイング高値・安値の更新に基づく**htfTrend(トレンド判定)が含まれています。
これは視覚的な参考情報であり、エントリーやイグジットには直接使用されていません。**
その理由は、上位足を厳密にロジックに組み込むと、トレード機会の損失が増えるためです。
このスクリプトでは、**判断の補助材料として「表示のみに留める」**設計を採用しています。
→ 裁量で「利確を早める」「逆張りを避ける」判断に活用可能です。


TeeLek-BestPositionThis indicator is used to indicate the best buying and selling points.
This indicator will calculate the best buying points (blue) and selling points (orange). The working principle is that the blue point is the point where the RSI is Over Sold, the orange point is the point where the RSI is Over Bought. After that, we will use the Highest Line 100 and Lowest Line 100 to filter the points another layer. And because when Over Bought/Over Sold occurs, there will be continuous signals that are repeated, causing confusion. Therefore, there is a feature to leave a time frame. Set the default value to 24 hours. If a signal occurs, it will be left out.
The appropriate point for buying is:
The point where Over Sold occurs and Closes lower than the Lowest Line 100.
Leave a time frame for 24 hours before a new signal occurs.
The appropriate point for selling is:
The point where Over Bought occurs and Closes higher than the Highest Line 100.
Leave a time frame for 24 hours before a new signal occurs.
It helps us to gradually buy and collect/sell for profit easily without confusion.
อินดิเคเตอร์นี้ใช้ สำหรับบอกจุดซื้อจุดขายที่ดีที่สุด
อินดิเคเตอร์นี้ จะคำนวณจุดซื้อ (สีฟ้า) และจุดขาย (สีส้ม) ที่ดีที่สุดมาให้ โดยหลักการทำงาน คือ จุดสีฟ้า คือจุดที่ RSI Over Sold จุดสีส้ม คือจุดที่ RSI Over Bought หลังจากนั้นเราจะใช้เส้น Highest Line 100 และ Lowest Line 100 เพื่อกรองจุดอีกชั้นหนึ่ง และเนื่องจากเมื่อเกิด Over Bought/Over Sold แล้ว มันจะเกิดสัญญาณต่อเนื่องซ้ำๆ ทำให้สับสน จึงได้มีฟีเจอร์ในการเว้นระยะเวลา ตั้งค่าไว้เริ่มต้นที่ 24 ชั่วโมง ถ้าเกิดสัญญาณแล้วก็จะเว้นระยะออกไป
จุดที่เหมาะสมกับการซื้อ คือ
จุดที่เกิด Over Sold และ Close ต่ำกว่าเส้น Lowest Line 100
เว้นระยะไป 24 ชั่วโมงจึงจะเกิดสัญญาณใหม่อีกครั้ง
จุดที่เหมาะสมกับการขาย คือ
จุดที่เกิด Over Bought และ Close สูงกว่าเส้น Highest Line 100
เว้นระยะไป 24 ชั่วโมงจึงจะเกิดสัญญาณใหม่อีกครั้ง
ช่วยให้เราสามารถ ทยอยซื้อเก็บสะสม/ทยอยขายทำกำไร ได้ง่ายไม่สับสน

LANZ Strategy 5.0 [Backtest]🔷 LANZ Strategy 5.0 — Rule-Based BUY Logic with Time Filter, Session Limits and Auto SL/TP Execution
This is the backtest version of LANZ Strategy 5.0, built as a strategy script to evaluate real performance under fixed intraday conditions. It automatically places BUY and SELL trades based on structured candle confirmation, EMA trend alignment, and session-based filters. The system simulates real-time execution with precise Stop Loss and Take Profit levels.
📌 Built for traders seeking to simulate clean intraday logic with fully automated entries and performance metrics.
🧠 Core Logic & Strategy Conditions
✅ BUY Signal Conditions:
Price is above the EMA200
The last 3 candles are bullish (close > open)
The signal occurs within the defined session window (NY time)
Daily trade limit has not been exceeded
If all are true, a BUY order is executed at market, with SL and TP set immediately.
🔻 SELL Signal Conditions (Optional):
Exactly inverse to BUY (below EMA + 3 bearish candles). Disabled by default.
🕐 Operational Time Filter (New York Time)
You can fully customize your intraday window:
Start Time: e.g., 01:15 NY
End Time: e.g., 16:00 NY
The system evaluates signals only within this range, even across midnight if configured.
🔁 Trade Management System
One trade at a time per signal
Trades include a Stop Loss (SL) and Take Profit (TP) based on pip distance
Trade result is calculated automatically
Each signal is shown with a triangle marker (BUY only, by default)
🧪 Backtest Accuracy
This version uses:
strategy.order() for entries
strategy.exit() for SL and TP
strategy.close_all() at the configured manual closing time
This ensures realistic behavior in the TradingView strategy tester.
⚙️ Flow Summary (Step-by-Step)
On every bar, check:
Is the time within the operational session?
Is the price above the EMA?
Are the last 3 candles bullish?
If conditions met → A BUY trade is opened:
SL = entry – X pips
TP = entry + Y pips
Trade closes:
If SL or TP is hit
Or at the configured manual close time (e.g., 16:00 NY)
📊 Settings Overview
Timeframe: 1-hour (ideal)
SL/TP: Configurable in pips
Max trades/day: User-defined (default = 99 = unlimited)
Manual close: Adjustable by time
Entry type: Market (not limit)
Visuals: Plotshape triangle for BUY entry
👨💻 Credits:
💡 Developed by: LANZ
🧠 Strategy logic & execution: LANZ
✅ Designed for: Clean backtesting, clarity in execution, and intraday logic simulation

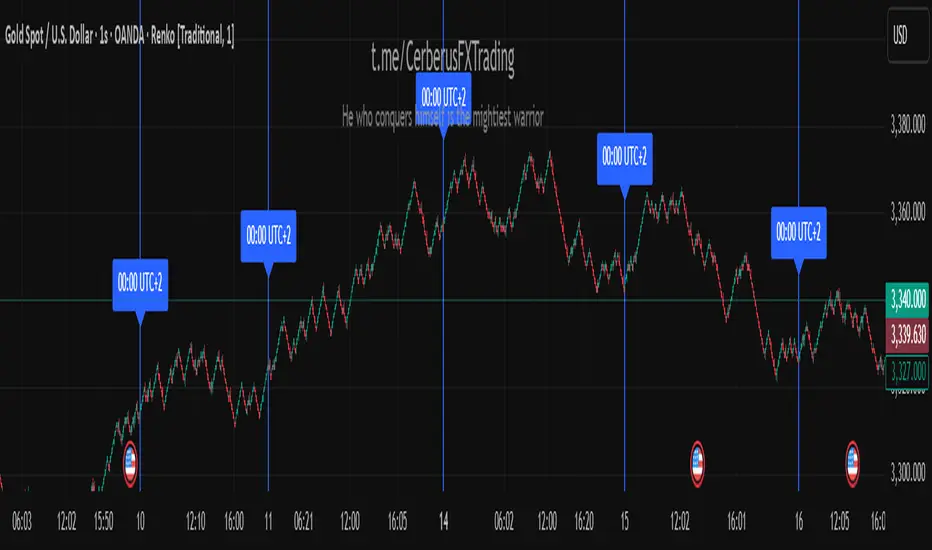
CerberusFX Midnight Line UTC+2Daily Vertical Line UTC+2
Plots a vertical blue line spanning the full chart height at the start of each day at 00:00 UTC+2 (or the next available candle). Includes a label ("00:00 UTC+2") above the candle for clarity. Ideal for separating trading days on intraday charts in the UTC+2 timezone.
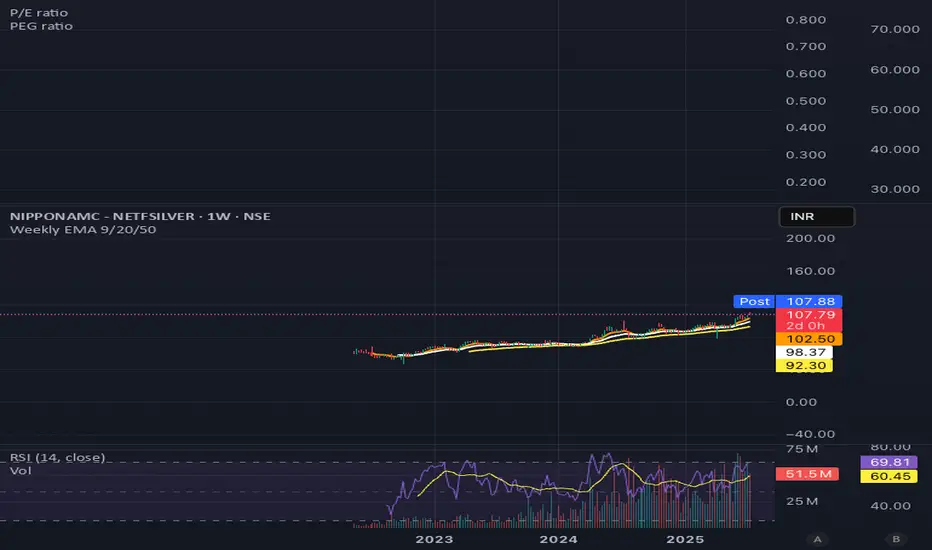
Weekly EMA 9/20/50Weekly EMA for 9, 20 and 50 weeks for any security.
This will show the trends that are otherwise not visible on the daily chart.
MACD & EMA Cross SignalsMACD and EMA Crossover Signals
-> This tool provides buy and sell signals directly on your chart. It helps you spot action points early.
Symbol Indicators:
"Triangle Up" (Green) shows a positive MACD crossover.
"Triangle Down" (Red) indicates a negative MACD crossover.
"Label Up" (Green) marks a positive EMA crossover.
"Label Down" (Red) signals a negative EMA crossover.
Golden Cross Alerts for MACD and EMAs
-> A "Buy" signal appears when both MACD and EMAs cross positive at the same time.
-> A "Sell" signal shows when both indicators cross negative together.
Option to set custom alerts
-> Golden Buy Signal: Both MACD and EMA cross positive.
-> Golden Sell Signal: Both cross negative.
-> Any Buy Signal: Either MACD or EMA crosses up.
-> Any Sell Signal: Either crosses down.
Note: You can change the values for EMAs, Symbol, and Color in the Settings to fit your needs.

Multi-Timeframe EMAs & WMAsMulti-Timeframe EMAs & WMAs (MTF EMAWMA)
The Multi-Timeframe EMAs & WMAs (MTF EMAWMA) indicator is a comprehensive tool designed to provide a multi-dimensional view of market trends by plotting various Exponential Moving Averages (EMAs) and Weighted Moving Averages (WMAs) from different timeframes onto your current chart. This allows traders to quickly assess confluent support and resistance levels, identify trend strength, and gain a broader market perspective without switching timeframes.
Key Features:
Multiple EMAs and WMAs:
This indicator includes:
- EMA 200: Plotted from H1 and M15 timeframes.
- EMA 100: Plotted from H1, M30, and M15 timeframes.
- EMA 50: Plotted from H4, H1, M30, and M15 timeframes.
- WMA 720: Plotted from H4, H1, M30, M15, and M1 timeframes.
Multi-Timeframe Analysis: By displaying moving averages from various timeframes, the indicator helps in understanding the interplay of different trends and their potential impact on price action.
Visual Distinction : Each moving average type and its timeframe representation are color-coded and styled (solid vs. dashed lines) for easy identification and clarity on the chart.
EMA 200: Dark Red
EMA 100: Cyan/Teal
EMA 50: SaddleBrown
WMA 720: Orange
Recommended Usage:
This indicator is specifically tailored for XAU/USD (Gold). It is intended to be used as a confluence tool to complement your existing trading strategies and indicators. It is not designed to be used solely as an entry or exit signal. Instead, leverage the information provided by these multi-timeframe moving averages to:
- Identify major trend directions: Observe the alignment and slope of longer-term moving averages.
- Spot potential support and resistance zones: Price often reacts to these key moving average levels from higher timeframes.
- Confirm trade bias: Use the higher timeframe moving averages to confirm the direction of your trades on lower timeframes.
- Enhance risk management: Understand where strong levels might exist to place stop-losses or take-profits.
Always combine this indicator with other forms of analysis, such as price action, chart patterns, volume analysis, or other technical indicators, to make informed trading decisions.
Remark: The script and description were created by AI.

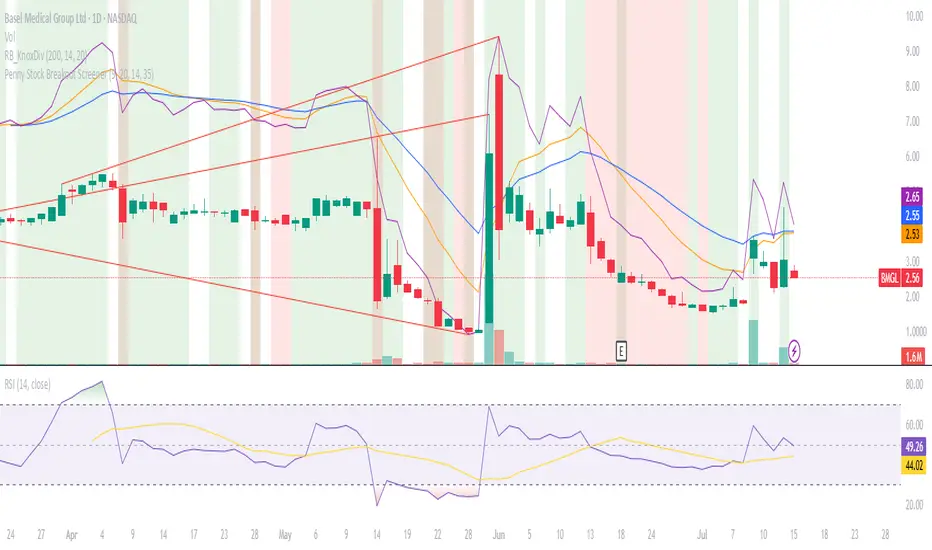
Penny Stock Breakout ScreenerLive Conditions Your Script Is Monitoring:
🔵 Bullish (Green Background = Entry Opportunity):
Breakout Pivot High
✅ Trigger: Price is breaking above the highest close of the last 20 candles (shows momentum).
🔔 Alert: "Price breaking above recent pivot high!"
Price Above VWAP
✅ Trigger: Price is currently above the VWAP (shows buyers are in control).
🔔 Alert: "Price is above VWAP - bullish control!"
EMA 9 > EMA 20 Crossover
✅ Trigger: 9-period EMA crosses above 20 EMA (trend shifting bullish).
🔔 Alert: "EMA9 has crossed above EMA20"
RSI Recovery
✅ Trigger: RSI (14) crosses above 35, indicating a bounce from oversold.
🔔 Alert: "RSI is rising from oversold - bounce incoming"
Volume Spike
✅ Trigger: Current volume is 1.5x greater than 20-day average (buying interest).
🔔 Alert: "Volume > 1.5x 20-day avg - possible breakout"
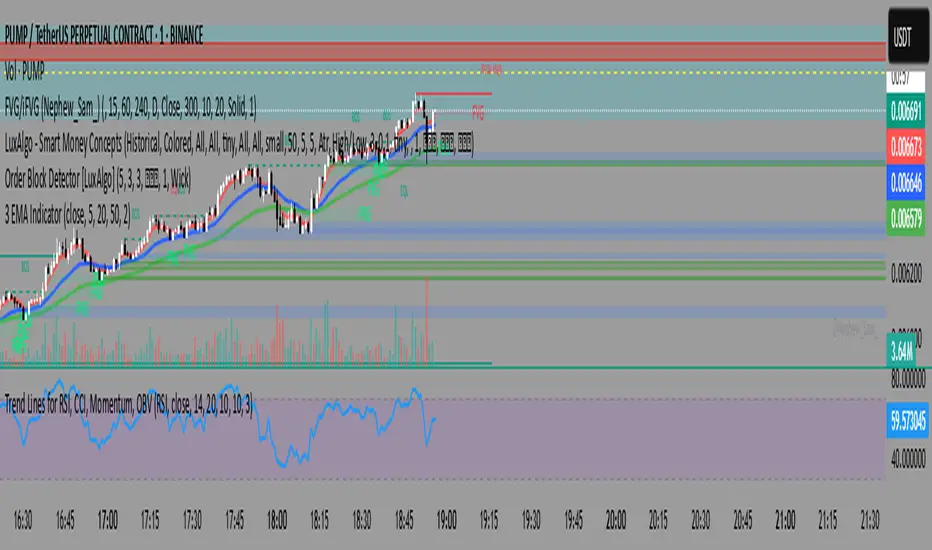
3 EMA Indicator3 EMA Indicator Description
The 3 EMA Indicator is a customizable TradingView indicator designed to plot three Exponential Moving Averages (EMAs) on a price chart. It helps traders analyze trends, identify potential trading signals, and monitor price momentum through the interaction of three EMAs with user-defined periods.
Features
Three EMAs: Displays three EMAs with default periods of 9, 21, and 50, which can be adjusted via input settings.
Customizable Parameters:
Source: Choose the price data (e.g., close, open, hlc3) for EMA calculations (default: close).
EMA Periods: Set custom lengths for each EMA (minimum 1).
Colors: Assign unique colors to each EMA for clear visualization (default: red, blue, green).
Line Width: Adjust the thickness of EMA lines (default: 2).
Dynamic Label: A label on the last bar displays the configured EMA periods (e.g., "EMA1: 9, EMA2: 21, EMA3: 50") for easy reference.
Overlay: Plots directly on the price chart, making it intuitive to compare EMAs with price action.
Usage
Trend Analysis: Use the relative positions of the EMAs to identify bullish (e.g., shorter EMA above longer EMA) or bearish trends.
Crossover Signals: Monitor EMA crossovers (e.g., 9-period EMA crossing above the 21-period EMA) for potential buy or sell signals.
Customization: Adjust periods, colors, and line width through the indicator’s settings to match your trading strategy.
How to Apply
Open TradingView’s Pine Editor.
Copy and paste the indicator’s Pine Script code.
Add the indicator to your chart.
Customize settings (periods, source, colors, line width) via the indicator’s input panel.
This indicator is ideal for traders seeking a simple yet flexible tool to track price trends and momentum using multiple EMAs.
EMA Slope First Flip Signal1. EMA Calculation:
It calculates 4 Exponential Moving Averages:
EMA 5 – very fast (captures short-term moves)
EMA 9 – fast
EMA 21 – medium
EMA 50 – long-term trend
2. Slope Calculation:
It finds the slope of each EMA using:
pinescript
Copy
Edit
slopeX = emaX - emaX
This checks if the EMA is rising (slope > 0) or falling (slope < 0).
3. Trend Condition:
Buy condition: All 4 EMA slopes must be positive
Sell condition: All 4 EMA slopes must be negative
4. First Signal Logic:
It only flashes a signal when the direction changes.
For example:
If EMAs were not all rising before, but now all are → BUY
If EMAs were not all falling before, but now all are → SELL
Prevents repeated signals during the same trend.
5. Safe Boolean Handling:
Uses bool(condition ) to access previous state without error
Avoids using nz() or na() on booleans (which causes errors)
📈 What You See on Chart:
✅ Green "BUY" label below candle when all EMA slopes turn positive for the first time
❌ Red "SELL" label above candle when all EMA slopes turn negative for the first time
🔄 No duplicate signals in the same direction — only on reversal

MCC Smart Reversal Signals📊 MCC Smart Reversal Signals (Stoch RSI) v1.0.9
© 2025 Jawid Iqbal Anwar — MIT License
This indicator is designed to help traders detect potential market reversal points by combining multiple confirmation tools such as:
Stochastic RSI
Classic RSI
Trend direction (EMA-based)
Candlestick reversal patterns
Re-entry logic
Dollar-Cost Averaging (DCA) strategy
Built-in alert system
🔄 What’s New in v1.0.9
✅ Time-Frame Presets: Choose from Custom, Weekly, Daily, 4H, 1H, or 15m profiles — each with optimized parameters.
🤖 Auto Mode: The script can automatically detect the chart timeframe and apply the best preset settings.
🎯 Dynamic Overbought/Oversold Levels:
On 15m and 1H, RSI and Stoch RSI use 6 (Oversold) and 94 (Overbought)
On 4H, Daily, and Weekly, it uses 30/70 for RSI and 20/80 for Stoch RSI
🧠 All original logic from v1.0.8 is retained: signal throttling, strong confirmation, and DCA logic.
🔧 How It Works
1. Watch Buy / Watch Sell Signals
These are early signals that notify you of a possible reversal forming.
🟠 Watch Buy: Triggered when the Stoch RSI enters oversold territory. Will only appear if the market isn’t trending strongly downward.
🔵 Watch Sell: Triggered when the Stoch RSI moves into overbought territory. Once fired, it will pause for a few candles unless the zone is exited.
⚠️ OB/OS zones are adjusted based on the selected preset or Auto mode.
2. Strong Reversal Signals (Higher Confidence)
These provide stronger confirmation when all of the following align:
RSI is in an extreme zone (very low or very high)
A reversal candlestick pattern appears (doji, bullish/bearish)
RSI recently changed direction
EMA trend supports the move (not against a strong trend)
When this happens, you’ll see a green (Buy) or red (Sell) label. These are typically high-probability entries.
3. Re-Entry Dots
If the price stays oversold or overbought for a while and forms a new valid candle setup, a new “Watch” dot will appear.
🔁 These help you catch continuation or delayed reversal setups.
4. DCA (Dollar-Cost Averaging) Signals
✅ DCA Buy: RSI is very low and Stoch RSI remains in the oversold zone — a good place to scale into a long position.
❌ DCA Sell: RSI and Stoch RSI are both in the overbought zone — ideal for scaling out or taking profit.
5. Signal Throttling (Smarter Alerts)
To avoid over-signal noise, the script includes throttling logic:
A signal won’t repeat unless the zone is exited and re-entered.
There’s a minimum bar gap between signals to reduce clutter.
🔔 Built-in Alerts (No Setup Needed)
The script includes alerts for all signal types:
Watch Buy / Watch Sell
Strong Buy / Strong Sell
DCA Buy / DCA Sell
Once you add the script to your chart, you can enable alerts immediately.
🕒 How to Use Timeframes
With v1.0.9, the indicator adapts to your chart:
Auto Mode: Just load the indicator — it adjusts based on your active timeframe.
Manual Presets: Choose a preset if you want specific control.
Timeframe Default OB/OS Settings
15m & 1H RSI & Stoch RSI: 6 / 94
4H+ RSI: 30 / 70, Stoch RSI: 20 / 80
🛠️ Suggested Trading Flow
Add the indicator and select a timeframe preset (or use Auto).
Wait for 🟠 Watch Buy or 🔵 Watch Sell — watch the price behavior.
If a 🟢 Strong Buy or 🔴 Strong Sell appears, consider entering with confirmation.
Use ✅ DCA Buy or ⏺️ DCA Sell to scale in/out slowly.
Use EMA trend and candlestick context to refine your decision.
💡 Final Tips
Let signals come to you — don’t force trades.
Use the OB/OS zones and alerts as part of a structured strategy.
Combine this tool with your price action knowledge for best results.

FInal Signal
This indicator for 4H timeframe by default
RSI + Moving Average of RSI from the 1-hour chart
MACD from the 1-hour chart
21 EMA from the 4-hour chart
5 EMA from the Daily chart
This multi-timeframe fusion offers strength: confirming shorter-term momentum with higher-timeframe support.
✅ Buy Conditions:
RSI is above its moving average → signals bullish momentum
MACD line > MACD signal line → confirms trend shift
RSI has upward slope (compared to 2 candles ago)
❌ Sell Conditions:
RSI falls below its moving average
MACD turns bearish (signal line overtakes)
RSI slopes downward
Price trades below daily EMA → confirms weakening trend
🔊 Volume Spike Detection
I also added a volume condition that checks:
If current volume > 2x the moving average (length = 10)

Friedrich's Ichimoku & EMA Strategy📈 Friedrich's Ichimoku & EMA Strategy
This strategy combines the strength of the Ichimoku Cloud with the long-term trend confirmation of the 200 EMA to identify high-probability long entries.
🧠 Strategy Logic
Entry Conditions:
- Price is above the Ichimoku Cloud (bullish confirmation).
- Price is above the 200 EMA (long-term trend is up).
Exit Conditions:
- Price falls below the Ichimoku Cloud, or
- Price drops below the 200 EMA while in an open position.
📊 Visual Features
Plots Lead Line 1 & 2 of the Ichimoku Cloud.
Fills the cloud area for clear visual trend recognition.
Plots the 200 EMA to show long-term trend alignment.
🔔 Alerts
Long Entry Signal: When all conditions align for a long.
Close Signal: When price invalidates the setup.
🕒 Recommended Use
Best used on the 6H (6-hour) timeframe.
Optimized for Bitcoin (BTC/USD), but adaptable to other trending assets.
💡 Use Case
This strategy is designed for traders who want to:
Ride strong trends.
Use a rule-based approach with clear visual guidance.
You can customize the Ichimoku or EMA settings to fit your asset or time frame.

Momentum Trading StrategyThis is a Trend Following Momentum Strategy, where i used EMA, ADX, RSI, VWAP to take trade with Trend and initiate trade when Momentum builds up.
The Default target is 1:2

Trend Band Oscillator📌 Trend Band Oscillator
📄 Description
Trend Band Oscillator is a momentum-based trend indicator that calculates the spread between two EMAs and overlays it with a volatility filter using a standard deviation band. It helps traders visualize not only the trend direction but also the strength and stability of the trend.
📌 Features
🔹 EMA Spread Calculation: Measures the difference between a fast and slow EMA to quantify short-term vs mid-term trend dynamics.
🔹 Volatility Band Overlay: Applies an EMA of standard deviation to the spread to filter noise and highlight valid momentum shifts.
🔹 Color-Based Visualization: Positive spread values are shown in lime (bullish), negative values in fuchsia (bearish) for quick directional insight.
🔹 Upper/Lower Bands: Help detect potential overbought/oversold conditions or strong trend continuation.
🔹 Zero Line Reference: A horizontal baseline at zero helps identify trend reversals and neutral zones.
🛠️ How to Use
✅ Spread > 0: Indicates a bullish trend. Consider maintaining or entering long positions.
✅ Spread < 0: Indicates a bearish trend. Consider maintaining or entering short positions.
⚠️ Spread exceeds bands: May signal overextension or strong momentum; consider using with additional confirmation indicators.
🔄 Band convergence: Suggests weakening trend and potential transition to a ranging market.
Recommended timeframes: 1H, 4H, Daily
Suggested complementary indicators: RSI, MACD, OBV, SuperTrend
✅ TradingView House Rules Compliance
This script is open-source and published under Pine Script v5.
It does not repaint, spam alerts, or cause performance issues.
It is designed as an analytical aid only and should not be considered financial advice.
All calculations are transparent, and no external data sources or insecure functions are used.
====================================================================
📌 Trend Band Oscillator
📄 설명 (Description)
Trend Band Oscillator는 두 개의 EMA 간 스프레드(차이)를 기반으로 한 모멘텀 중심의 추세 오실레이터입니다. 여기에 표준편차 기반의 변동성 밴드를 적용하여, 추세의 방향뿐 아니라 강도와 안정성까지 시각적으로 분석할 수 있도록 설계되었습니다.
📌 주요 특징 (Features)
🔹 EMA 기반 스프레드 계산: Fast EMA와 Slow EMA의 차이를 활용해 시장 추세를 정량적으로 표현합니다.
🔹 표준편차 필터링: Spread에 대해 EMA 및 표준편차 기반의 밴드를 적용해 노이즈를 줄이고 유효한 추세를 강조합니다.
🔹 컬러 기반 시각화: 오실레이터 값이 양수일 경우 초록색, 음수일 경우 마젠타 색으로 추세 방향을 직관적으로 파악할 수 있습니다.
🔹 밴드 범위 시각화: 상·하위 밴드를 통해 스프레드의 평균 편차 범위를 보여주며, 추세의 강약과 포화 여부를 진단할 수 있습니다.
🔹 제로 라인 표시: 추세 전환 가능 지점을 시각적으로 확인할 수 있도록 중심선(0선)을 제공합니다.
🛠️ 사용법 (How to Use)
✅ 오실레이터가 0 이상 유지: 상승 추세 구간이며, 롱 포지션 유지 또는 진입 검토
✅ 오실레이터가 0 이하 유지: 하락 추세 구간이며, 숏 포지션 유지 또는 진입 검토
⚠️ 상·하위 밴드를 이탈: 일시적인 과매수/과매도 혹은 강한 추세 발현 가능성 있음 → 다른 보조지표와 함께 필터링 권장
🔄 밴드 수렴: 추세가 약해지고 있음을 나타냄 → 변동성 하락 또는 방향성 상실 가능성 있음
권장 적용 시간대: 1시간봉, 4시간봉, 일봉
보조 적용 지표: RSI, MACD, OBV, SuperTrend 등과 함께 사용 시 신호 필터링에 유리
✅ 트레이딩뷰 하우스룰 준수사항 (TV House Rules Compliance)
이 지표는 **무료 공개용(Open-Source)**이며, Pine Script Version 5로 작성되어 있습니다.
과도한 리페인트, 비정상적 반복 경고(alert spam), 실시간 성능 저하 등의 요소는 포함되어 있지 않습니다.
사용자는 본 지표를 투자 결정의 참고용 보조 도구로 활용해야 하며, 독립적인 매매 판단이 필요합니다.
데이터 소스 및 계산 방식은 완전히 공개되어 있으며, 외부 API나 보안 취약점을 유발하는 구성 요소는 없습니다.

10/50 EMA Cloud + 21 EMA + VWAP + FractalsThis indicator is designed for active traders and combines several popular technical analysis tools into a single, easy-to-use overlay. It helps traders identify trend direction, dynamic support and resistance, and potential reversal points, all while providing optional fractal signals for added clarity.
Features and Components
1. EMA Cloud (10/50 EMA)
10-period EMA (Exponential Moving Average): Tracks short-term price momentum.
50-period EMA: Represents a longer-term trend.
Cloud Visualization: The area between the 10 and 50 EMA is filled with color:
Green cloud when the 10 EMA is above the 50 EMA, signaling bullish momentum.
Red cloud when the 10 EMA is below the 50 EMA, signaling bearish momentum.
Purpose: Quickly visualize the prevailing trend and potential trend shifts.
2. 21-period EMA
21 EMA: Plotted as a blue line, this moving average is widely used to gauge intermediate-term trend and dynamic support/resistance.
Purpose: Acts as a reference for trend-following entries and exits.
3. VWAP (Volume Weighted Average Price)
VWAP Line: Plotted in orange, VWAP gives the average price weighted by volume for the session.
Purpose: Useful for identifying fair value, potential bounce/reversal zones, and institutional interest levels.
4. Fractals (Toggleable)
User Option: A setting allows the user to turn fractal signals on or off.
Fractal Logic: Uses a 5-bar pattern:
Up Fractal: Plots a green triangle above the bar if the high of the middle bar (2 bars ago) is higher than the highs of the two bars before and after.
Down Fractal: Plots a red triangle below the bar if the low of the middle bar (2 bars ago) is lower than the lows of the two bars before and after.
Purpose: Highlights potential short-term reversal points or swing highs/lows.
5. Volume Bars
Volume Histogram: Plotted in gray at the bottom of the chart.
Purpose: Provides context for price action, helping to confirm breakouts or identify exhaustion.
How to Use This Indicator
Trend Identification: Use the EMA cloud and 21 EMA to determine the prevailing trend. Trade in the direction of the cloud color and EMA alignment.
VWAP Strategies: Look for price reactions at the VWAP for possible rebounds, breakouts, or reversals.
Fractal Signals: Enable fractals to spot potential reversal zones or to fine-tune entries/exits at swing points.
Volume Confirmation: Use volume bars to validate the strength of moves, especially near key EMAs or VWAP.
Customization
Fractals On/Off: Easily toggle fractal signals in the indicator settings to reduce chart clutter or focus on other signals as needed.
