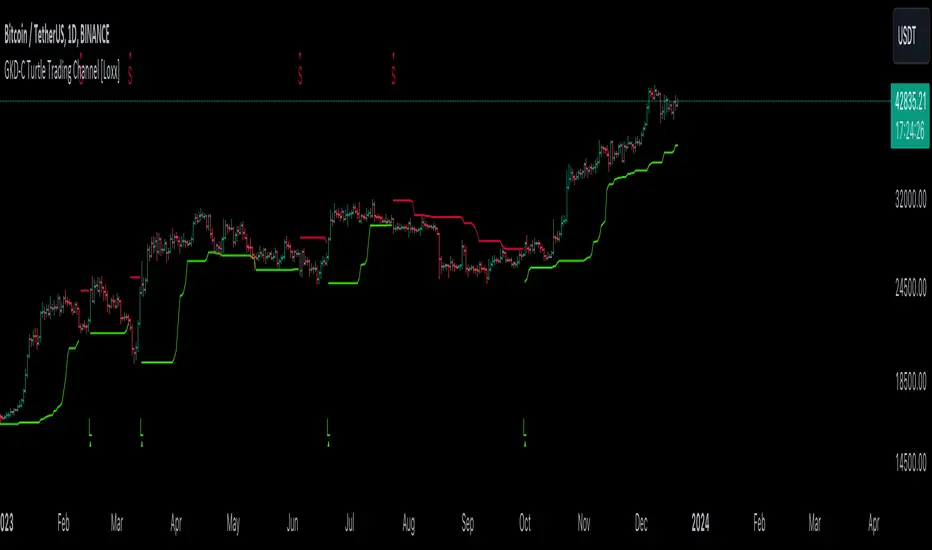
GKD-C Turtle Trading Channel [Loxx]The Giga Kaleidoscope GKD-C Turtle Trading Channel is a confirmation module included in Loxx's "Giga Kaleidoscope Modularized Trading System."
█ GKD-C Turtle Trading Channel
The "Turtle Trading Channel" refers to a method of trading based on a concept taught by Richard Dennis and William Eckhardt to a group of traders known as the Turtles in the 1980s. This approach involves a set of rules for buying and selling commodities or financial instruments, primarily based on breakouts from a certain range.
In trading, a "channel" is often represented as two lines on a price chart: an upper line representing a resistance level and a lower line representing a support level. In the context of Turtle Trading, these lines are typically drawn based on recent high and low prices, and trades are initiated when the price breaks out of this channel, indicating a potential trend.
█ Giga Kaleidoscope Modularized Trading System
Core components of an NNFX algorithmic trading strategy
The NNFX algorithm is built on the principles of trend, momentum, and volatility. There are six core components in the NNFX trading algorithm:
1. Volatility - price volatility; e.g., Average True Range, True Range Double, Close-to-Close, etc.
2. Baseline - a moving average to identify price trend
3. Confirmation 1 - a technical indicator used to identify trends
4. Confirmation 2 - a technical indicator used to identify trends
5. Continuation - a technical indicator used to identify trends
6. Volatility/Volume - a technical indicator used to identify volatility/volume breakouts/breakdown
7. Exit - a technical indicator used to determine when a trend is exhausted
8. Metamorphosis - a technical indicator that produces a compound signal from the combination of other GKD indicators*
*(not part of the NNFX algorithm)
What is Volatility in the NNFX trading system?
In the NNFX (No Nonsense Forex) trading system, ATR (Average True Range) is typically used to measure the volatility of an asset. It is used as a part of the system to help determine the appropriate stop loss and take profit levels for a trade. ATR is calculated by taking the average of the true range values over a specified period.
True range is calculated as the maximum of the following values:
-Current high minus the current low
-Absolute value of the current high minus the previous close
-Absolute value of the current low minus the previous close
ATR is a dynamic indicator that changes with changes in volatility. As volatility increases, the value of ATR increases, and as volatility decreases, the value of ATR decreases. By using ATR in NNFX system, traders can adjust their stop loss and take profit levels according to the volatility of the asset being traded. This helps to ensure that the trade is given enough room to move, while also minimizing potential losses.
Other types of volatility include True Range Double (TRD), Close-to-Close, and Garman-Klass
What is a Baseline indicator?
The baseline is essentially a moving average, and is used to determine the overall direction of the market.
The baseline in the NNFX system is used to filter out trades that are not in line with the long-term trend of the market. The baseline is plotted on the chart along with other indicators, such as the Moving Average (MA), the Relative Strength Index (RSI), and the Average True Range (ATR).
Trades are only taken when the price is in the same direction as the baseline. For example, if the baseline is sloping upwards, only long trades are taken, and if the baseline is sloping downwards, only short trades are taken. This approach helps to ensure that trades are in line with the overall trend of the market, and reduces the risk of entering trades that are likely to fail.
By using a baseline in the NNFX system, traders can have a clear reference point for determining the overall trend of the market, and can make more informed trading decisions. The baseline helps to filter out noise and false signals, and ensures that trades are taken in the direction of the long-term trend.
What is a Confirmation indicator?
Confirmation indicators are technical indicators that are used to confirm the signals generated by primary indicators. Primary indicators are the core indicators used in the NNFX system, such as the Average True Range (ATR), the Moving Average (MA), and the Relative Strength Index (RSI).
The purpose of the confirmation indicators is to reduce false signals and improve the accuracy of the trading system. They are designed to confirm the signals generated by the primary indicators by providing additional information about the strength and direction of the trend.
Some examples of confirmation indicators that may be used in the NNFX system include the Bollinger Bands, the MACD (Moving Average Convergence Divergence), and the MACD Oscillator. These indicators can provide information about the volatility, momentum, and trend strength of the market, and can be used to confirm the signals generated by the primary indicators.
In the NNFX system, confirmation indicators are used in combination with primary indicators and other filters to create a trading system that is robust and reliable. By using multiple indicators to confirm trading signals, the system aims to reduce the risk of false signals and improve the overall profitability of the trades.
What is a Continuation indicator?
In the NNFX (No Nonsense Forex) trading system, a continuation indicator is a technical indicator that is used to confirm a current trend and predict that the trend is likely to continue in the same direction. A continuation indicator is typically used in conjunction with other indicators in the system, such as a baseline indicator, to provide a comprehensive trading strategy.
What is a Volatility/Volume indicator?
Volume indicators, such as the On Balance Volume (OBV), the Chaikin Money Flow (CMF), or the Volume Price Trend (VPT), are used to measure the amount of buying and selling activity in a market. They are based on the trading volume of the market, and can provide information about the strength of the trend. In the NNFX system, volume indicators are used to confirm trading signals generated by the Moving Average and the Relative Strength Index. Volatility indicators include Average Direction Index, Waddah Attar, and Volatility Ratio. In the NNFX trading system, volatility is a proxy for volume and vice versa.
By using volume indicators as confirmation tools, the NNFX trading system aims to reduce the risk of false signals and improve the overall profitability of trades. These indicators can provide additional information about the market that is not captured by the primary indicators, and can help traders to make more informed trading decisions. In addition, volume indicators can be used to identify potential changes in market trends and to confirm the strength of price movements.
What is an Exit indicator?
The exit indicator is used in conjunction with other indicators in the system, such as the Moving Average (MA), the Relative Strength Index (RSI), and the Average True Range (ATR), to provide a comprehensive trading strategy.
The exit indicator in the NNFX system can be any technical indicator that is deemed effective at identifying optimal exit points. Examples of exit indicators that are commonly used include the Parabolic SAR, and the Average Directional Index (ADX).
The purpose of the exit indicator is to identify when a trend is likely to reverse or when the market conditions have changed, signaling the need to exit a trade. By using an exit indicator, traders can manage their risk and prevent significant losses.
In the NNFX system, the exit indicator is used in conjunction with a stop loss and a take profit order to maximize profits and minimize losses. The stop loss order is used to limit the amount of loss that can be incurred if the trade goes against the trader, while the take profit order is used to lock in profits when the trade is moving in the trader's favor.
Overall, the use of an exit indicator in the NNFX trading system is an important component of a comprehensive trading strategy. It allows traders to manage their risk effectively and improve the profitability of their trades by exiting at the right time.
What is an Metamorphosis indicator?
The concept of a metamorphosis indicator involves the integration of two or more GKD indicators to generate a compound signal. This is achieved by evaluating the accuracy of each indicator and selecting the signal from the indicator with the highest accuracy. As an illustration, let's consider a scenario where we calculate the accuracy of 10 indicators and choose the signal from the indicator that demonstrates the highest accuracy.
The resulting output from the metamorphosis indicator can then be utilized in a GKD-BT backtest by occupying a slot that aligns with the purpose of the metamorphosis indicator. The slot can be a GKD-B, GKD-C, or GKD-E slot, depending on the specific requirements and objectives of the indicator. This allows for seamless integration and utilization of the compound signal within the GKD-BT framework.
How does Loxx's GKD (Giga Kaleidoscope Modularized Trading System) implement the NNFX algorithm outlined above?
Loxx's GKD v2.0 system has five types of modules (indicators/strategies). These modules are:
1. GKD-BT - Backtesting module (Volatility, Number 1 in the NNFX algorithm)
2. GKD-B - Baseline module (Baseline and Volatility/Volume, Numbers 1 and 2 in the NNFX algorithm)
3. GKD-C - Confirmation 1/2 and Continuation module (Confirmation 1/2 and Continuation, Numbers 3, 4, and 5 in the NNFX algorithm)
4. GKD-V - Volatility/Volume module (Confirmation 1/2, Number 6 in the NNFX algorithm)
5. GKD-E - Exit module (Exit, Number 7 in the NNFX algorithm)
6. GKD-M - Metamorphosis module (Metamorphosis, Number 8 in the NNFX algorithm, but not part of the NNFX algorithm)
(additional module types will added in future releases)
Each module interacts with every module by passing data to A backtest module wherein the various components of the GKD system are combined to create a trading signal.
That is, the Baseline indicator passes its data to Volatility/Volume. The Volatility/Volume indicator passes its values to the Confirmation 1 indicator. The Confirmation 1 indicator passes its values to the Confirmation 2 indicator. The Confirmation 2 indicator passes its values to the Continuation indicator. The Continuation indicator passes its values to the Exit indicator, and finally, the Exit indicator passes its values to the Backtest strategy.
This chaining of indicators requires that each module conform to Loxx's GKD protocol, therefore allowing for the testing of every possible combination of technical indicators that make up the six components of the NNFX algorithm.
What does the application of the GKD trading system look like?
Example trading system:
Backtest: Multi-Ticker CC Backtest
Baseline: Hull Moving Average
Volatility/Volume: Hurst Exponent
Confirmation 1: Advance Trend Pressure as shown on the chart above
Confirmation 2: uf2018
Continuation: Coppock Curve
Exit: Rex Oscillator
Metamorphosis: Baseline Optimizer
Each GKD indicator is denoted with a module identifier of either: GKD-BT, GKD-B, GKD-C, GKD-V, GKD-M, or GKD-E. This allows traders to understand to which module each indicator belongs and where each indicator fits into the GKD system.
? Giga Kaleidoscope Modularized Trading System Signals
Standard Entry
1. GKD-C Confirmation gives signal
2. Baseline agrees
3. Price inside Goldie Locks Zone Minimum
4. Price inside Goldie Locks Zone Maximum
5. Confirmation 2 agrees
6. Volatility/Volume agrees
1-Candle Standard Entry
1a. GKD-C Confirmation gives signal
2a. Baseline agrees
3a. Price inside Goldie Locks Zone Minimum
4a. Price inside Goldie Locks Zone Maximum
Next Candle
1b. Price retraced
2b. Baseline agrees
3b. Confirmation 1 agrees
4b. Confirmation 2 agrees
5b. Volatility/Volume agrees
Baseline Entry
1. GKD-B Baseline gives signal
2. Confirmation 1 agrees
3. Price inside Goldie Locks Zone Minimum
4. Price inside Goldie Locks Zone Maximum
5. Confirmation 2 agrees
6. Volatility/Volume agrees
7. Confirmation 1 signal was less than 'Maximum Allowable PSBC Bars Back' prior
1-Candle Baseline Entry
1a. GKD-B Baseline gives signal
2a. Confirmation 1 agrees
3a. Price inside Goldie Locks Zone Minimum
4a. Price inside Goldie Locks Zone Maximum
5a. Confirmation 1 signal was less than 'Maximum Allowable PSBC Bars Back' prior
Next Candle
1b. Price retraced
2b. Baseline agrees
3b. Confirmation 1 agrees
4b. Confirmation 2 agrees
5b. Volatility/Volume agrees
Volatility/Volume Entry
1. GKD-V Volatility/Volume gives signal
2. Confirmation 1 agrees
3. Price inside Goldie Locks Zone Minimum
4. Price inside Goldie Locks Zone Maximum
5. Confirmation 2 agrees
6. Baseline agrees
7. Confirmation 1 signal was less than 7 candles prior
1-Candle Volatility/Volume Entry
1a. GKD-V Volatility/Volume gives signal
2a. Confirmation 1 agrees
3a. Price inside Goldie Locks Zone Minimum
4a. Price inside Goldie Locks Zone Maximum
5a. Confirmation 1 signal was less than 'Maximum Allowable PSVVC Bars Back' prior
Next Candle
1b. Price retraced
2b. Volatility/Volume agrees
3b. Confirmation 1 agrees
4b. Confirmation 2 agrees
5b. Baseline agrees
Confirmation 2 Entry
1. GKD-C Confirmation 2 gives signal
2. Confirmation 1 agrees
3. Price inside Goldie Locks Zone Minimum
4. Price inside Goldie Locks Zone Maximum
5. Volatility/Volume agrees
6. Baseline agrees
7. Confirmation 1 signal was less than 7 candles prior
1-Candle Confirmation 2 Entry
1a. GKD-C Confirmation 2 gives signal
2a. Confirmation 1 agrees
3a. Price inside Goldie Locks Zone Minimum
4a. Price inside Goldie Locks Zone Maximum
5a. Confirmation 1 signal was less than 'Maximum Allowable PSC2C Bars Back' prior
Next Candle
1b. Price retraced
2b. Confirmation 2 agrees
3b. Confirmation 1 agrees
4b. Volatility/Volume agrees
5b. Baseline agrees
PullBack Entry
1a. GKD-B Baseline gives signal
2a. Confirmation 1 agrees
3a. Price is beyond 1.0x Volatility of Baseline
Next Candle
1b. Price inside Goldie Locks Zone Minimum
2b. Price inside Goldie Locks Zone Maximum
3b. Confirmation 1 agrees
4b. Confirmation 2 agrees
5b. Volatility/Volume agrees
Continuation Entry
1. Standard Entry, 1-Candle Standard Entry, Baseline Entry, 1-Candle Baseline Entry, Volatility/Volume Entry, 1-Candle Volatility/Volume Entry, Confirmation 2 Entry, 1-Candle Confirmation 2 Entry, or Pullback entry triggered previously
2. Baseline hasn't crossed since entry signal trigger
4. Confirmation 1 agrees
5. Baseline agrees
6. Confirmation 2 agrees
Donchian Kanalları (DC)
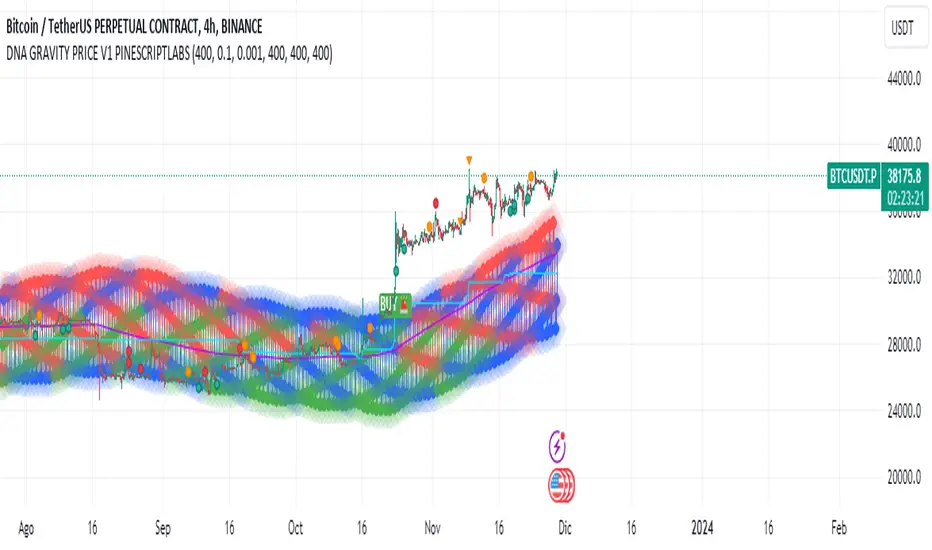
DNA GRAVITY PRICE V1 PINESCRIPTLABSWe can observe that this indicator displays the range within which the asset fluctuates around the average price, and its behavior depends on the parameters of amplitude and angular frequency. "price_mas" is a measure calculated as part of the indicator. It is derived by adding an adjusted amplitude (A_mas) multiplied by the cosine of the combination of angular frequency (w), time, and a phase shift (phi) to the average price (P0). This calculated value oscillates around the actual asset price and is used to identify potential turning points and the range where the price has established itself within the specified lookback period.
2.- At its core, the indicator utilizes the innovative concept of 'price_mas,' a calculated metric visualized in three essential colors: green to indicate low levels, blue for medium levels, and red for high levels. These colors reflect the position of the price in relation to a range determined by historical highs and lows.
In the context of the "DNA GRAVITY PRICE V1 " indicator, low, medium, and high levels specifically refer to the calculated value of 'price_mas,' which is a derived measure within the indicator. They do not directly refer to the actual asset price but rather to a calculated value that the indicator uses to analyze and predict the behavior of the asset's price.
This algorithm stands out for its ability to capture the 'strength' of the price through the 'price_mas' zones. Once the price exits the zones marked by the 'price_mas' (red, blue, and green plots), it tends to return with significant force.
Buy & Sell Signals:
Buy Signal: If the price and the Donchian lines cross above the high threshold, visually represented by red diamonds, it indicates a strong bullish momentum. This not only shows that the price is rising but also that the trend is strong enough to push the Donchian lines, which represent price extremes over a certain period, above the threshold. This convergence of movements, marked by the crossing over the red diamonds, suggests a higher probability of the bullish trend continuing.
Sell Signal: Similarly, if the price and the Donchian lines fall below the low threshold, visualized as green diamonds, this signals a significant bearish momentum. The simultaneous decline of the price and the Donchian lines below this threshold, marked by the green diamonds, indicates that not only is the price decreasing, but the bearish trend is strong enough to influence the price extremes calculated by the Donchian lines.
Configuration:
-The "Initial Dynamic Length of MAS Price" parameter controls the smoothness and sensitivity of the indicator. A high value smooths the Simple Moving Average (SMA), making the indicator less responsive to short-term price fluctuations. On the other hand, a low value makes the indicator more sensitive to short-term price fluctuations, generating faster and more volatile signals
-This parameter, "MAS Amplitude Percentage," determines the amplitude as a percentage. Increasing the Initial Dynamic Price will result in a larger amplitude relative to the price, leading to wider ranges for the indicator. Decreasing this value will have the opposite effect, reducing the amplitude relative to the price. Increasing "A_mas_pct" can make signals more extreme and less frequent, while decreasing it will make signals smoother and more frequent.
-This parameter, "Angular Frequency of MAS," affects the frequency of oscillations in the calculation of the "Initial Dynamic Price." A higher value of "w" will make the oscillations faster and more frequent, which means that the indicator will be more responsive to abrupt price changes. Conversely, a lower value will make the oscillations slower and smoother, making the indicator less sensitive to rapid price changes. Modifying ""Angular Frequency of MAS,"" directly impacts the frequency of oscillations in the indicator.
Español:
Podemos observar que este indicador muestra el rango en el cual el activo fluctúa alrededor del precio promedio y su comportamiento depende de los parámetros de amplitud y frecuencia angular. "price_mas" es una medida calculada como parte del indicador. Se deriva al sumar una amplitud ajustada (A_mas) multiplicada por el coseno de la combinación de frecuencia angular (w), tiempo y un desplazamiento de fase (phi) al precio promedio (P0). Este valor calculado oscila alrededor del precio real del activo y se utiliza para identificar posibles puntos de giro y el rango donde el precio se ha establecido dentro del período de búsqueda especificado.
En su núcleo, el indicador utiliza el innovador concepto de 'price_mas', una métrica calculada visualizada en tres colores esenciales: verde para indicar niveles bajos, azul para niveles medios y rojo para niveles altos. Estos colores reflejan la posición del precio en relación con un rango determinado por los máximos y mínimos históricos.
En el contexto del indicador "DNA GRAVITY PRICE V1", los niveles bajos, medios y altos se refieren específicamente al valor calculado de 'price_mas', que es una medida derivada dentro del indicador. No se refieren directamente al precio real del activo, sino a un valor calculado que el indicador utiliza para analizar y predecir el comportamiento del precio del activo.
Este algoritmo se destaca por su capacidad para capturar la 'fortaleza' del precio a través de las zonas de 'price_mas'. Una vez que el precio sale de las zonas marcadas por 'price_mas' (trazas rojas, azules y verdes), tiende a regresar con una fuerza significativa. Este comportamiento es crucial para los operadores, ya que proporciona oportunidades tanto para capitalizar las retracciones de precios como para anticipar posibles cambios de tendencia.
Señales de Compra y Venta:
Señal de Compra: Si el precio y las líneas Donchian cruzan por encima del umbral alto, visualmente representado por diamantes rojos, indica un fuerte impulso alcista. Esto no solo muestra que el precio está aumentando, sino que la tendencia es lo suficientemente fuerte como para empujar las líneas Donchian, que representan los extremos de precio durante un período determinado, por encima del umbral. Esta convergencia de movimientos, marcada por el cruce sobre los diamantes rojos, sugiere una mayor probabilidad de que la tendencia alcista continúe.
Señal de Venta: De manera similar, si el precio y las líneas Donchian caen por debajo del umbral bajo, visualizado como diamantes verdes, esto señala un fuerte impulso bajista. La caída simultánea del precio y las líneas Donchian por debajo de este umbral, marcada por los diamantes verdes, indica que no solo el precio está disminuyendo, sino que la tendencia bajista es lo suficientemente fuerte como para influir en los extremos de precio calculados por las líneas Donchian.
Configuración:
El parámetro "Longitud Dinámica Inicial de MAS Price" controla la suavidad y la sensibilidad del indicador. Un valor alto suaviza el Promedio Móvil Simple (SMA), lo que hace que el indicador sea menos sensible a las fluctuaciones de precio a corto plazo. Por otro lado, un valor bajo hace que el indicador sea más sensible a las fluctuaciones de precio a corto plazo, generando señales más rápidas y volátiles.
Este parámetro, "Porcentaje de Amplitud de MAS," determina la amplitud como un porcentaje. Aumentar el valor de "Longitud Dinámica Inicial de MAS Price" dará como resultado una amplitud más grande en relación con el precio, lo que conducirá a rangos más amplios para el indicador. Disminuir este valor tendrá el efecto contrario, reduciendo la amplitud en relación con el precio. Aumentar "Porcentaje de A_mas" puede hacer que las señales sean más extremas y menos frecuentes, mientras que disminuirlo hará que las señales sean más suaves y más frecuentes.
Este parámetro, "Frecuencia Angular de MAS," afecta la frecuencia de las oscilaciones en el cálculo del "Precio Móvil Simple Inicial." Un valor más alto de "w" hará que las oscilaciones sean más rápidas y frecuentes, lo que significa que el indicador será más receptivo a cambios abruptos en el precio. Por otro lado, un valor más bajo hará que las oscilaciones sean más lentas y suaves, haciendo que el indicador sea menos sensible a cambios rápidos en el precio. Modificar "Frecuencia Angular de MAS" afecta directamente la frecuencia de las oscilaciones en el indicador.
Optimal Length BackTester [YinYangAlgorithms]This Indicator allows for a ‘Optimal Length’ to be inputted within the Settings as a Source. Unlike most Indicators and/or Strategies that rely on either Static Lengths or Internal calculations for the length, this Indicator relies on the Length being derived from an external Indicator in the form of a Source Input.
This may not sound like much, but this application may allows limitless implementations of such an idea. By allowing the input of a Length within a Source Setting you may have an ‘Optimal Length’ that adjusts automatically without the need for manual intervention. This may allow for Traditional and Non-Traditional Indicators and/or Strategies to allow modifications within their settings as well to accommodate the idea of this ‘Optimal Length’ model to create an Indicator and/or Strategy that adjusts its length based on the top performing Length within the current Market Conditions.
This specific Indicator aims to allow backtesting with an ‘Optimal Length’ inputted as a ‘Source’ within the Settings.
This ‘Optimal Length’ may be used to display and potentially optimize multiple different Traditional Indicators within this BackTester. The following Traditional Indicators are included and available to be backtested with an ‘Optimal Length’ inputted as a Source in the Settings:
Moving Average; expressed as either a: Simple Moving Average, Exponential Moving Average or Volume Weighted Moving Average
Bollinger Bands; expressed based on the Moving Average Type
Donchian Channels; expressed based on the Moving Average Type
Envelopes; expressed based on the Moving Average Type
Envelopes Adjusted; expressed based on the Moving Average Type
All of these Traditional Indicators likewise may be displayed with multiple ‘Optimal Lengths’. They have the ability for multiple different ‘Optimal Lengths’ to be inputted and displayed, such as:
Fast Optimal Length
Slow Optimal Length
Neutral Optimal Length
By allowing for the input of multiple different ‘Optimal Lengths’ we may express the ‘Optimal Movement’ of such an expressed Indicator based on different Time Frames and potentially also movement based on Fast, Slow and Neutral (Inclusive) Lengths.
This in general is a simple Indicator that simply allows for the input of multiple different varieties of ‘Optimal Lengths’ to be displayed in different ways using Tradition Indicators. However, the idea and model of accepting a Length as a Source is unique and may be adopted in many different forms and endless ideas.
Tutorial:
You may add an ‘Optimal Length’ within the Settings as a ‘Source’ as followed in the example above. This Indicator allows for the input of a:
Neutral ‘Optimal Length’
Fast ‘Optimal Length’
Slow ‘Optimal Length’
It is important to account for all three as they generally encompass different min/max length values and therefore result in varying ‘Optimal Length’s’.
For instance, say you’re calculating the ‘Optimal Length’ and you use:
Min: 1
Max: 400
This would therefore be scanning for 400 (inclusive) lengths.
As a general way of calculating you may assume the following for which lengths are being used within an ‘Optimal Length’ calculation:
Fast: 1 - 199
Slow: 200 - 400
Neutral: 1 - 400
This allows for the calculation of a Fast and Slow length within the predetermined lengths allotted. However, it likewise allows for a Neutral length which is inclusive to all lengths alloted and may be deemed the ‘Most Accurate’ for these reasons. However, just because the Neutral is inclusive to all lengths, doesn’t mean the Fast and Slow lengths are irrelevant. The Fast and Slow length inputs may be useful for seeing how specifically zoned lengths may fair, and likewise when they cross over and/or under the Neutral ‘Optimal Length’.
This Indicator features the ability to display multiple different types of Traditional Indicators within the ‘Display Type’.
We will go over all of the different ‘Display Types’ with examples on how using a Fast, Slow and Neutral length would impact it:
Simple Moving Average:
In this example above have the Fast, Slow and Neutral Optimal Length formatted as a Slow Moving Average. The first example is on the 15 minute Time Frame and the second is on the 1 Day Time Frame, demonstrating how the length changes based on the Time Frame and the effects it may have.
Here we can see that by inputting ‘Optimal Lengths’ as a Simple Moving Average we may see moving averages that change over time with their ‘Optimal Lengths’. These lengths may help identify Support and/or Resistance locations. By using an 'Optimal Length' rather than a static length, we may create a Moving Average which may be more accurate as it attempts to be adaptive to current Market Conditions.
Bollinger Bands:
Bollinger Bands are a way to see a Simple Moving Average (SMA) that then uses Standard Deviation to identify how much deviation has occurred. This Deviation is then Added and Subtracted from the SMA to create the Bollinger Bands which help Identify possible movement zones that are ‘within range’. This may mean that the price may face Support / Resistance when it reaches the Outer / Inner bounds of the Bollinger Bands. Likewise, it may mean the Price is ‘Overbought’ when outside and above or ‘Underbought’ when outside and below the Bollinger Bands.
By applying All 3 different types of Optimal Lengths towards a Traditional Bollinger Band calculation we may hope to see different ranges of Bollinger Bands and how different lookback lengths may imply possible movement ranges on both a Short Term, Long Term and Neutral perspective. By seeing these possible ranges you may have the ability to identify more levels of Support and Resistance over different lengths and Trading Styles.
Donchian Channels:
Above you’ll see two examples of Machine Learning: Optimal Length applied to Donchian Channels. These are displayed with both the 15 Minute Time Frame and the 1 Day Time Frame.
Donchian Channels are a way of seeing potential Support and Resistance within a given lookback length. They are a way of withholding the High’s and Low’s of a specific lookback length and looking for deviation within this length. By applying a Fast, Slow and Neutral Machine Learning: Optimal Length to these Donchian Channels way may hope to achieve a viable range of High’s and Low’s that one may use to Identify Support and Resistance locations for different ranges of Optimal Lengths and likewise potentially different Trading Strategies.
Envelopes / Envelopes Adjusted:
Envelopes are an interesting one in the sense that they both may be perceived as useful; however we deem that with the use of an ‘Optimal Length’ that the ‘Envelopes Adjusted’ may work best. We will start with examples of the Traditional Envelope then showcase the Adjusted version.
Envelopes:
As you may see, a Traditional form of Envelopes even produced with a Machine Learning: Optimal Length may not produce optimal results. Unfortunately this may occur with some Traditional Indicators and they may need some adjustments as you’ll notice with the ‘Envelopes Adjusted’ version. However, even without the adjustments, these Envelopes may be useful for seeing ‘Overbought’ and ‘Oversold’ locations within a Machine Learning: Optimal Length standpoint.
Envelopes Adjusted:
By adding an adjustment to these Envelopes, we may hope to better reflect our Optimal Length within it. This is caused by adding a ratio reflection towards the current length of the Optimal Length and the max Length used. This allows for the Fast and Neutral (and potentially Slow if Neutral is greater) to achieve a potentially more accurate result.
Envelopes, much like Bollinger Bands are a way of seeing potential movement zones along with potential Support and Resistance. However, unlike Bollinger Bands which are based on Standard Deviation, Envelopes are based on percentages +/- from the Simple Moving Average.
We will conclude our Tutorial here. Hopefully this has given you some insight into how useful adding a ‘Optimal Length’ within an external (secondary) Indicator as a Source within the Settings may be. Likewise, how useful it may be for automation sake in the sense that when the ‘Optimal Length’ changes, it doesn’t rely on an alert where you need to manually update it yourself; instead it will update Automatically and you may reap the benefits of such with little manual input needed (aside from the initial setup).
If you have any questions, comments, ideas or concerns please don't hesitate to contact us.
HAPPY TRADING!

Donchian Trend SignalsThe Donchian Trend Signals is an indicator developed to help traders identify the current trend direction and potential liquidity grabs.
The usage of the indicator is very simple, on the chart you'll see a modified version of the classic and popular Donchian channel, calculated using the closing prices, that changes the color of the average middle line to indicate the direction of the current trend. The indicator also colors the candlestick.
Using the option "Complex Mode" will give your indicator additional data by changing the calculation method. These changes make the lines become the average between different lengths of the same Donchian channel formula.
Additionally, the indicator plots on the chart some buy or sell signals, displayed as diamonds above or below the candles. The signals are calculated to find potential liquidity grabs using the wicks, the true range of the candles, and the volume compared to his average value.

[KVA]Donchian Channel Percentage" The 'Donchian Channel Percentage ' (DC%) indicator, developed for TradingView’s Pine Script Version 5, is a unique tool designed to measure the current price’s position within the Donchian Channel. The Donchian Channel, a popular indicator in technical analysis, is defined by the highest high and the lowest low over a user-specified period.
Key Features :
User-Defined Period: Users can customize the lookback period (default 20 periods), allowing flexibility in different trading styles and timeframes.
Channel Calculation: The upper and lower bounds of the Donchian Channel are calculated based on the highest high and lowest low over the chosen period.
Percentage Calculation: DC% quantifies where the current price lies within the channel, presented as a percentage. A value of 0% indicates the price at the channel's low, and 100% signifies the price at the high.
Visualization: The DC% is plotted as a line graph, providing a clear visual representation of the price’s relative position. The indicator includes horizontal lines at 0% and 100%, marked in red and green, respectively, to depict the channel's boundaries.
Market Analysis Tool: DC% offers insights into market trends and potential overbought or oversold conditions, making it a valuable addition for traders who focus on channel-based strategies.
Applications :
The DC% is particularly useful for identifying breakout scenarios and potential reversals.
Traders can use this tool in conjunction with other indicators to enhance their market analysis, especially in strategies that capitalize on price extremes within a defined range.
In summary, the Donchian Channel Percentage offers traders a simple yet powerful tool to gauge the current price’s position within a historical high-low range. Its adaptability across various assets and timeframes makes it a versatile addition to any technical trader’s toolkit."

Machine Learning: Donchian DCA Grid Strategy [YinYangAlgorithms]This strategy uses a Machine Learning approach on the Donchian Channels with a DCA and Grid purchase/sell Strategy. Not only that, but it uses a custom Bollinger calculation to determine its Basis which is used as a mild sell location. This strategy is a pure DCA strategy in the sense that no shorts are used and theoretically it can be used in webhooks on most exchanges as it’s only using Spot Orders. The idea behind this strategy is we utilize both the Highest Highs and Lowest Lows within a Machine Learning standpoint to create Buy and Sell zones. We then fraction these zones off into pieces to create Grids. This allows us to ‘micro’ purchase as it enters these zones and likewise ‘micro’ sell as it goes up into the upper (sell) zones.
You have the option to set how many grids are used, by default we use 100 with max 1000. These grids can be ‘stacked’ together if a single bar is to go through multiple at the same time. For instance, if a bar goes through 30 grids in one bar, it will have a buy/sell power of 30x. Stacking Grid Buy and (sometimes) Sells is a very crucial part of this strategy that allows it to purchase multitudes during crashes and capitalize on sales during massive pumps.
With the grids, you’ll notice there is a middle line within the upper and lower part that makes the grid. As a Purchase Type within our Settings this is identified as ‘Middle of Zone Purchase Amount In USDT’. The middle of the grid may act as the strongest grid location (aside from maybe the bottom). Therefore there is a specific purchase amount for this Grid location.
This DCA Strategy also features two other purchase methods. Most importantly is its ‘Purchase More’ type. Essentially it will attempt to purchase when the Highest High or Lowest Low moves outside of the Outer band. For instance, the Lowest Low becomes Lower or the Higher High becomes Higher. When this happens may be a good time to buy as it is featuring a new High or Low over an extended period.
The last but not least Purchase type within this Strategy is what we call a ‘Strong Buy’. The reason for this is its verified by the following:
The outer bounds have been pushed (what causes a ‘Purchase More’)
The Price has crossed over the EMA 21
It has been verified through MACD, RSI or MACD Historical (Delta) using Regular and Hidden Divergence (Note, only 1 of these verifications is required and it can be any).
By default we don’t have Purchase Amount for ‘Strong Buy’ set, but that doesn’t mean it can’t be viable, it simply means we have only seen a few pairs where it actually proved more profitable allocating money there rather than just increasing the purchase amount for ‘Purchase More’ or ‘Grids’.
Now that you understand where we BUY, we should discuss when we SELL.
This Strategy features 3 crucial sell locations, and we will discuss each individually as they are very important.
1. ‘Sell Some At’: Here there are 4 different options, by default its set to ‘Both’ but you can change it around if you want. Your options are:
‘Both’ - You will sell some at both locations. The amount sold is the % used at ‘Sell Some %’.
‘Basis Line’ - You will sell some when the price crosses over the Basis Line. The amount sold is the % used at ‘Sell Some %’.
‘Percent’ - You will sell some when the Close is >= X% between the Lower Inner and Upper Inner Zone.
‘None’ - This simply means don’t ever Sell Some.
2. Sell Grids. Sell Grids are exactly like purchase grids and feature the same amount of grids. You also have the ability to ‘Stack Grid Sells’, which basically means if a bar moves multiple grids, it will stack the amount % wise you will sell, rather than just selling the default amount. Sell Grids use a DCA logic but for selling, which we deem may help adjust risk/reward ratio for selling, especially if there is slow but consistent bullish movement. It causes these grids to constantly push up and therefore when the close is greater than them, accrue more profit.
3. Take Profit. Take profit occurs when the close first goes above the Take Profit location (Teal Line) and then Closes below it. When Take Profit occurs, ALL POSITIONS WILL BE SOLD. What may happen is the price enters the Sell Grid, doesn’t go all the way to the top ‘Exiting it’ and then crashes back down and closes below the Take Profit. Take Profit is a strong location which generally represents a strong profit location, and that a strong momentum has changed which may cause the price to revert back to the buy grid zone.
Keep in mind, if you have (by default) ‘Only Sell If Profit’ toggled, all sell locations will only create sell orders when it is profitable to do so. Just cause it may be a good time to sell, doesn’t mean based on your DCA it is. In our opinion, only selling when it is profitable to do so is a key part of the DCA purchase strategy.
You likewise have the ability to ‘Only Buy If Lower than DCA’, which is likewise by default. These two help keep the Yin and Yang by balancing each other out where you’re only purchasing and selling when it makes logical sense too, even if that involves ignoring a signal and waiting for a better opportunity.
Tutorial:
Like most of our Strategies, we try to capitalize on lower Time Frames, generally the 15 minutes so we may find optimal entry and exit locations while still maintaining a strong correlation to trend patterns.
First off, let’s discuss examples of how this Strategy works prior to applying Machine Learning (enabled by default).
In this example above we have disabled the showing of ‘Potential Buy and Sell Signals’ so as to declutter the example. In here you can see where actual trades had gone through for both buying and selling and get an idea of how the strategy works. We also have disabled Machine Learning for this example so you can see the hard lines created by the Donchian Channel. You can also see how the Basis line ‘white line’ may act as a good location to ‘Sell Some’ and that it moves quite irregularly compared to the Donchian Channel. This is due to the fact that it is based on two custom Bollinger Bands to create the basis line.
Here we zoomed out even further and moved back a bit to where there were dense clusters of buy and sell orders. Sometimes when the price is rather volatile you’ll see it ‘Ping Pong’ back and forth between the buy and sell zones quite quickly. This may be very good for your trades and profit as a whole, especially if ‘Only Buy If Lower Than DCA’ and ‘Only Sell If Profit’ are both enabled; as these toggles will ensure you are:
Always lowering your Average when buying
Always making profit when selling
By default 8% commission is added to the Strategy as well, to simulate the cost effects of if these trades were taking place on an actual exchange.
In this example we also turned on the visuals for our ‘Purchase More’ (orange line) and ‘Take Profit’ (teal line) locations. These are crucial locations. The Purchase More makes purchases when the bottom of the grid has been moved (may dictate strong price movement has occurred and may be potential for correction). Our Take Profit may help secure profit when a momentum change is happening and all of the Sell Grids weren’t able to be used.
In the example above we’ve enabled Buy and Sell Signals so that you can see where the Take Profit and Purchase More signals have occurred. The white circle demonstrates that not all of the Position Size was sold within the Sell Grids, and therefore it was ALL CLOSED when the price closed below the Take Profit Line (Teal).
Then, when the bottom of the Donchian Channel was pushed further down due to the close (within the yellow circle), a Purchase More Signal was triggered.
When the close keeps pushing the bottom of the Buy Grid lower, it can cause multiple Purchase More Signals to occur. This is normal and also a crucial part of this strategy to help lower your DCA. Please note, the Purchase More won’t trigger a Buy if the Close is greater than the DCA and you have ‘Only Purchase If Lower Than DCA’ activated.
By turning on Machine Learning (default settings) the Buy and Sell Grid Zones are smoothed out more. It may cause it to look quite a bit different. Machine Learning although it looks much worse, may help increase the profit this Strategy can produce. Previous results DO NOT mean future results, but in this example, prior to turning on Machine Learning it had produced 37% Profit in ~5 months and with Machine Learning activated it is now up to 57% Profit in ~5 months.
Machine Learning causes the Strategy to focus less on Grids and more on Purchase More when it comes to getting its entries. However, if you likewise attempt to focus on Purchase More within non Machine Learning, the locations are different and therefore the results may not be as profitable.
PLEASE NOTE:
By default this strategy uses 1,000,000 as its initial capital. The amount it purchases in its Settings is relevant to this Initial capital. Considering this is a DCA Strategy, we only want to ‘Micro’ Buy and ‘Micro’ Sell whenever conditions are met.
Therefore, if you increase the Initial Capital, you’ll likewise want to increase the Purchase Amounts within the Settings and Vice Versa. For instance, if you wish to set the Initial Capital to 10,000, you should likewise can the amounts in the Settings to 1% of what they are to account for this.
We may change the Purchase Amounts to be based on %’s in a later update if it is requested.
We will conclude this Tutorial here, hopefully you can see how a DCA Grid Purchase Model applied to Machine Learning Donchian Channels may be useful for making strategic purchases in low and high zones.
Settings:
Display Data:
Show Potential Buy Locations: These locations are where 'Potentially' orders can be placed. Placement of orders is dependant on if you have 'Only Buy If Lower Than DCA' toggled and the Price is lower than DCA. It also is effected by if you actually have any money left to purchase with; you can't buy if you have no money left!
Show Potential Sell Locations: These locations are where 'Potentially' orders will be sold. If 'Only Sell If Profit' is toggled, the sell will only happen if you'll make profit from it!
Show Grid Locations: Displaying won't affect your trades but it can be useful to see where trades will be placed, as well as which have gone through and which are left to be purchased. Max 100 Grids, but visuals will only be shown if its 20 or less.
Purchase Settings:
Only Buy if its lower than DCA: Generally speaking, we want to lower our Average, and therefore it makes sense to only buy when the close is lower than our current DCA and a Purchase Condition is met.
Compound Purchases: Compounding Purchases means reinvesting profit back into your trades right away. It drastically increases profits, but it also increases risk too. It will adjust your Purchase Amounts for the Purchase Type you have set at the same % rate of strategy initial_capital to the amounts you have set.
Adjust Purchase Amount Ratio to Maintain Risk level: By adjusting purchase levels we generally help maintain a safe risk level. Basically we generally want to reserve X amount of % for each purchase type being used and relocate money when there is too much in one type. This helps balance out purchase amounts and ensure the types selected have a correct ratio to ensure they can place the right amount of orders.
Stack Grid Buys: Stacking Buy Grids is when the Close crosses multiple Buy Grids within the same bar. Should we still only purchase the value of 1 Buy Grid OR stack the grid buys based on how many buy grids it went through.
Purchase Type: Where do you want to make Purchases? We recommend lowering your risk by combining All purchase types, but you may also customize your trading strategy however you wish.
Strong Buy Purchase Amount In USDT: How much do you want to purchase when the 'Strong Buy' signal appears? This signal only occurs after it has at least entered the Buy Zone and there have been other verifications saying it's now a good time to buy. Our Strong Buy Signal is a very strong indicator that a large price movement towards the Sell Zone will likely occur. It almost always results in it leaving the Buy Zone and usually will go to at least the White Basis line where you can 'Sell Some'.
Buy More Purchase Amount In USDT: How much should you purchase when the 'Purchase More' signal appears? This 'Purchase More' signal occurs when the lowest level of the Buy Zone moves lower. This is a great time to buy as you're buying the dip and generally there is a correction that will allow you to 'Sell Some' for some profit.
Amount of Grid Buy and Sells: How many Grid Purchases do you want to make? We recommend having it at the max of 10, as it will essentially get you a better Average Purchase Price, but you may adjust it to whatever you wish. This amount also only matters if your Purchase Type above incorporates Grid Purchases. Max 100 Grids, but visuals will only be shown if it's 20 or less.
Each Grid Purchase Amount In USDT: How much should you purchase after closing under a grid location? Keep in mind, if you have 10 grids and it goes through each, it will be this amount * 10. Grid purchasing is a great way to get a good entry, lower risk and also lower your average.
Middle Of Zone Purchase Amount In USDT: The Middle Of Zone is the strongest grid location within the Buy Zone. This is why we have a unique Purchase Amount for this Grid specifically. Please note you need to have 'Middle of Zone is a Grid' enabled for this Purchase Amount to be used.
Sell:
Only Sell if its Profit: There is a chance that during a dump, all your grid buys when through, and a few Purchase More Signals have appeared. You likely got a good entry. A Strong Buy may also appear before it starts to pump to the Sell Zone. The issue that may occur is your Average Purchase Price is greater than the 'Sell Some' price and/or the Grids in the Sell Zone and/or the Strong Sell Signal. When this happens, you can either take a loss and sell it, or you can hold on to it and wait for more purchase signals to therefore lower your average more so you can take profit at the next sell location. Please backtest this yourself within our YinYang Purchase Strategy on the pair and timeframe you are wanting to trade on. Please also note, that previous results will not always reflect future results. Please assess the risk yourself. Don't trade what you can't afford to lose. Sometimes it is better to strategically take a loss and continue on making profit than to stay in a bad trade for a long period of time.
Stack Grid Sells: Stacking Sell Grids is when the Close crosses multiple Sell Grids within the same bar. Should we still only sell the value of 1 Sell Grid OR stack the grid sells based on how many sell grids it went through.
Stop Loss Type: This is when the Close has pushed the Bottom of the Buy Grid More. Do we Stop Loss or Purchase More?? By default we recommend you stay true to the DCA part of this strategy by Purchasing More, but this is up to you.
Sell Some At: Where if selected should we 'Sell Some', this may be an important way to sell a little bit at a good time before the price may correct. Also, we don't want to sell too much incase it doesn't correct though, so its a 'Sell Some' location. Basis Line refers to our Moving Basis Line created from 2 Bollinger Bands and Percent refers to a Percent difference between the Lower Inner and Upper Inner bands.
Sell Some At Percent Amount: This refers to how much % between the Lower Inner and Upper Inner bands we should well at if we chose to 'Sell Some'.
Sell Some Min %: This refers to the Minimum amount between the Lower Inner band and Close that qualifies a 'Sell Some'. This acts as a failsafe so we don't 'Sell Some' for too little.
Sell % At Strong Sell Signal: How much do we sell at the 'Strong Sell' Signal? It may act as a strong location to sell, but likewise Grid Sells could be better.
Grid and Donchian Settings:
Donchian Channel Length: How far back are we looking back to determine our Donchian Channel.
Extra Outer Buy Width %: How much extra should we push the Outer Buy (Low) Width by?
Extra Inner Buy Width %: How much extra should we push the Inner Buy (Low) Width by?
Extra Inner Sell Width %: How much extra should we push the Inner Sell (High) Width by?
Extra Outer Sell Width %: How much extra should we push the Outer Sell (High) Width by?
Machine Learning:
Rationalized Source Type: Donchians usually use High/Low. What Source is our Rationalized Source using?
Machine Learning Type: Are we using a Simple ML Average, KNN Mean Average, KNN Exponential Average or None?
Machine Learning Length: How far back is our Machine Learning going to keep data for.
k-Nearest Neighbour (KNN) Length: How many k-Nearest Neighbours will we account for?
Fast ML Data Length: What is our Fast ML Length?? This is used with our Slow Length to create our KNN Distance.
Slow ML Data Length: What is our Slow ML Length?? This is used with our Fast Length to create our KNN Distance.
If you have any questions, comments, ideas or concerns please don't hesitate to contact us.
HAPPY TRADING!

[OKX Signal Bot] Indicator Script Set Up TemplateDiscover the power of the Turtle Trade Channels Indicator (TUTCI), an innovative tool that integrates the time-tested principles of the legendary Turtle Trade system. This groundbreaking system shattered the belief that successful traders are born, not made, by transforming ordinary individuals into profitable traders.
The Turtle Trade Experiment, which achieved a remarkable 80% annual return over four years and amassed a staggering $150 million, showcased the immense potential of this trend-following strategy. Unlike the conventional "buy low and sell high" approach, the Turtle Trade system embraces a different philosophy—one of capturing substantial profits by following prevailing trends.
At the heart of the Turtle Trade Channels Indicator lies the concept of Donchian Channels, a powerful technical indicator developed by Richard Donchian. Building upon this foundation, the main rule of TUTCI is to identify 20-day breakouts and capitalize on them, while simultaneously utilizing a profit-taking strategy based on breaching 10-day highs or lows.
For long trades, the indicator signals a buying opportunity when the price breaks above the 20-day high. Conversely, for short trades, a selling opportunity arises when the price falls below the 20-day low. This systematic approach allows traders to align themselves with the prevailing momentum, capturing significant price movements.
To further enhance trading precision, TUTCI incorporates two key lines. The red line represents the trading line, indicating the direction of the trend. Price bars above the trend line suggest an uptrend, while those below indicate a downtrend. The dotted blue line serves as the exit line, guiding traders to close their positions when price action breaches the 10-day high or low. This rule safeguards profits and helps traders avoid potential trend reversals.
The Turtle Trade Channels Indicator (TUTCI) is a versatile tool applicable to various financial markets, including stocks, commodities, and forex. By harnessing the power of breakouts and integrating profit-taking rules, this indicator empowers traders to capitalize on favorable trading opportunities while managing risk effectively.
As with any trading strategy, it is crucial to conduct thorough backtesting and evaluation of the TUTCI system before implementing it in live trading. Traders can customize the indicator's parameters to align with their trading preferences and adapt to changing market conditions. Employing sound risk management techniques, such as position sizing and stop-loss orders, is paramount to protect capital and minimize potential losses.
Experience the transformational potential of the Turtle Trade Channels Indicator (TUTCI) and embark on a journey of trend following, capturing significant profits, and achieving trading success.
These scripts are only functioning as sample script templates to support okx alert standards. It is not intended to provide any investment, tax, or legal advice, nor should it be considered an offer to purchase, sell, hold or offer any services relating to digital assets. Digital assets, including stablecoins, involve a high degree of risk, can fluctuate greatly, and can even become worthless. You should carefully consider whether trading or holding digital assets is suitable for you in light of your financial condition and risk tolerance. OKX does not provide investment or asset recommendations. You are solely responsible for your investment decisions, and OKX is not responsible for any potential losses. Past performance is not indicative of future results. Please consult your legal/tax/investment professional for questions about your specific circumstances.

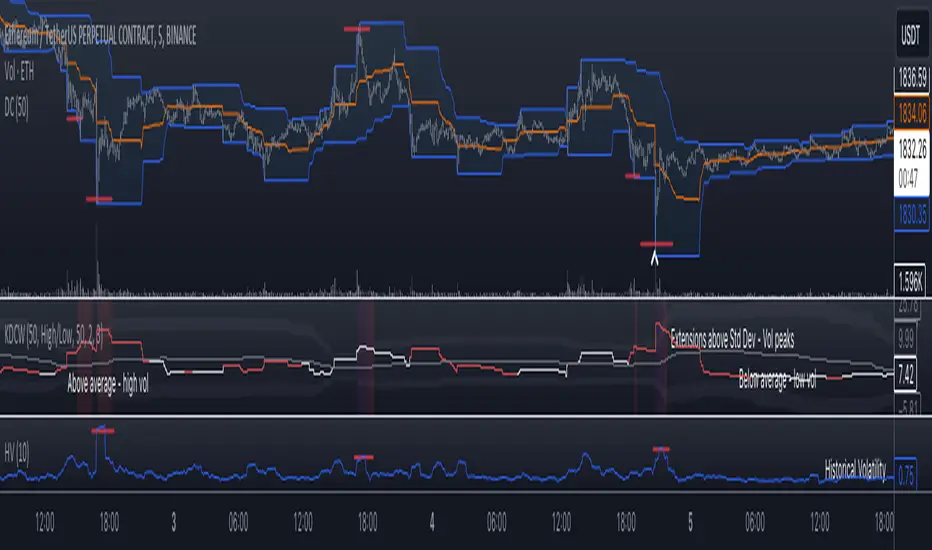
Koalafied Donchian Channel WidthDonchian Channel Width indicator with average channel width value and Standard Deviations shown.
Experimental gauge of volatility. Channel Width greater than average over lookback period shows higher levels of volatility, whereas channel width below average is correlated to low historical volatility. Extensions of width over user selected standard deviations show peaks in volatility.
Unique as average channel width is taken from array of value changes updating only when prior high/lows are breached instead of bar by bar like similar indicators.
Size of array (lookback) is user adjustable.
Sublime Trading | Donchian Breakout SignalsWhat kind of traders/investors are we?
We are trend followers. Our scripts are designed to be used on the higher timeframes (weekly/daily) to catch the large moves/trends in the market.
Most have heard of long-term trend following. Few know how to execute the strategy.
Our scripts are designed specifically to identify and invest in long-term market trends.
What does this script do?
It produces entry signals in a confirmed bull and bear trend.
The logic is based on Donchian 20, which serves the following two purposes:
1. Confirms end-of-day entry points in a long-term trend
2. Filters out entry points in a sideways market
The signal is produced on a break and close of the Donchian 20 high in a bull trend and a break and close of the Donchian 20 low in a bear trend.
How is the entry price produced?
The entry is based on a percentage value of the range of the breakout bar added to the high of the bar in a bull trend.
In a bear trend, the percentage is subtracted from the low of the bar.
This gives an objective entry when placing a position once the OHLC of a bar is confirmed at the end of the trading day.
How is the stoploss price produced?
The script uses the formula ATR 15 x 4.
We use ATR as it produces a stoploss which is unique to the volatility of the asset. The more volatile the asset, the wider the stoploss.
We use ATR 15 as it brings an average reading across half a month, incorporating days of extreme volatility.
The multiplier 4 works well to avoid positions being stopped out prematurely on pullbacks.
When the stoploss is hit, there is when traders and investors may consider exiting positions.
What is the best timeframe to use the script?
We recommend the daily timeframe as this is where trader and investors identify and enter long-term market trends.
The higher timeframes are where traders and investors take fewer positions but hold for longer time periods.
As a result, trend followers place priority on the quality of the entry rather than quantity.
What makes this script unique?
This script has been coded specifically for the daily timeframe to:
Highlight the start of a potential long-term trends.
Confirm entry points at the end of the trading day, absorbing intraday noise.
Reduce fake breakouts in a trend.
Continue to create entry points as the trend develops to allow for compounding.
Filter out breakouts in a sideways market.
This entry signal script helps traders and investors focus on the quality of a potential position when investing in long-term market trends.

TASC 2023.08 Channeling Your Inner Chartist█ OVERVIEW
TASC's August 2023 edition of Traders' Tips features an article written by Stella Osoba titled “Using Price Channels.” The article offers a basic look at using price channels, with a primary focus on Donchian channels . Following the article, the script provides an example of how to calculate and utilize the Donchian channel to gain insights into the price behavior and potential trend movements.
█ CONCEPTS
The use of price channels is a long-standing and fundamental charting technique commonly associated with trend-following trading strategies. Price channels help identify the trend on the chart and facilitate trading in its direction. The Donchian channel, in particular, consists of three lines. The upper line is conventionally calculated as the highest high over a specified lookback period, while the lower line is defined as the lowest low over the same period. The central line represents the midpoint between the upper and lower lines.
The Donchian channel provides a simple and intuitive visual representation of price behavior. Breaking through the lower line, for instance, can indicate weakness and selling pressure, while breaking through the upper line can signal buying pressure. By observing these breakout points, one can gain insight into potential beginnings or endings of long-term trends. However, it is important to note that breakouts often lead to price reversals, so they should be carefully evaluated
█ CALCULATIONS
To illustrate a simple Donchian trading system, this script calculates and plots the channel lines, as well as potential entry points for long positions (green triangles) and short positions (red triangles).

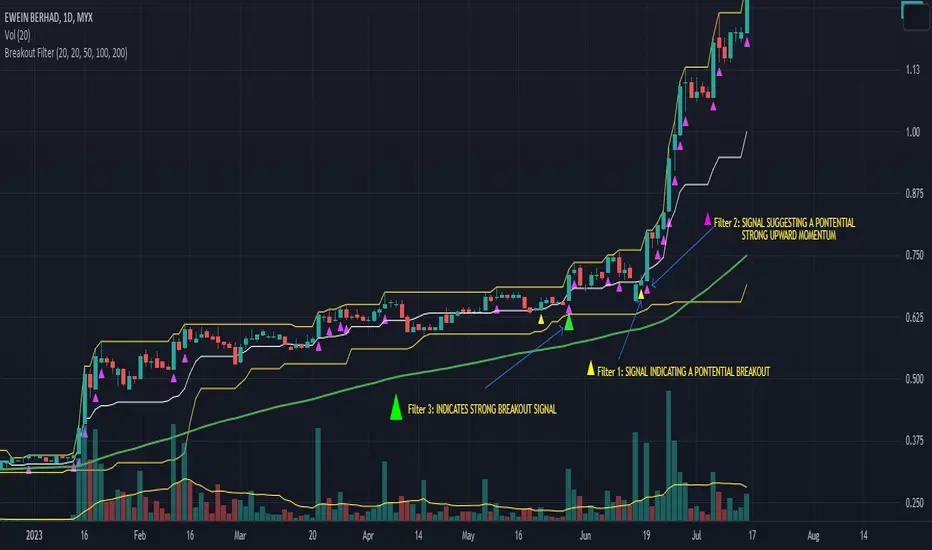
Breakout FilterIntroduction:
The Breakout Filter is a technical analysis indicator designed to identify potential breakout trading opportunities in the financial markets. It combines breakout conditions based on price and volume with the visualization of Exponential Moving Average (EMA) lines. This indicator can be a valuable tool for traders seeking to capture breakout movements while utilizing EMA lines for additional trend analysis.
Indicator Overview:
The Breakout Filter consists of three main filters: Filter 1, Filter 2, and Filter 3. Each filter has its own set of conditions that need to be met for a breakout signal to be generated. Additionally, the indicator plots EMA lines on the chart to provide further insights into the market trend.
Filter 1: Price & Volume Breakout (Default symbol: Tiny Yellow Triangle)
Filter 1 focuses on identifying breakouts based on both price and volume criteria. It considers the following conditions:
- Price Breakout: The close price crosses above the Donchian Channel's middle line, indicating a potential upward breakout.
- Volume Breakout: The trading volume exceeds the moving average of volume, suggesting increased market participation during the breakout.
When both the price breakout and volume breakout conditions are met, Filter 1 generates a signal indicating a potential breakout in the market. This filter helps traders identify significant price movements accompanied by higher trading volumes.
Filter 2: Upper Band Breakout
Filter 2 specifically looks for breakouts above the upper band of the Donchian Channel. This condition suggests a potential strong upward momentum in the market. When the high price exceeds the upper band, Filter 2 generates a signal, indicating a breakout above the recent price range.
Filter 3: Combined Filter 1 and Filter 2
Filter 3 combines the conditions of both Filter 1 and Filter 2. It requires that both Filter 1 and Filter 2 generate signals simultaneously. When this happens, it indicates a strong breakout signal with price and volume confirming the upward momentum.
EMA Lines:
The Breakout Filter with EMA Lines also includes the visualization of Exponential Moving Average (EMA) lines on the chart. EMA is a popular technical indicator used to identify the overall trend in the market. The indicator plots three EMA lines with different periods: EMA1, EMA2, and EMA3. Traders can choose the periods for each EMA line based on their preference and trading strategy.
The EMA lines can provide additional insights into the market trend and potential support or resistance levels. By observing the interaction between the price and the EMA lines, traders can gain a better understanding of the prevailing market sentiment and make informed trading decisions.
How to screen these filters using Trading View Screener
Insert column "DONCHIAN20 UP" and set to "EQUAL HIGH"
Conclusion:
The Breakout Filter with EMA Lines is a comprehensive indicator that combines breakout conditions based on price and volume with the visualization of EMA lines. It helps traders identify potential breakout trading opportunities while providing insights into the market trend. By using this indicator, traders can enhance their trading strategies and potentially improve their trading outcomes.
Please note that this write-up is for informational purposes only and should not be considered as financial advice. Traders should conduct their own analysis and exercise caution when making trading decisions.
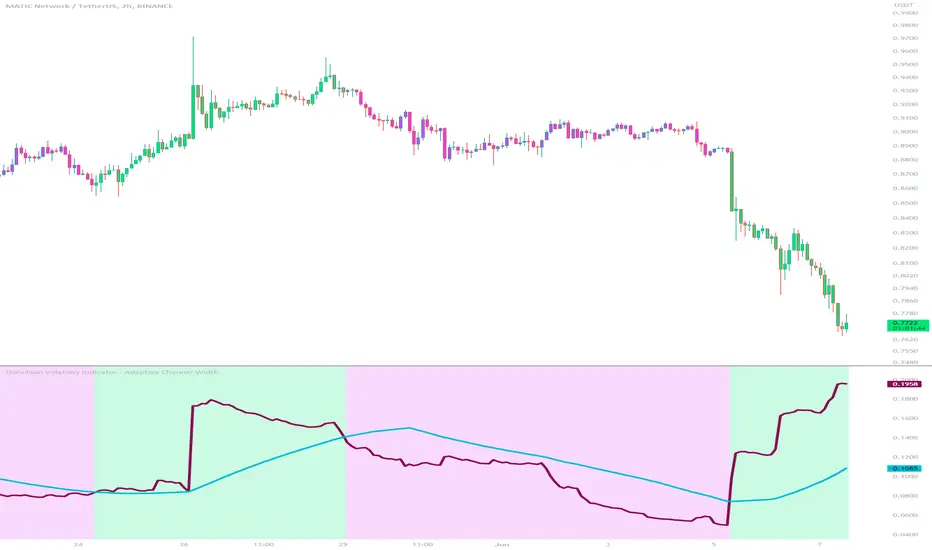
Donchian Volatility Indicator - Adaptive Channel WidthThis indicator is designed to help traders assess and analyze market volatility. By calculating the width of the Donchian channels, it provides valuable insights into the range of price movements over a specified period. This indicator helps traders identify periods of high and low volatility, enabling them to make more informed trading decisions.
The indicator is based on the concept of Donchian channels, which consist of the highest high and lowest low over a specified lookback period. The channel width is calculated as the difference between the upper and lower channels. A wider channel indicates higher volatility, suggesting potentially larger price movements and increased trading opportunities. On the other hand, a narrower channel suggests lower volatility, indicating a relatively calmer market environment with potentially fewer trading opportunities.
The adaptive aspect of the indicator refers to its ability to adjust the width of the channels dynamically based on market conditions. The indicator calculates the width of the channels using the Average True Range (ATR) indicator, which measures the average range of price movements over a specified period. By multiplying the ATR value with the user-defined ATR multiplier, the indicator adapts the width of the channels to reflect the current level of volatility. During periods of higher volatility, the channels expand to accommodate larger price movements, providing a broader range for assessing volatility. Conversely, during periods of lower volatility, the channels contract, reflecting the narrower price ranges and signaling a decrease in volatility. This adaptive nature allows traders to have a flexible and responsive measure of volatility, ensuring that the indicator reflects the current market conditions accurately.
To provide further insights, the indicator includes a signal line. The signal line is derived from the channel width and is calculated as a simple moving average over a specified signal period. This signal line acts as a reference level, allowing traders to compare the current channel width with the average width over a given time frame. By assessing whether the current channel width is above or below the signal line, traders can gain additional context on the volatility level in the market.
The colors used in the Donchian Volatility Indicator - Adaptive Channel Width play a vital role in visualizing the volatility levels:
-- Lime Color : When the channel width is above the signal line, it is colored lime. This color signifies that volatility has entered the market, indicating potentially higher price movements and increased trading opportunities. Traders can pay closer attention to the lime-colored channel width as it may suggest favorable conditions for trend-following or breakout trading strategies.
-- Fuchsia Color : When the channel width is below the signal line, it is colored fuchsia. This color represents relatively low volatility, suggesting a calmer market environment with potentially fewer trading opportunities. Traders may consider adjusting their strategies during periods of low volatility, such as employing range-bound or mean-reversion strategies.
-- Aqua Color : The signal line is represented by the aqua color. This color allows traders to easily identify the signal line amidst the channel width. The aqua color provides a visual reference for the average channel width and helps traders assess whether the current width is above or below this average.
The Donchian Volatility Indicator - Adaptive Channel Width has several practical applications for traders:
-- Volatility Assessment : Traders can use this indicator to assess the level of volatility in the market. By observing the width of the Donchian channels and comparing it to the signal line, they can determine whether the current volatility is relatively high or low. This information helps traders set appropriate expectations and adjust their trading strategies accordingly.
-- Breakout Trading : Wide channel widths may indicate an increased likelihood of price breakouts. Traders can use the Donchian Volatility Indicator - Adaptive Channel Width to identify potential breakout opportunities. When the channel width exceeds the signal line, it suggests a higher probability of significant price movements, potentially signaling a breakout. Traders may consider entering trades in the direction of the breakout.
-- Risk Management : The indicator can assist in setting appropriate stop-loss levels based on the current volatility. During periods of high volatility (lime-colored channel width), wider stop-loss orders may be warranted to account for larger price swings. Conversely, during periods of low volatility (fuchsia-colored channel width), narrower stop-loss orders may be appropriate to limit risk in a more range-bound market.
While the Donchian Volatility Indicator - Adaptive Channel Width is a valuable tool, it is important to consider its limitations:
-- Lagging Indicator : The indicator relies on historical price data, making it a lagging indicator. It provides insights based on past price movements and may not capture sudden changes or shifts in volatility. Traders should be aware that the indicator may not generate real-time signals and should be used in conjunction with other indicators and analysis tools.
-- False Signals : Like any technical indicator, the Donchian Volatility Indicator - Adaptive Channel Width is not immune to generating false signals. Traders should exercise caution and use additional analysis to confirm the signals generated by the indicator. Considering the broader market context and employing risk management techniques can help mitigate the impact of false signals.
-- Market Conditions : Market conditions can vary, and volatility levels can differ across different assets and timeframes. Traders should adapt their strategies and consider other market factors when interpreting the signals provided by the indicator. It is crucial to avoid relying solely on the indicator and to incorporate a comprehensive analysis of the market environment.
In conclusion, this indicator is a powerful tool for assessing market volatility. By examining the width of the Donchian channels and comparing it to the signal line, traders can gain insights into the level of volatility and adjust their trading strategies accordingly. The color-coded representation of the channel width and signal line allows for easy visualization and interpretation of the volatility dynamics. Traders should utilize this indicator as part of a broader trading approach, incorporating other technical analysis tools and considering market conditions for a comprehensive assessment of market volatility.
Donchian Channels [Gu5]█ OVERVIEW
I changed the design of the classic indicator "Donchian Channels", for easy reading.
█ CONCEPTS
Donchian Channels is an indicator made up of upper and lower bands around a mid-band or Basis.
The upper band marks the highest price of a security for N periods, while the lower band marks the lowest price of a security for N periods. The area between the upper and lower bands.
In this version, when there are new Higher High (HH), the trend is Bullish and the channel is painted green.
When there are new Lower Low (LL), the trend is Bearish and the channel is painted Red
█ OTHER SECTIONS
A plus in this script: When there are no new highs or new lows, there is no certain trend
The channel is painted yellow
www.tradingview.com
• HOW TO USE
Menu "Display"
• '■ Basis On/Off': Shows the midline Basis
• '■ Alert On/Off': Shows alerts labels
• '■ Fill On/Off': Paint the entire channel the color of the trend
• '■ Bar Color On/Off': Paint the candle the color of the trend
• '■ Close Alert On/Off': Shows alerts end of trend
• NOTES:
This code was written using the recommendations from the Pine Script™ User Manual's Style Guide
• RAMBLINGS:
You can use the "Basis" line as Trailing Stop.
• THANKS:
Donchian Channels developed by Richard Donchian
and many MANY thanks to @PineCoders

Turtle tradingA minimal breakout trend following indicator (Turtle trading). Entry is on the break of a Donchian channel and exit is on the reversal at a shorter-term Donchian channel (trailing stop).
Entry levels are hidden in an active trend, and only the active exit level is shown. Levels and entry/exit markers can be shown or hidden independently.

Donchian Channel Smoothed (Linear Regression)The script is an implementation of the Donchian Channel Smoothed indicator using linear regression to smooth the data. The indicator plots three curves: the middle curve, which represents the average of the upper and lower curves, and the upper and lower curves, which are the standard Donchian channels.
The smoothing is done using linear regression on the highest and lowest of the given period. This helps filter out the noise in the data and provides a smoother curve that can help traders identify trends and key levels of support and resistance. The advantages of using linear regression for smoothing are reduced data volatility, better identification of long-term trends, and improved ability to identify support and resistance levels.
Using this indicator, traders can identify potential entry and exit points in a trend, as well as key support and resistance levels. Donchian channels are also useful for measuring asset volatility and determining trading range boundaries.
In summary, using linear regression to smooth the data in the Donchian Channel Smoothed indicator presents significant advantages for traders, such as reduced data volatility and better identification of long-term trends. This allows traders to more easily identify support and resistance levels and make more informed trading decisions.

OBV-MACDThe OBV-MACD indicator is a momentum-based technical analysis tool that helps traders identify trend reversals and trend strength. This Pine script is an implementation of the OBV-MACD indicator that uses the On-Balance Volume (OBV) and Moving Average Convergence Divergence (MACD) indicators to provide a momentum data of OBV.
The OBV-MACD indicator uses the OBV to calculate the cumulative volume, which is then smoothed using two moving averages - fast and slow. The difference between these moving averages is plotted as a histogram, with a signal line plotted over it. A buy signal is generated when the histogram crosses above the signal line, indicating a bullish trend, while a sell signal is generated when the histogram crosses below the signal line, indicating a bearish trend.
This Pine script also includes an OBV-MACD-Donchian version that incorporates Donchian channels for the OBV-MACD. The Donchian channel is a technical analysis indicator that helps traders identify the highs and lows of an asset's price over a certain period. The OBV-MACD-Donchian version uses the OBV-MACD indicator along with the Donchian channels to provide signals that the momentum of OBV is making new high/low during that period of time.
Traders can customize the input parameters of the OBV-MACD indicator, such as the timeframe, method of calculation for the moving averages, and the lengths of the moving averages and breakout lengths. The colors of the plot can also be customized to suit the trader's preferences.

Reversal PointsHi , in this script i tried to find reversal points on big trends. For this purpose i have used Supertrend and Donchian channels. I combined both in a single indicator for finding reversal points. I am suggesting for using higher time frames like 4 hours or 1 day. It will be work in lower time frames too. But the signals will be less reliable than higher timeframes. Here is settings in this script:
New low sensitiity : this setting for donchian channels lookback. Bigger value result as less signals.
Atr Period: Period for Atr , it is for supertrend indicator in it.
Source: Source for supertrend indicator.
Atr Multiplier : Atr multiplier setting for Supertrend. Bigger value will be result as less signals.
Good luck.
Enes.

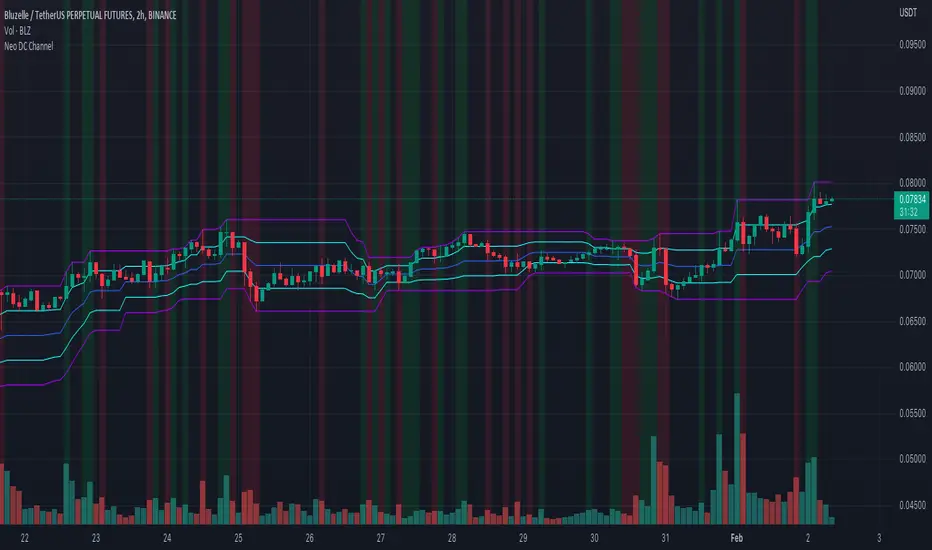
Neo DC ChannelWhat is Neo DC Channel
Neo DC Channel is using the concept of Donchian Channels but add some more functions in other to represent more data.
Donchian Channels are three lines generated by moving average calculations that comprise an indicator formed by upper and lower bands around a midrange or median band. The upper band marks the highest price of a security over N periods while the lower band marks the lowest price of a security over N periods.
The Background color will bedisplay when the bar range is more than x% of the Upper – Lower’s Donchian Channels width and the bar is cross up/down the middle line.
Green Background will display when bar is crossing up the middle line
Red Background will display when bar is crossing down the middle line
What made Neo DC Channel?
- Donchian Channels
- MA Concept
- Percentage of bar due to the Donchian Channels’s Channels width
Use of Neo DC Channel
- can be use as the confirmation indicator if trader apply the indicator to any trading strategy which already have trend identifier Indicator.
- can also be use as trend changer/switcher indicator.
Bull Trend Filtered StochRSI (BTFS)Ride Bull Trends Via Stochastic with Special Rules for Heavy Bullish Bias
TLDR: Long Only Trend Indicator Where you are always entered Long if the stochastic is over the lower band line and the price is above the Donchian Chanel high. Exit when Stochastic RSI is below the lower band.
Indicators:
Filter = Trend/Bullish indicator is Donchian of ema(high) this is set as the highest ema(high, 6) in the last 30 candles. this can be adjusted to fit the market as desired.
**indicator prints green background when the filter condition is satisfied***
Entry Exit = enter when the Stoch RSI is above the given lower trend band. This value is set at 35 but can be adjusted according to risk tolerance and market conditions.
Logic:
this indicator allows a trader to be present during bullish/parabolic trends by only triggering if the close is > than the highest 6 candle average high over the last 30 candles. This filter requires the market to be in a generally bullish posture. If the market is in this condition the stochastic RSI indicator value offers a good gauge of price action and only goes significantly down if price trends below the average range of the rsi period. This filters out noise and keeps a trader from over trading on inconsequential corrections while responding fairly quickly to changes in general trend direction. the response is fast enough to produce an unprofitable amount of false signals if the bull market filter is not implemented. However when used in combination the signals return desirable results in bull trending markets.
Hope this Helps. Happy Trades.
-Snarky Puppy

Channel Based Zigzag [HeWhoMustNotBeNamed]🎲 Concept
Zigzag is built based on the price and number of offset bars. But, in this experiment, we build zigzag based on different bands such as Bollinger Band, Keltner Channel and Donchian Channel. The process is simple:
🎯 Derive bands based on input parameters
🎯 High of a bar is considered as pivot high only if the high price is above or equal to upper band.
🎯 Similarly low of a bar is considered as pivot low only if low price is below or equal to lower band.
🎯 Adding the pivot high/low follows same logic as that of regular zigzag where pivot high is always followed by pivot low and vice versa.
🎯 If the new pivot added is of same direction as that of last pivot, then both pivots are compared with each other and only the extreme one is kept. (Highest in case of pivot high and lowest in case of pivot low)
🎯 If a bar has both pivot high and pivot low - pivot with same direction as previous pivot is added to the list first before adding the pivot with opposite direction.
🎲 Use Cases
Can be used for pattern recognition algorithms instead of standard zigzag. This will help derive patterns which are relative to bands and channels.
Example: John Bollinger explains how to manually scan double tap using Bollinger Bands in this video: www.youtube.com This modified zigzag base can be used to achieve the same using algorithmic means.
🎲 Settings
Few simple configurations which will let you select the band properties. Notice that there is no zigzag length here. All the calculations depend on the bands.
With bands display, indicator looks something like this
Note that pivots do not always represent highest/lowest prices. They represent highest/lowest price relative to bands.
As mentioned many times, application of zigzag is not for buying at lower price and selling at higher price. It is mainly used for pattern recognition either manually or via algorithms. Lets build new Harmonic, Chart patterns, Trend Lines using the new zigzag?

DonchianFib[Akcay]How does it work?
- The indicator detects the highest and lowest price level in the last x periods every time prices advance by x periods.
- From these values, retracement (0.618, 0.786) and expansion levels (1.272, 1.618, 2, 2.618, 3.14, 3.618, 4.236) are obtained.
- Since the symmetrical counterpart of the retracement levels is used, there are two of each of the 0.618 and 0.786 lines, for a total of four.
How can it be used?
- It can be used for step buying.
- It can be used for step selling.
- Can be used to set a profit target.
- Can be used to set a stop target.
- This indicator can be used in the same way as Pivot levels can be used. You can think of this indicator like the Pivot Points Standard indicator, where you set the period more flexibly.
Which indicators can it be combined with?
- I don't think there are any limitations, but I think it is compatible with trend detection indicators, trend detection with DonchianFib, and stepped buy/sell with limit orders.
- If you want to enter a position with mismatch signals, you can wait for the DonchianFib levels to break.
- Its use is limited by your imagination :)
Where does the name come from?
- As the name suggests, Donchian Channels. I was inspired by Donchian Channels when developing the indicator. Donchian channels show the highs and lows of prices over the last x number of periods. DonchianFib does this once for every x periods and uses the fibonacci levels to create upper and intermediate levels.
Note : I don't know if such an indicator has been done before or not. If it has been done, I haven't seen it in tradingview.
Çalışma mantığı nedir ?
- Gösterge, fiyatlar her x periyot kadar ilerlediğinde son x periyot içerisindeki en yüksek ve en düşük fiyat seviyesini tespit eder.
- Bu değerler üzerinden geri çekilme (0.618, 0.786) ve genişleme seviyeleri (1.272, 1.618, 2, 2.618, 3.14, 3.618, 4.236) elde edilir.
- Geri çekilme seviyelerinin simetrik karşılığı kullanıldığından 0.618 ve 0.786 çizgilerinden her birinden iki adet olmak üzere toplamda dört adet bulunur.
Nasıl kullanılabilir ?
- Kademeli alım yapmak için kullanılabilir.
- Kademeli satım yapmak için kullanılabilir.
- Kâr hedefi belirlemek için kullanılabilir.
- Stop hedefi belirlemek için kullanılabilir.
- Pivot seviyelerinden nasıl faydalanılıyorsa bu göstergeden de aynı şekilde faydalanılabilir. Bu göstergeyi, periyodunu kendinizin daha esnek bir şekilde belirlediğiniz Pivot Noktalar Standartı göstergesi gibi düşünebilirsiniz.
Hangi göstergelerle kombine edilebilir ?
- Bunun için herhangi sınırlama yapmak doğru değil ancak trend tespit etmeye çalışan göstergelerle uyumlu olduğunu düşünüyorum. Bu göstergeler ile trend tespiti yapıp DonchianFib ile alım/satım yerleri belirlenebilir ve limit emirleri ile kademeli alım/satım yapılabilir.
- Uyuşmazlık sinyalleri ile pozisyona girilmek isteniliyorsa DonchianFib seviyelerinin kırılması beklenebilir.
- Kullanımı sizin hayal gücünüz ile sınırlıdır :)
Adı nereden geliyor ?
- Adından da anlaşılacağı üzere Donchian Kanallarından. Göstergeyi geliştirirken Donchian Kanallarından ilham aldım. Donchian kanalları fiyatların son x periyot içerisindeki en yüksek ve en düşük seviyelerini grafikte gösteriyor. DonchianFib ise bunu her x periyot için bir defa yapıp, fibonacci seviyelerini de kullanarak üst ve ara seviyeler oluşturuyor.
Not : Daha önce böyle bir göstergenin yapılıp yapılmadığını bilmiyorum. Yapıldı ise ben tradingview'da görmedim.
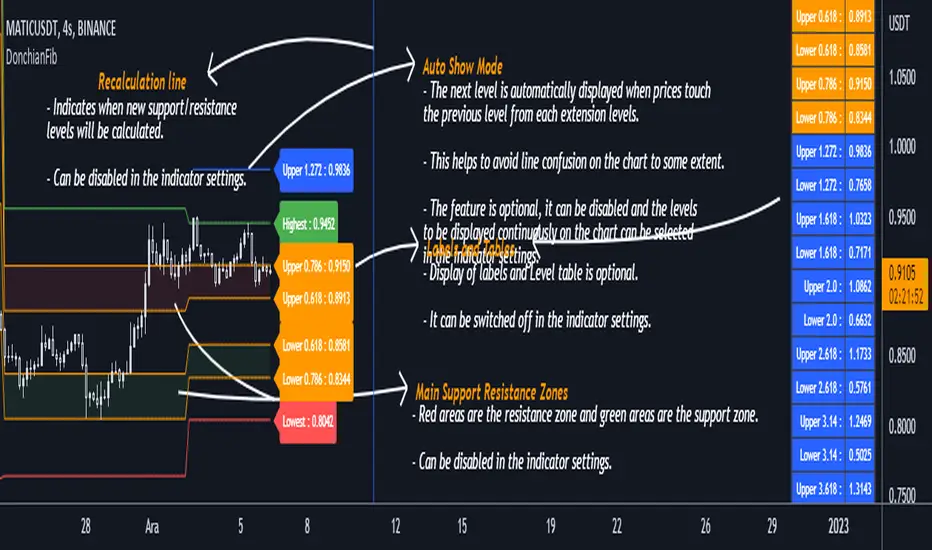
Enhanced ShareGenius Swing TradingSwing Trading Strategy Features:
1. Point out candles where days low price matched 20 day low price (Blue Triangle with Yellow Bar)
2. Hollow Body candles depict days when days close is within the threshold of 20 day high (defaulted to 5%). An indication to start GTT buy orders.
3. Point out candles when GTT buy order was triggered (Light Green body)
Experimental:
1. Using tolerance to low price matching logic (instead of exact match)
As a result if the days low is within the tolerance, such candles will be highlighted with light blue triangle and yellow body

Donchian Trendline - Support Resistance Slope [UhoKang]// This is a strategy that draws a trend line in the form of a slope whenever the high point and low point are updated.
// The upper slope serves as a resistance line, and the lower slope serves as a support line.
// Buy when the of the candle crosses the slope
