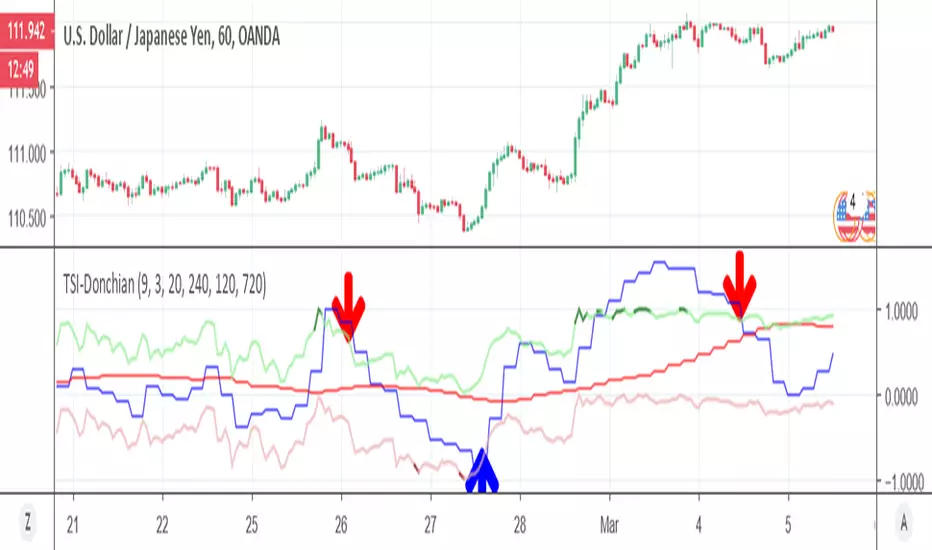
TSI-DonchianHere it a TSI with MTF function , together with Donchian high and low channel
the best entry and exit are shown in arrow
Donchian Kanalları (DC)
Donchian ATR ChannelThis uses a Donchian center line and adds an ATR multiple to generate a channel.

TAD System TURTLE - NKThe TURTLE indicator came from the popular and famous Turtle Trading by Richard Donchian.
However the TURTLE indicator is to be used alongside with the ATOM & DUCK indicators.
As with all 3 indicators used alongside will become the TAD Trading System.
As it is straight forward, a BUY or SELL signal is determined when all 3 arrows of the indicators are aligned together.

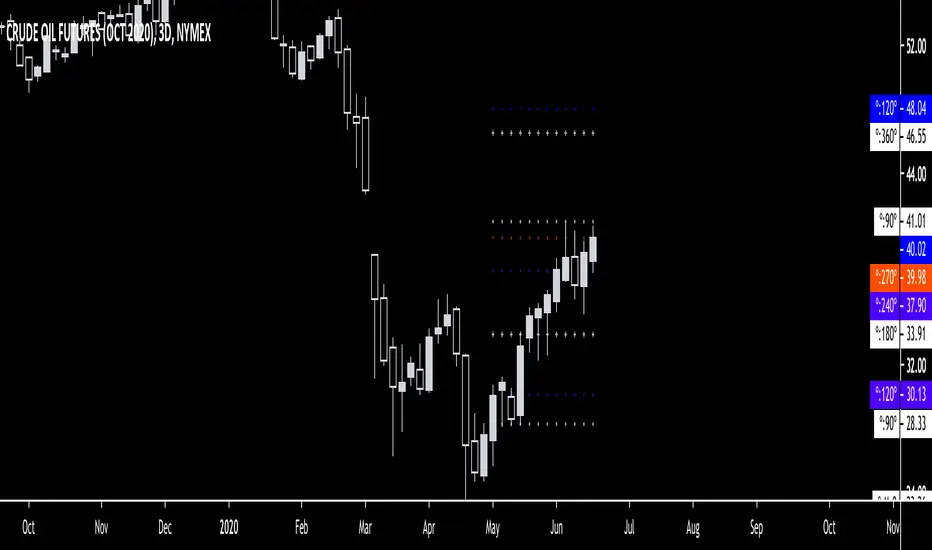
Gann Square Of 9 LevelsThis script uses the last hlc3 value of 1H, 4H, D and/or W and rotates it 360º up/down with four increments of 90º to find out potential support and resistance areas. Can be used as a dynamic support & resistance tool or just to gauge how overbought/oversold the market is. Special thanks to @Nv56 for his assistance in writing this script.
EASY SYSTEMSo how to use this very easy system
we have two system the first is based on ATR resistance and support and the other based on % channel based on donchian channel
The black line is the price line
The red lines are % line of the donchian channel (here it set to 2 and 3 % (you can set it any number you want ) this lines are the low end
Theblue d lines are % line of the donchian channel (here it set to 2 and 3 % (you can set it any number you want ),this lines are upper end
you look at the resistance and the support of the ATR and on the % channel
lets say you decide to go long -best if it in lower end of your % channel you can either set alert if price crossup the lower % line that you set
and you can make take profit if it reach the target level by % of the line of your choice
oposite you do in shorting
using the build in alert in TV you can make your trade more easy setting the target in more logical way

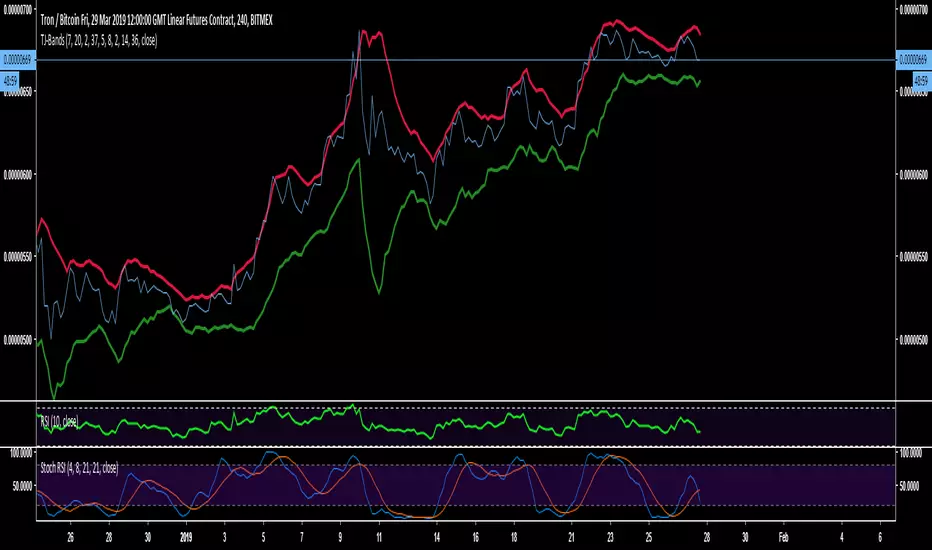
TJ-BandsDo you want to know
This indicator is a modified form of Bollinger Bands.
It works in a similar way like BB does. If you take a look at the "line" chart, you will clearly see, that a close outside these bands is very unlikely and works very well as a rejection line for the chart.
Since, the chart is likely to get rejected at the bands those have been indicated red at the top and green at the bottom.
The use is very simple, add it to your chart and there is nothing more to modify or change.
Like and Follow me and you will find this page interesting because I am a TA expert and professional day trader in crypto since 2012 that does daily updates and new posts about the hottest and most discussed coins.
Cheers, TJ
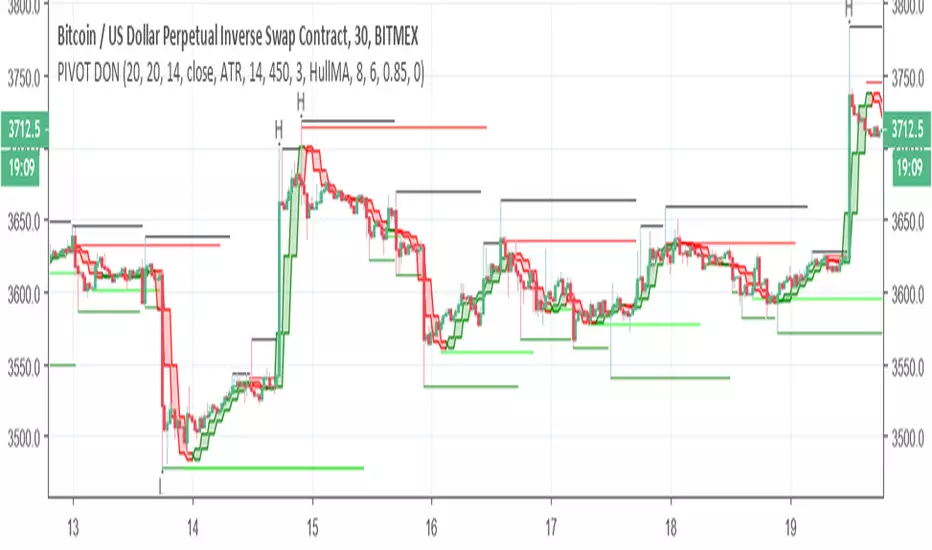
PIVOT DONThis indicator is great to detect resistance and support
The H and L are based on new high and low formed by Donchian cahnnel , the lines of support and resistance are based on pivot system
by the TF you can control the time length of the donchian channel
no alert to this system
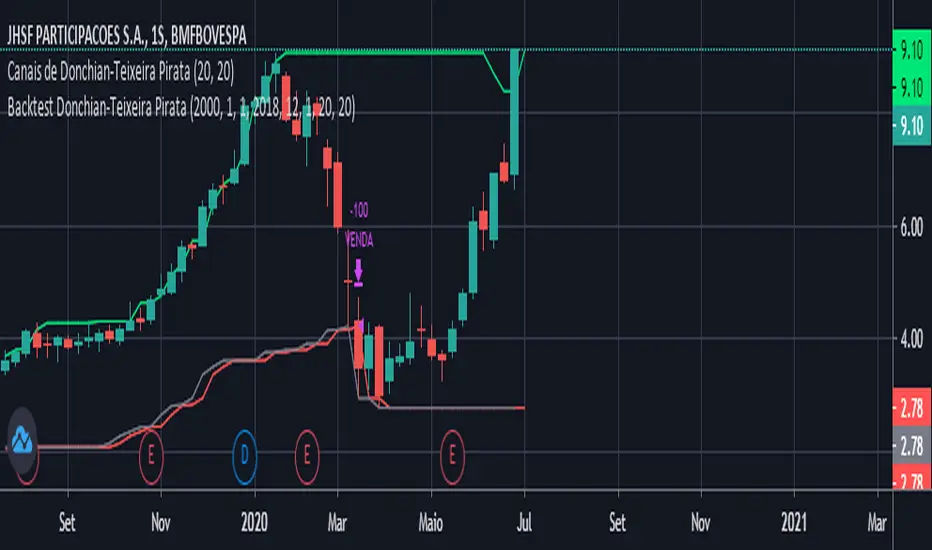
Don ratioUsing the ratio of donchian channel from early script we can calculate factor Z which is the estimate of the high ratio and the low ratio
crossing it with +100 and -100 we can produce the signals with addition on non repaint donchian ratio channel
inside the script one can take profit for both long and short , buy again and sell again with stop loss if needed
by the same logic we can calculate factor to z to any channel we want once we create the correct ratio to it

Donochian CCISo this indicator have the following:
1. MTF CCI
2. donochian channel MTF both non repaint mode
buliish and bearish zone determine by ratio of the the donochian cahnnel
enter or exit can be either the bullish or bearish change of color or by cross over or under of the CCI
or combination of both
The high max and low max of the donochian channel show in hilated bar

Donochian zonesThis indicator give the ratio between the high and low of donochian channel and if we take ratio and add it to each other then we can calculate if it + meaning bullish trend or negative meaning bearish trend
using non repainting MTF we can see the zone of the channel at different time set
we can use this indicator to filter bad signal or make it stand alone
here example of amazon stock with 360 min mtf over one hour graph
here facebook 240min over 15 min graph

Trend Follower With Help of Donchian Channels - TFWHDCThis is a simple Day Trade indicator, but can be used for swing and long term trades.
It is based on Donchian Channels to detect trend and point out resistance or support breakouts using arrows.
The bars ared colored when a breakout occurs. When a resistance breakout occurs the current and the next bars are colored green (default) and when a support breakout occurs the current and the next bars are colored red (default). This way this indicator can show if its an uptrend or a downtrend.
I hope this indicator will be useful for many traders!
Thank you!

SuperRadu Trade Assistant v0.2The script uses higher and lower swings to generate the resistance(red) and support (green) also the orange color represents the crossunder midline.
It will generate a new sell or buy entry suggestion when the price reject the resistance or the support and the median line it will confirm the trend direction between low high swings in this way you are able to make a better decisions and to place stop or take profits on a real targets.

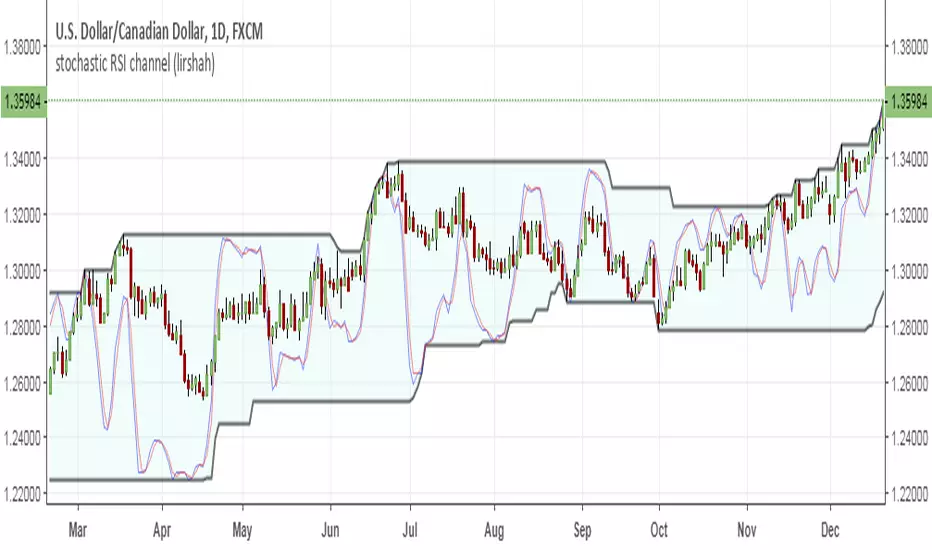
stochastic RSI channel (lirshah) this indicator plots stochastic RSI inside donchian channel.
0% stochastic rsi is coinciding with lower band while 100% stochastic rsi is matched on upper band
River StyxRiver Styx - Modified Donchian Channel with separate adjustments for upper and lower levels, with offset
Blue line = the highest price of the last 14 periods (resistance).
Red line = the lowest price of the last 14 periods (support).
Gray line = middle line between blue and red line.
Green line = exponential moving average of 2 periods of closing price.

Enhanced Donchian Channel OverlayThis is my first public release of an indicator, free for all to use. There will be a multitude of indicators significantly more complex in the future, still under testing. It's simple purpose is to track highest high in red and lowest low in lime over a specified period of 5 preceding bars by default. The upper and lower banding have independent adjustable period settings. The banding line widths are also adjustable. A smoothable mean line is displayed in olive color and may be disabled by altering the line width to zero. I also included a yellow close line capability disabled by default by it's line width. I presume most people use candles but an occasional few may wish to see a close line plot too. Please provide any feedback/requests as you wish.

makemoneyThis system design for you in order to make you money :) I hope...
1. the donochian channel is based on color of high and low price (easy to see where the bars exist)
2. resitance and support are drawn by bolinger system (black and red dots)
3. buy and sell are based on volume model (B and S ) with alerts
4. when PSAR and the buy or sell are in agrreement this are called strong buy or sell points shown in green and red trinangle
5. you can use stop loss or take profit based on system in volume model
using the system very easy and I hope you make noney on it either shorting or longing
I normaly use 1 hour and 30 min charts . you can try another time frames if it work to you
the code is open so you can modify , chane or do what ever you want with it

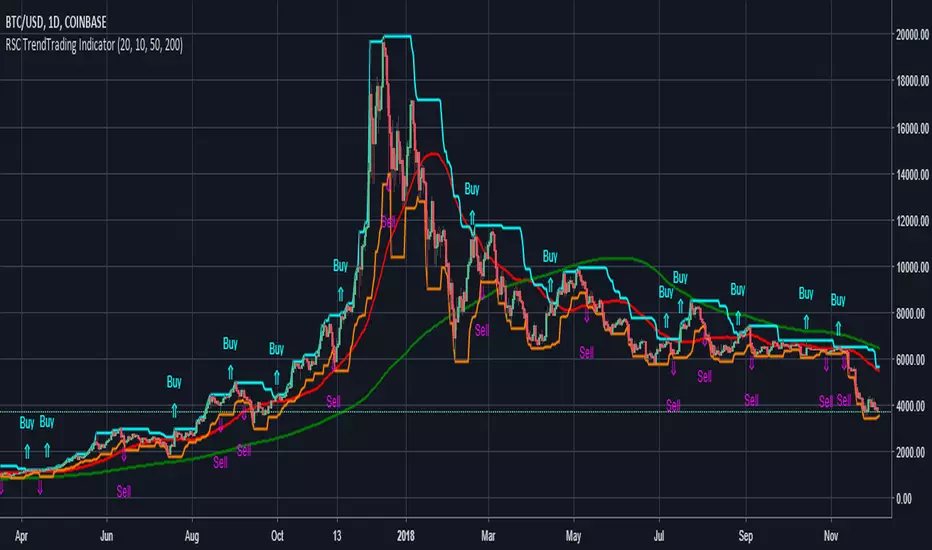
RSC TrendTrading Indicator 1.0RSC TrendTrading Indicator 1.0
This is a combined indicator for those who are familiar with the Short-Term Trading Strategies Class offered at Ready Set Crypto .
This indicator combines 4 indicators as one indicator (assuming you are looking the daily chart):
A Donchian Channel of 20 days (default) or more, used of buy signals
A Donchian Channel of 10 days (default) or more, used of sell signals
A 50 day Simple Moving Average
A 200 day Simple Moving Average
Please like 👍🏻, Share 📣 and Comment 💬 if you like this indicator.
Soon, I will be releasing a strategy based on this to allow backtesting this strategy. It is going to be a very powerful tool. So follow me and message me if you are interested.
This indicator is based on Doc Severson's Trend Trading class at readysetcrypto.com and is published with permission.
I highly recommend that you attend the class to understand how this indicator can be used to your advantage. There is way more than just to the indicators to utilise this trading strategy successfully.
Warning
The Buy and Sell calls are meaningless and must not be auctioned without a thorough understanding of the trading strategy and the full consideration of the entry and exit conditions.
Please use this indicator at your own risk. The publisher does not accept any responsibility for its performance or any implications.
RSC TrendTrading Indicator 1.0RSC TrendTrading Indicator 1.0
This is a combined indicator for those who are familiar with the Short-Term Trading Strategies Class offered at Ready Set Crypto .
This indicator combines 4 indicators as one indicator (assuming you are looking the daily chart):
A Donchian Channel of 20 days (default) or more, used of buy signals
A Donchian Channel of 10 days (default) or more, used of sell signals
A 50 day Simple Moving Average
A 200 day Simple Moving Average
This indicator is based on Doc Severson's Trend Trading class at readysetcrypto.com and is published with permission.
I highly recommend that you attend the class to understand how this indicator can be used to your advantage. There is way more than just to the indicators to utilise this trading strategy successfully.
Warning
The Buy and Sell calls are meaningless and must not be auctioned without a thorough understanding of the trading strategy and the full consideration of the entry and exit conditions.
Please use this indicator at your own risk. The publisher does not accept any responsibility for its performance or any implications.

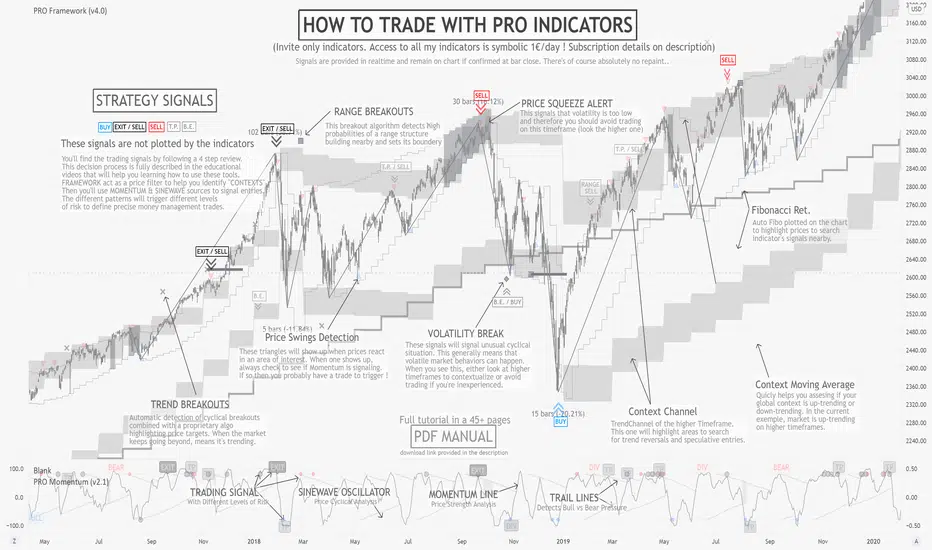
PRO FrameworkINVITE ONLY SCRIPT:
FEATURES:
As its name suggests, Framework is here to offer a non-subjective frame of reference to traders. Effectively filtering 90% of prices offering poor risk management opportunities. More importantly this is a multi-timeframe tool that will scan across three time frames all at once, offering a final synthesized rendering. Our goal was to provide a professional grade dynamic price analysis without bloating the chart with numerous plots. Nevertheless they are complex tools requiring extensive learning. To support students in their journey, there is a wide open online community of users in our Discord channel, providing peer-to-peer assistance to progress with the strategy as well as tutored courses.
OUTPUTS:
To share a brief description of the indicators functioning, we will scroll through the major set of outputs that are presented to the user. Please note that the indicator is meant to assist from Junior to Senior expertise, to achieve this we have set different base templates right into the indicators. To keep this description simple, we will present the outputs you’ll see with the beginner setup:
Context Channel: composed of two “ribbons” one above the price and one below. It represents the dynamic zones of supply and demand, where prices are likely to find support and resistance for the given chart timeframe. They are representing complex algorithmic versions of channels evolving over time, while adapting to both ranges and trend conditions. Allowing to visualize the current price channel which the price is trading within, but also review the history of past dynamics. Ultimately, studying both the recent and past context behavior tells us everything we need about the price structure.
Average Price: Corresponding to a simple 20 period moving average synchronized with the context channel reference timeframe. Looking at the channel’s position relative to this average will help us define the “context” of the market, thereby filtering the patterns we will be able to apply to this chart (range, trend, volatility).
Breakout Targets: represented by small plots on the chart (cross, square, diamond) they inform the trader that the market is attempting to move in a particular direction. Given the predetermined context in which that pattern triggers, this will help us in managing the risk.
Price Confirmations: corresponding to the small triangle plots on the chart, they are automatically calculated to determine areas where other traders might have taken actions. These triangles aren’t a trading signal per say, they will be the trigger for our trades with the PRO Strategy, but only when patterns are active (meaning we are in the right context, and have enough risk limitation elements to justify entry).
Auto-Fibonacci: As most of our patterns include certain retracement rules, we decided to include a built-in fibonacci plotting tool. The outputs will automatically update with new prices, allowing users to use it as a trigger for the TradingView alerts system.
Automated Context Detection: the actual real Intellectual property and added value of PRO Indicators resides in our semi-automated system, based on the complex algorithmic detection of potentially favorable contexts to apply the strategy on. This also means that you can set alerts, and let the cloud monitor the market and be notified when the conditions are deemed viable. As you progress to more Senior contexts and adjust the indicators’ template setup, more complex alerts will be detected.
GENERAL STRATEGY:
Overall, the PRO Strategy combines two “core” indicators, Framework and Momentum. Framework is plotted on the main chart section as an overlay, it is definitely the most important as it guides the user through the hard process of filtering prices and timeframes that are suitable for technical analysis. On the other hand, PRO Momentum is on a separate oscillator tab under the chart section, it will study the momentum and cyclical structure, also offering automated pattern detection. Ultimately, our strategy is based on collecting and processing non-subjective rules, emanating from the indicators outputs. Essentially, this means that the indicator actually takes care of producing all the necessary binary outputs, leaving you with the remaining task of combining them correctly following the strategy’s patterns.
RISK LIMITATION:
Even if we provide semi-automated detection of viable contexts, there is no “one-click” or "easy-win” solution, the user still needs to carefully review the elements. When applicable pattern rules are confirmed, the user will gather risk-limitation information (breakout targets, price confirmations, momentum and cyclical coordination) and decide whether or not to trade according to its own risk profile. If so, the position sizing, stop-loss positioning, risk management and profit targets will all be defined according to the same indicator’s outputs. This effectively suppresses most behavioral and personal biases the trader could introduce, creating a stable and statistical risk management structure aiming for a durable profitability.
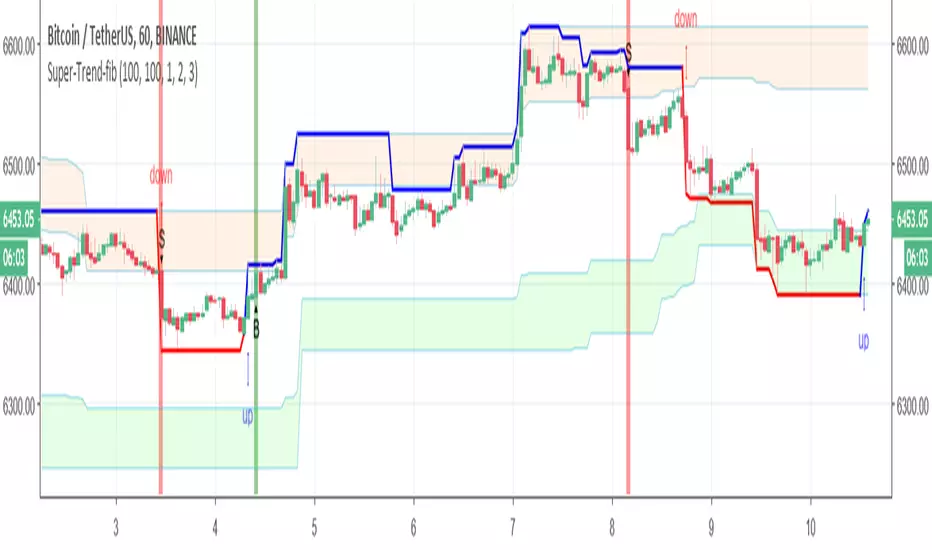
Super-Trend-fibIn this model we have fib Donchian channel with super trend alerts (B=buy) S =sell
and trailing volume system up trend alert and down trend alert
so have fun
4 MAs | OHLC4 MAs(3 Exponential Moving Averages, 1 Simple Moving Average) with OHLC(Open,High,Low,Close)
Exponential Moving Averages (EMA) 8, 62 & 200 (default values)
Simple Moving Average (SMA) 18 (default value)
Values can be amended based on your trading strategy.
