Crypto HODLCrypto indicator for the longterm traders. Getting good low entries and with the right stragety highly profitble.
Emtia Kanal Endeksi (CCI)


Woodies CCI + CZ + SW indicatorsBased on
Changes:
- red bars removed and replaced by silver ones
- yellow bar (start of new trend) had been added
- more parameters can be set in settings dialogue (SW constants as well)


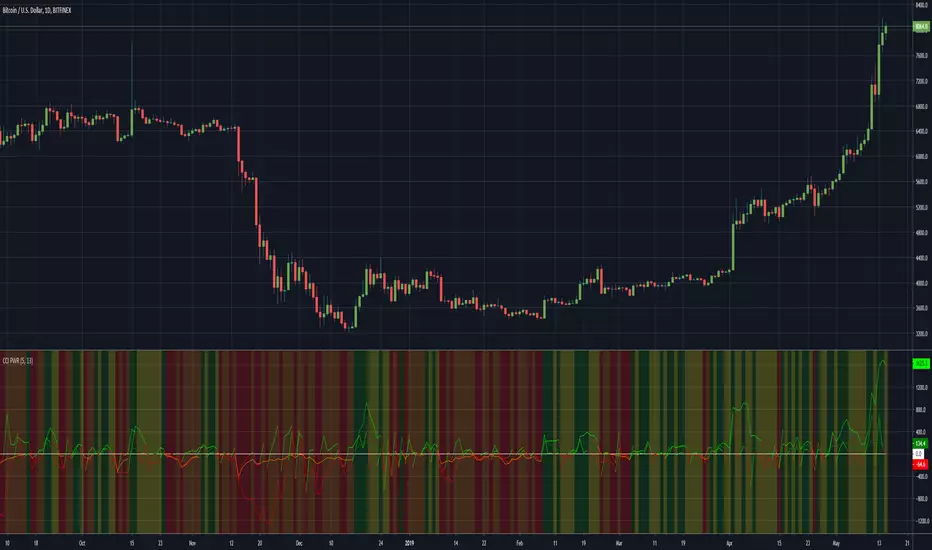
CCI PWRThis is a backtest for my CCI PWR indicator here . It works very well on a daily chart but may be useful for lower timeframes.
You can change the backtest settings to test different periods of time.
I have included a stop-loss function that will exit a trade if the price goes against the signals. The parameter is an integer that represents a %age of the current price, so for example, a value of 2 would mean a stoploss is set 2% below a long entry or 2% above a short entry.
Here is an image of ETH/BTC with the same settings.
Let me know if you find it useful!
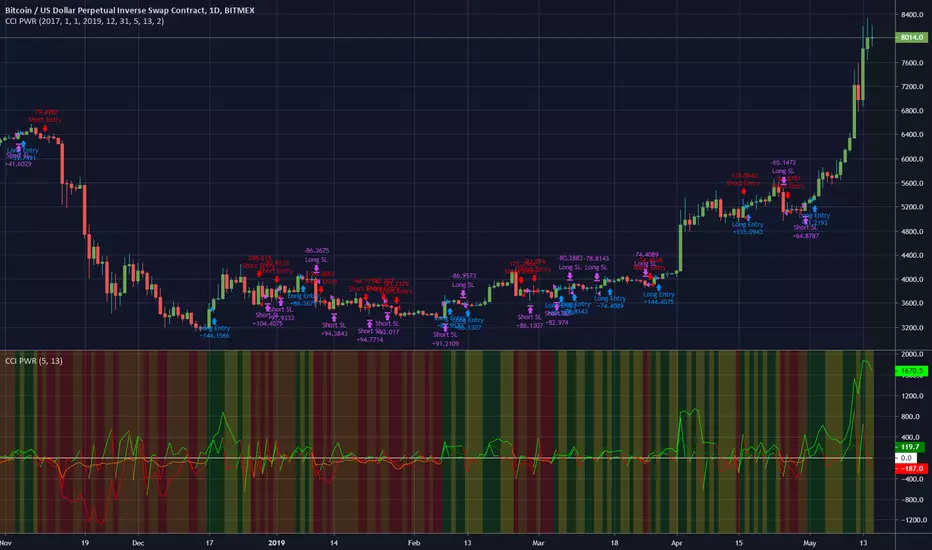
CCI PWRThis indicator is great for BTC/USD pairs and gives entry signals. I am just gauging interest at this point so message me if you like the indicator!
This is a leading indicator and gives signals early to get a good entry into long or short positions. It works best on a daily timeframe but can be useful on smaller timeframes too.
How to use:
If the background turns GREEN, this is a LONG SIGNAL
RED means SHORT SIGNAL
YELLOW means we should be LONG but there is no signal at this candle
ORANGE means we should be SHORT but there is no signal at this candle
You can adjust the Length or CCI length variables.

variousGoogle Translation------------------------------------------------------------------------------------------------------------------------------------------
Even if it does not display various indicators, it is possible to display seven indicators with this one.
From configuration script
You can select “Awesome Oscillator, CCI, MACD, Price Oscillator, RSI, Stochastics, WaveTrend, Moving Average Deviation Rate”.
And the point attached to the line becomes the high price and the bottom price.
If you check "upper & under" from the setting, the line will be pulled high.
I will increase if there is a demand.
日本語---------------------------------------------------------------------------------------------------------------------------------------------------------
様々なインジケータを表示させなくてもこれ一つで7つのインジケータを表示させることが出来ます。
設定のスクリプトから
「オーサムオシレータ、CCI、MACD、プライスオシレータ、RSI、ストキャスティクス、ウェーブトレンド、移動平均線乖離率」が選択できます。
そして、ラインについている点は高値、底値になります。
設定から「upper & under」をにチェックを入れると高値にラインをひきます。
要望があれば増やします。

RatTrend Multiple RSI Divergence MA Cross OscillatorThis Indicator based on RSI Divergence with Overbought and oversold signals.
All tops and bottoms calculated with Moving Average Crosses and combines with RSI signals.
Best working Timeframe is H4 on current settings, you can modify values to find best for you.
Current settings best for BTC trading.
At the beginning it can confuse you to understand but you will understand signal patterns.
Have fun.

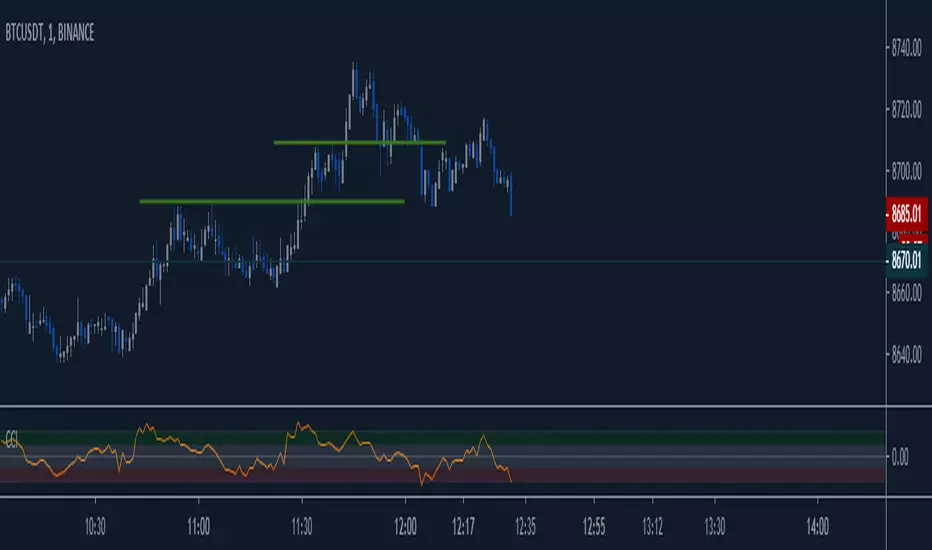
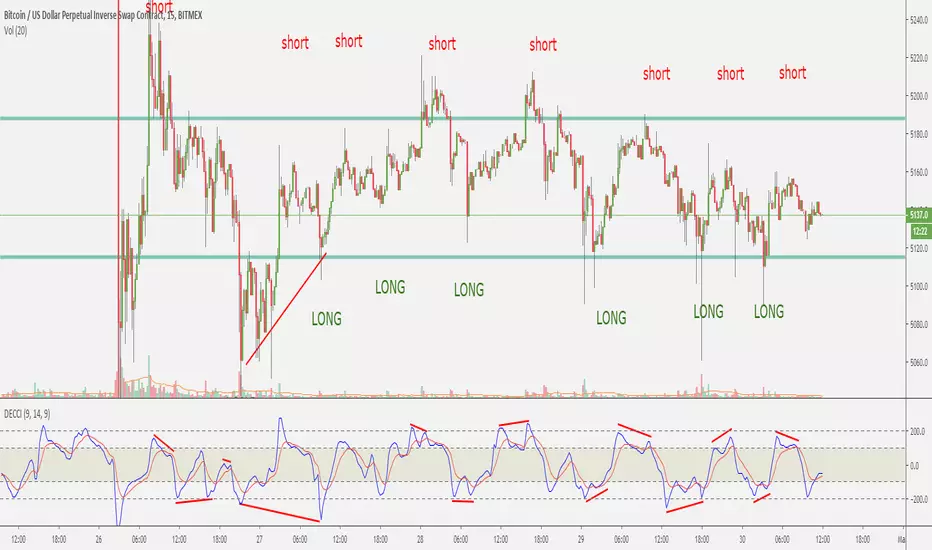
DOUBLE EMA CCI
This script is based on Commodity Channel Index and double EMA - one based on price, the second one based on CCI with some modifications and calculation method to reduce and filter wrong signals.
The script was made based my own researches and trade experience on cryptocurrency market.
Recommended timeframe is 15 minutes. But you can use it on bigger timeframes as well.
For 15 minute tf recommended configuration is 9-14-9.
How to use:
There are +-100 and +-200 levels, blue line - CCI , red line - EMA on CCI indicator.
1. Long/short signals are generated when CCI and EMA lines go down/up +-100 level, reverse and cross up/down +-100 level.
2. You may see on the chart that before crossing +-100 level, the indicator makes specific double tops/bottoms and small divergences.
Use it in combination with other indicators to make your entry more accurate.
Also you can use it with my other script - TRSI .
Use it carefully.
Will be glad to see your feedback.
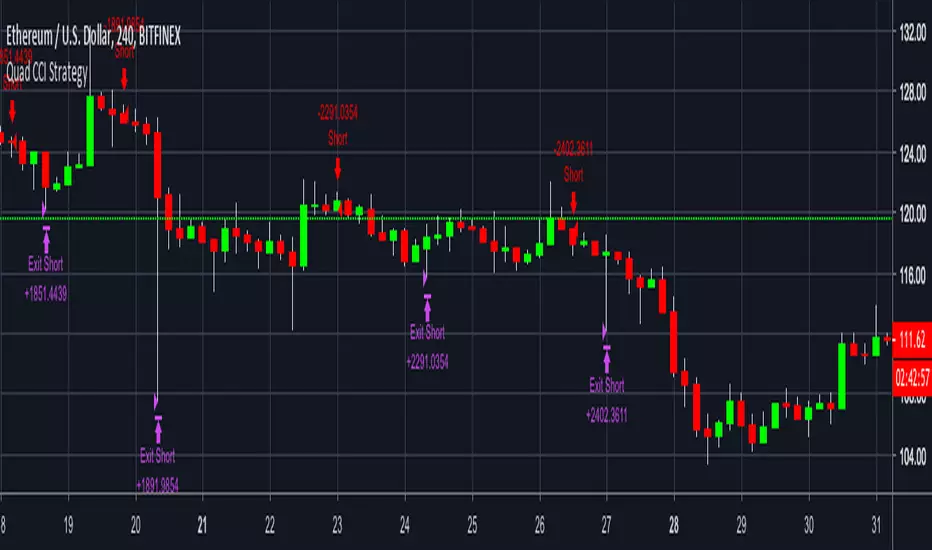
Quad Bollinger Bands CCI Splash by ZekisQuad Bollinger Bands CCI Splash combine four Bollinger Bands with modified standard deviations and some other calcs and CCI indicator.
It's working very well in trending market (obviously) with a very high win/loss ratio.
It's working in any time frame.
The long threshold should be opposed to the short one (ex.: Long T. 50 / Short T. -50), but it can be 0 for both.
Greater difference between thresholds means fewer trades.
There are standard entries for Longs and Shorts and reentries marked with RE.
Also there are exits correlated with standard entries only.
Enjoy!
@Zekis

Setup - Commodity Channel IndexSetup de Acordo com o cruzamento do 100 e -100 CCi = 100 periodos, podendo ser variado


BossHouse - CCI ExtendedBossHouse - CCI Extended ( An Extended version of the Original CCI ).
The commodity channel index (CCI) is an oscillator originally introduced by Donald Lambert in 1980.
Guideline
________
Lambert's trading guidelines for the CCI focused on movements above +100 and below −100 to generate buy and sell signals. Because about 70 to 80 percent of the CCI values are between +100 and −100, a buy or sell signal will be in force only 20 to 30 percent of the time. When the CCI moves above +100, a security is considered to be entering into a strong uptrend and a buy signal is given. The position should be closed when the CCI moves back below +100. When the CCI moves below −100, the security is considered to be in a strong downtrend and a sell signal is given. The position should be closed when the CCI moves back above −100.
Since Lambert's original guidelines, traders have also found the CCI valuable for identifying reversals. The CCI is a versatile indicator capable of producing a wide array of buy and sell signals.
CCI can be used to identify overbought and oversold levels. A security would be deemed oversold when the CCI dips below −100 and overbought when it exceeds +100. From oversold levels, a buy signal might be given when the CCI moves back above −100. From overbought levels, a sell signal might be given when the CCI moved back below +100.
As with most oscillators, divergences can also be applied to increase the robustness of signals. A positive divergence below −100 would increase the robustness of a signal based on a move back above −100. A negative divergence above +100 would increase the robustness of a signal based on a move back below +100.
Trend line breaks can be used to generate signals. Trend lines can be drawn connecting the peaks and troughs. From oversold levels, an advance above −100 and trend line breakout could be considered bullish. From overbought levels, a decline below +100 and a trend line break could be considered bearish.
Settings
_______
Show 0 line
Lenght
Source
Any help and suggestions will be appreciated.
Marcos Issler @ Isslerman
marcos@bosshouse.com.br

Commodity Channel IndexI was checking the formula of built-in " cci " function and decided to publish a more customizable version of the Commodity Channel Index, so you can play with levels and a bunch of different sources.
If someone doesn't know what is this:
This indicator was originally developed by Donald R. Lambert ( "Commodities" magazine, 1980) to identify cyclical or seasonal price patterns in commodities. Now it is applied not only to commodities but to market indices, stocks and Forex.
Good luck!

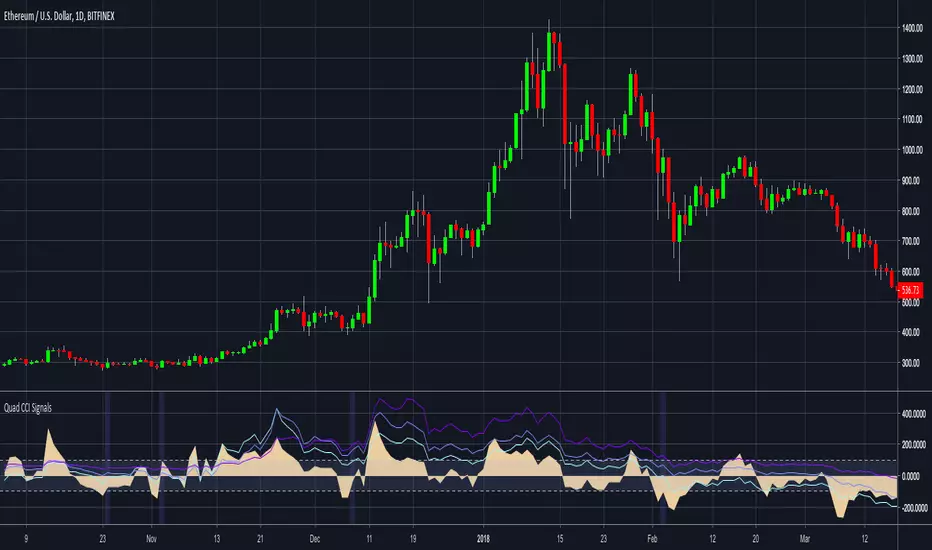
Quad Commodity Channel Index w/ RSI SignalThis indicator shows the Quad CCI indicator with RSI signals when RSI is over 70 or under 30.

ATR Oscillator [CP]This is an experimental script in which i have oscillated the ATR, which is configurable for all timeframes and lockable for the H1, H4 and Daily values.
Officially the ATR is calculated by using an EMA on the True Range over a certain period. I have added a lot of filters for experimenting.
NOTE: This is a test for me in oscillation and filtering of signals, for now that is it's purpose.
Description of the ATR as it is intended
To calculate the ATR, the True Range first needs to be discovered. True Range takes into account
the most current period high/low range as well as the previous period close if necessary.
There are three calculation which need to be completed and then compared against each other.
The True Range is the largest of the following:
The Current Period High minus (-) Current Period Low
The Absolute Value (abs) of the Current Period High minus (-) The Previous Period Close
The Absolute Value (abs) of the Current Period Low minus (-) The Previous Period Close
true range=max
*Absolute Value is used because the ATR does not measure price direction, only volatility.
Therefore there should be no negative numbers.
*Once you have the True Range, the Average True Range can be plotted.
The ATR is an Exponential Moving Average of the True Range.

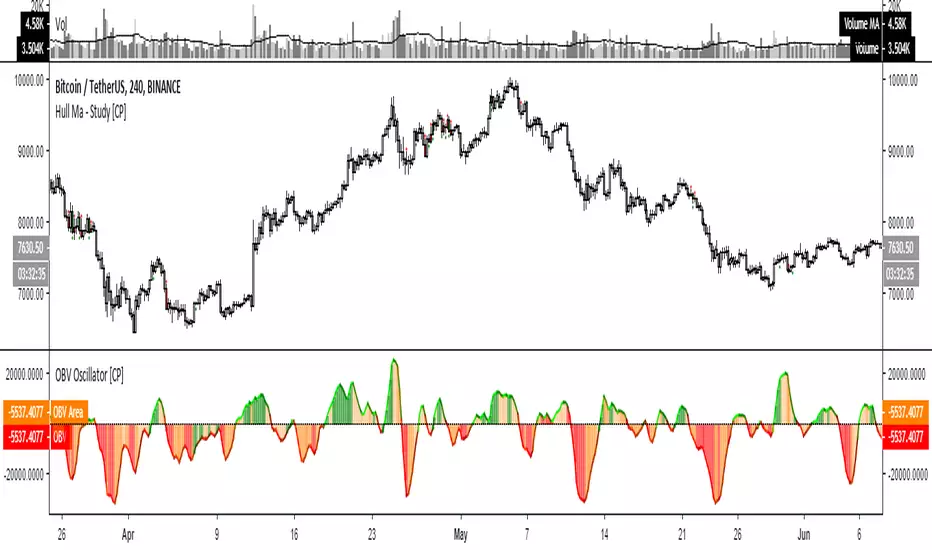
OBV Oscillator [CP]This is my version of the OBV Oscillator and I've used CCI to color the histogram
Line colors:
* Lime rising line above 0 line: Strong Bullish
* Green falling line above 0 line : Neutral Bullish
* Red falling line below 0 line : Strong Bearish
* Maroon rising line below 0 line : Neutral Bearish
Histogram colors:
*Green background above 0 line: Strong Bullish / Overbought
*Orange background above 0 line: Neutral Bullish
*Red background below 0 line: Strong Bearish / Oversold
*Orange background below 0 line: Neutral Bearish